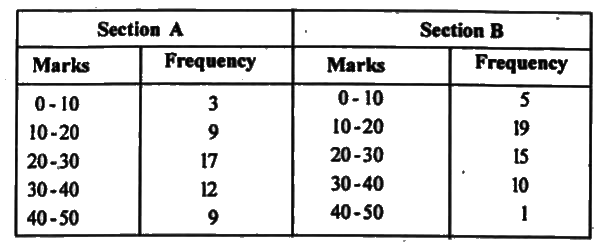
The following table gives the distribution of students of two sections according to the marks obtained by them :

Represent the marks of the students of both the sections on the same graph by two frequency polygons. From the two polygons compare the performance of the two sections. Solution in Kannada
Step by step video & image solution for The following table gives the distribution of students of two sections according to the marks obtained by them : Represent the marks of the students of both the sections on the same graph by two frequency polygons. From the two polygons compare the performance of the two sections. by Maths experts to help you in doubts & scoring excellent marks in Class 9 exams.
Updated on:21/07/2023Topper's Solved these Questions
- STATISTICSBOOK - CPC CAMBRIDGE PUBLICATIONCHAPTER - STATISTICSEXERCISE - EXERCISE 14.4
6 Videos
- STATISTICSBOOK - CPC CAMBRIDGE PUBLICATIONCHAPTER - STATISTICSEXERCISE - EXERCISE 14.2
9 Videos
- QUADRILATERALSBOOK - CPC CAMBRIDGE PUBLICATIONCHAPTER - QUADRILATERALSEXERCISE - EXERCISE 7.2
7 Videos
- SURFACE AREAS AND VOLUMES BOOK - CPC CAMBRIDGE PUBLICATIONCHAPTER - SURFACE AREAS AND VOLUMES EXERCISE - EXERSICE 13.8
10 Videos
Similar Questions
The following number of goals was scored by a team in a series of 10 matches : 2,3,4,5,0,1,3,3,4,3
Find the mean, median and mode of these scores.
View SolutionThe blood groups of 30 students of Class VIII are recorded as follows:
A,B,O,O,AB,O,A,O,B,A,O,B,A,O,O,A,AB,O,A,A,O,O,AB,B,A,O,B,A,B,O
Represent this data in the form of a frequency distribution table. Which is the most common, and which is the rarest, blood group among these students ?
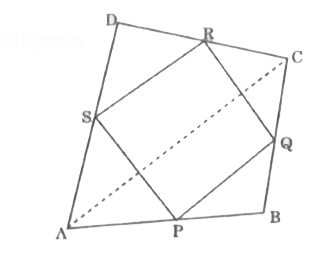
View SolutionABCD is a quadrilateral in which P,Q,R and S are mid points of the sides AB,BC,CD and DA. AC is a diagonal Show that:
SR∣∣ACandSR=12AC
PQ=SR
PQRS is a parallelogram

View SolutionFind the volume of a sphere whose radius is
(i) 7 cm,
(ii) 0.63m
View SolutionThe following table gives the distribution of students of two sections according to the marks obtained by them. Represent the marks of the students of botht the sections on the same graph by two frequency polygon. From the two polygons compare the performance of the two sections.
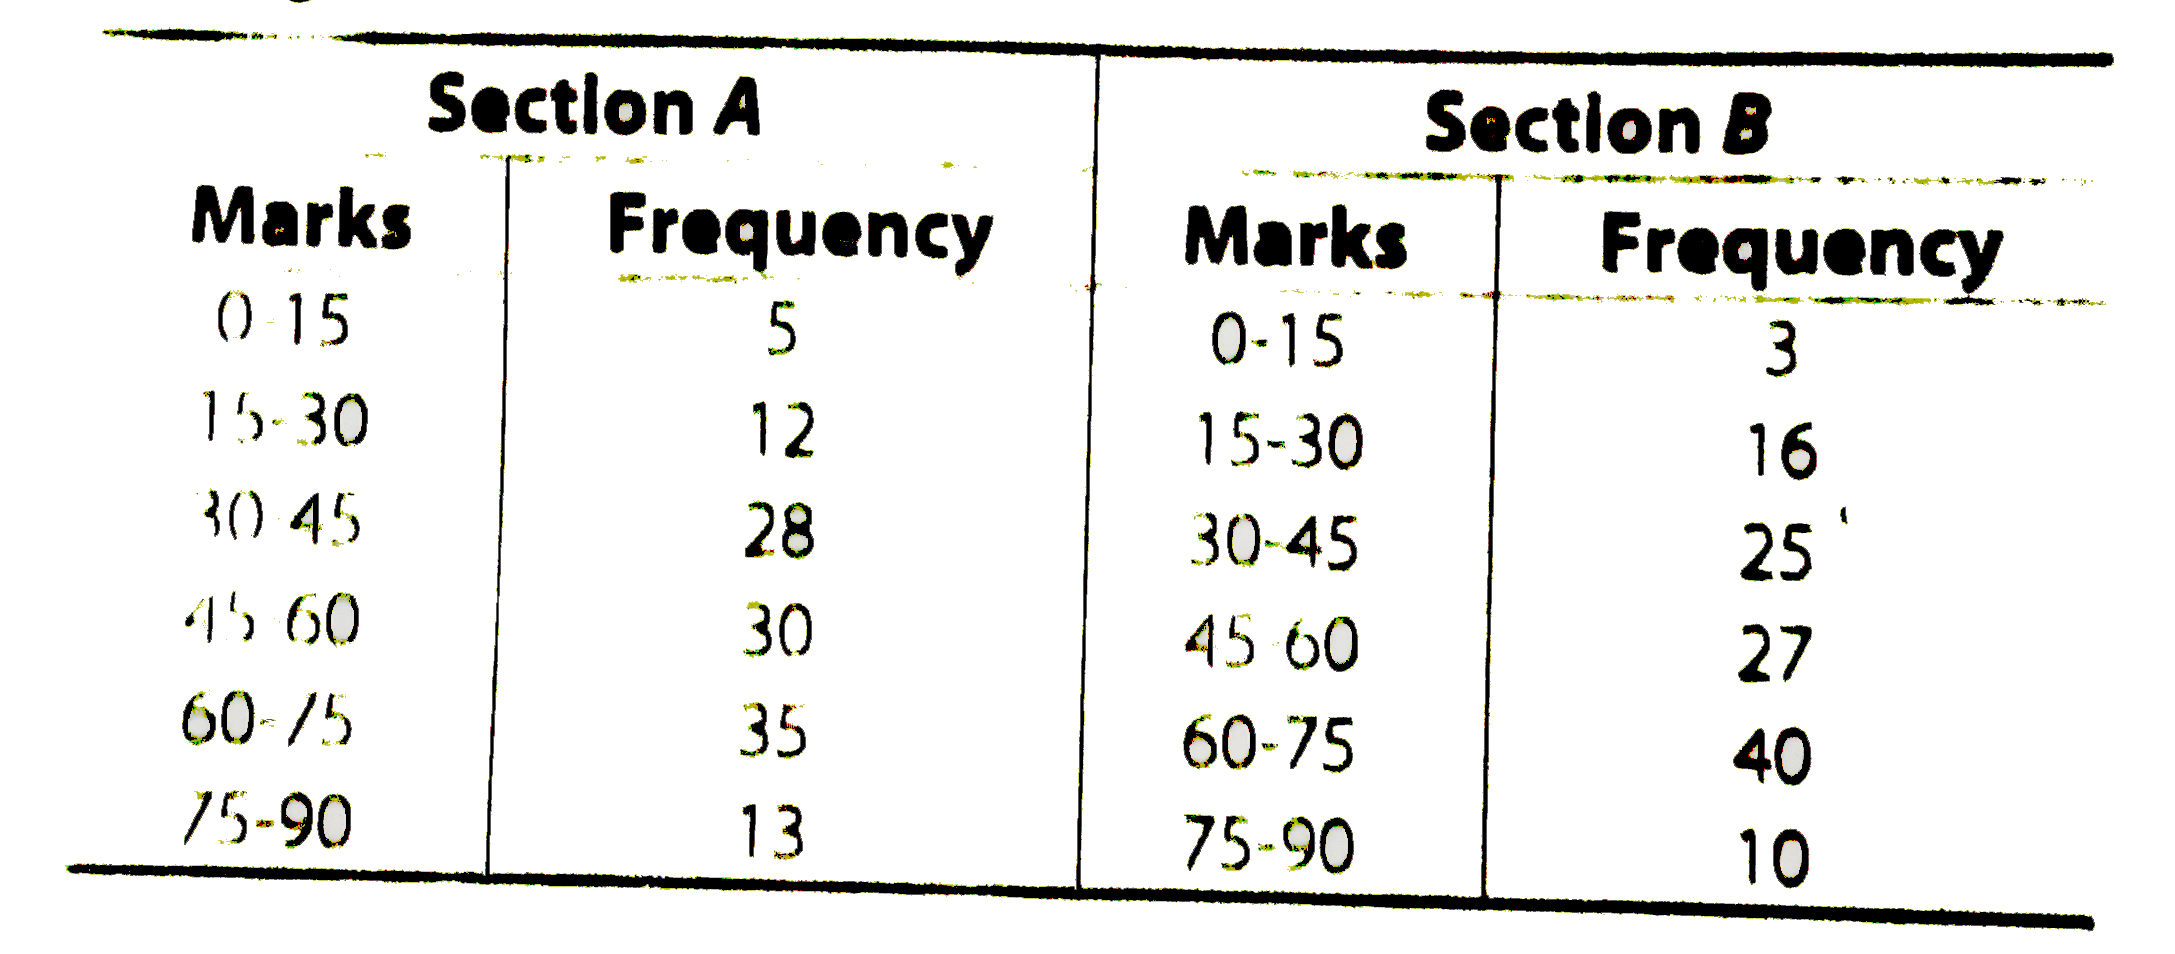
View SolutionFollowing table gives the distribution of students of sections A and B of a class according to the marks obtained by them.

Represent the marks of the students of both the sections on the same graph by two frequency polygons. What do you observe?
View SolutionThe following table gives the distribution of students of two sections according to the marks obtained by them

Represent the marks of the students of both the sections on the same graph by two frquency polygons. From the two polygons compare the performance of the two sections.
View SolutionDetermine the point of symmetry of a regular hexagon.
View SolutionMatch the following Column A to Column B

View SolutionMatch the following Column A to Column B

View SolutionMatch the following Column A to Column B

View SolutionThe inequation represented by the graph given below is :
View SolutionThe inequation that best describes the graph given below is _________
View SolutionThe inequation that best describes the following graph is _________
View SolutionWhich inequations represent the shaded region in the given figure
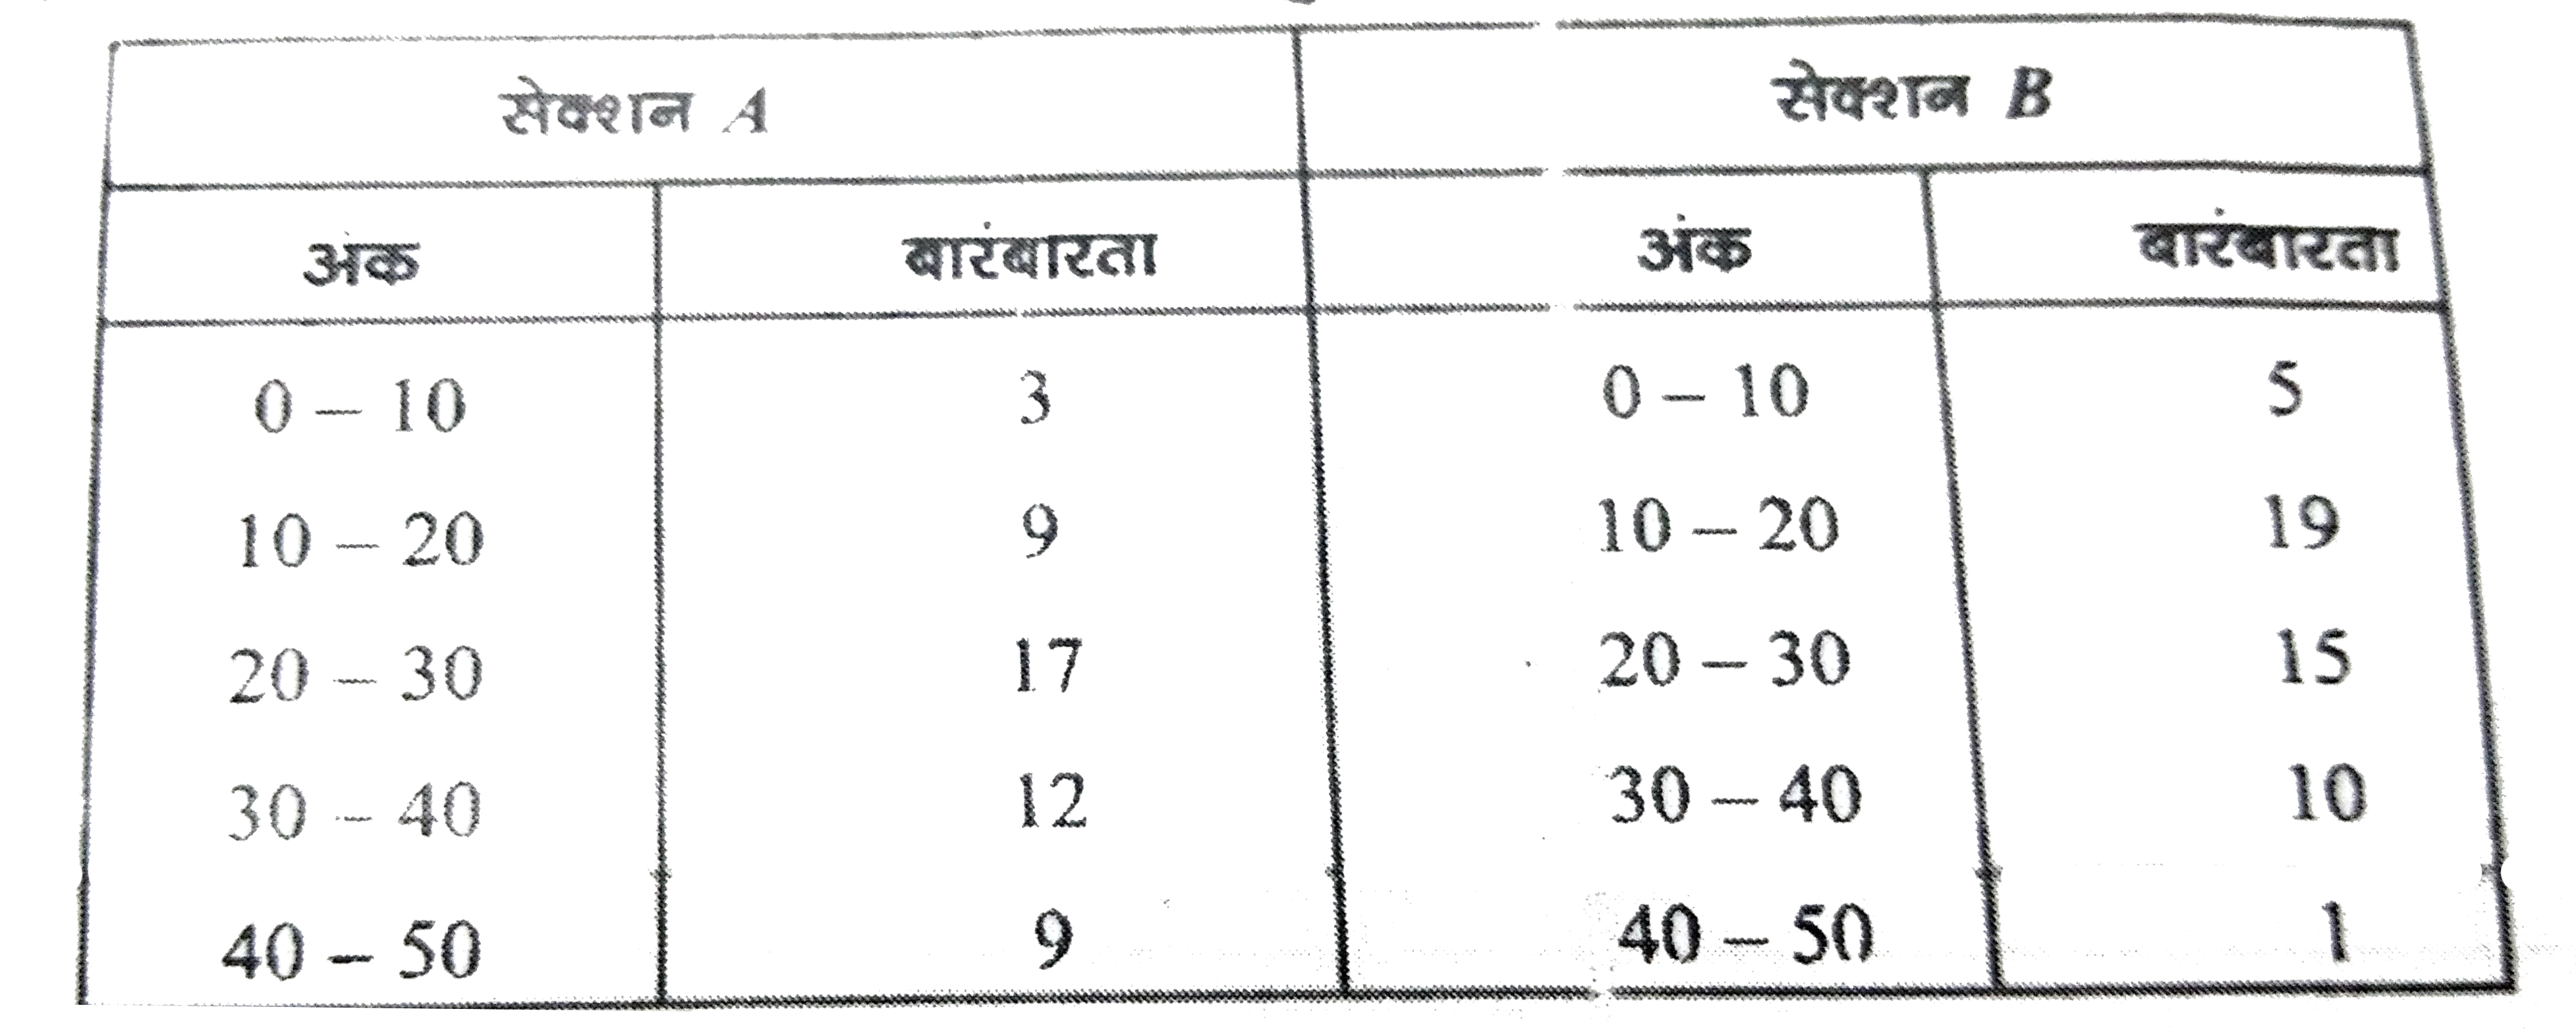
View Solutionनीचे की दो सारणियों में प्राप्त किए गए अंकों के अनुसार दो सेक्शनों के विद्यार्थियों का बंटन दिया गया है :

दो बारम्बारता बहुभुजों की सहायता से एक ही आलेख पर दोनों सेक्शनों के विद्यार्थियों के प्राप्तांक निरूपित कीजिए। दोनों बहुभुजों का अध्ययन करके दोनों सेक्शनों के निष्पादनों कि तुलना कीजिए ।
View Solution
