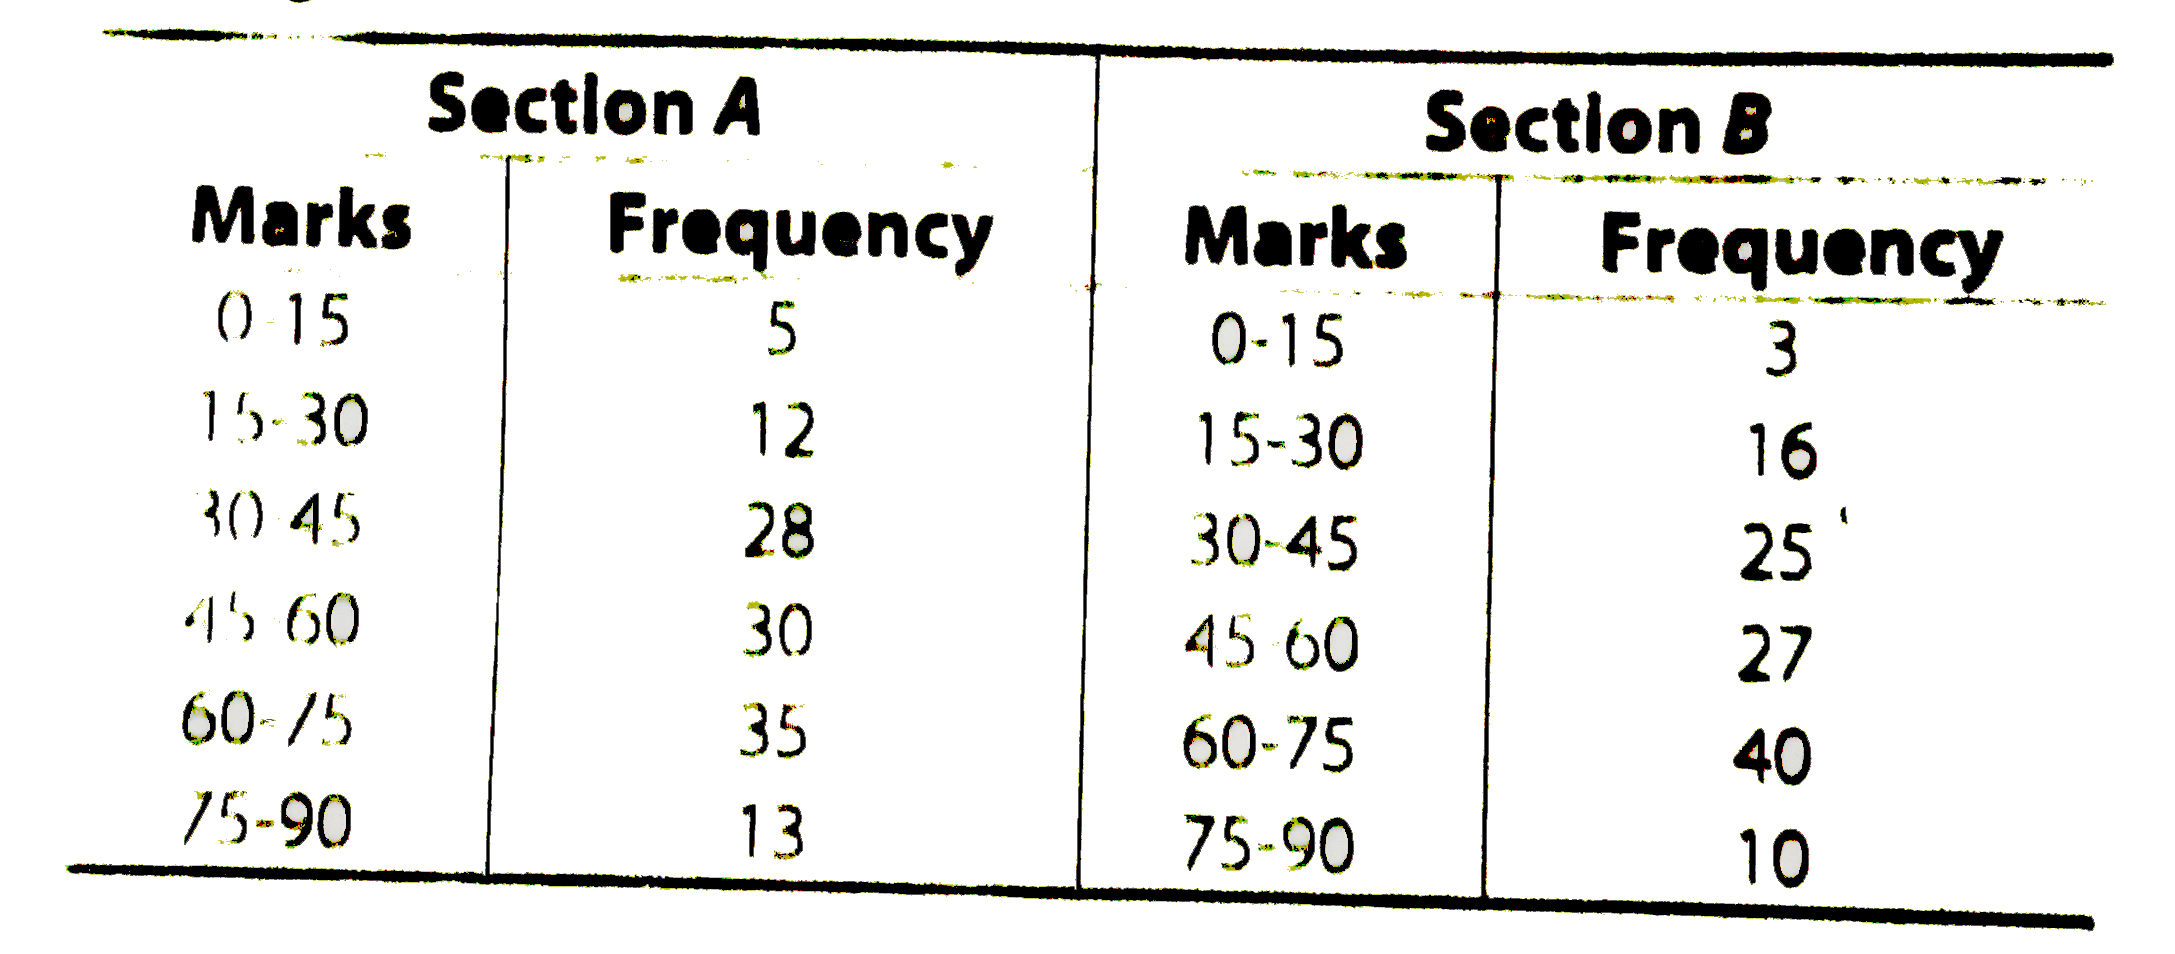
The following table gives the distribution of students of two sections according to the marks obtained by them

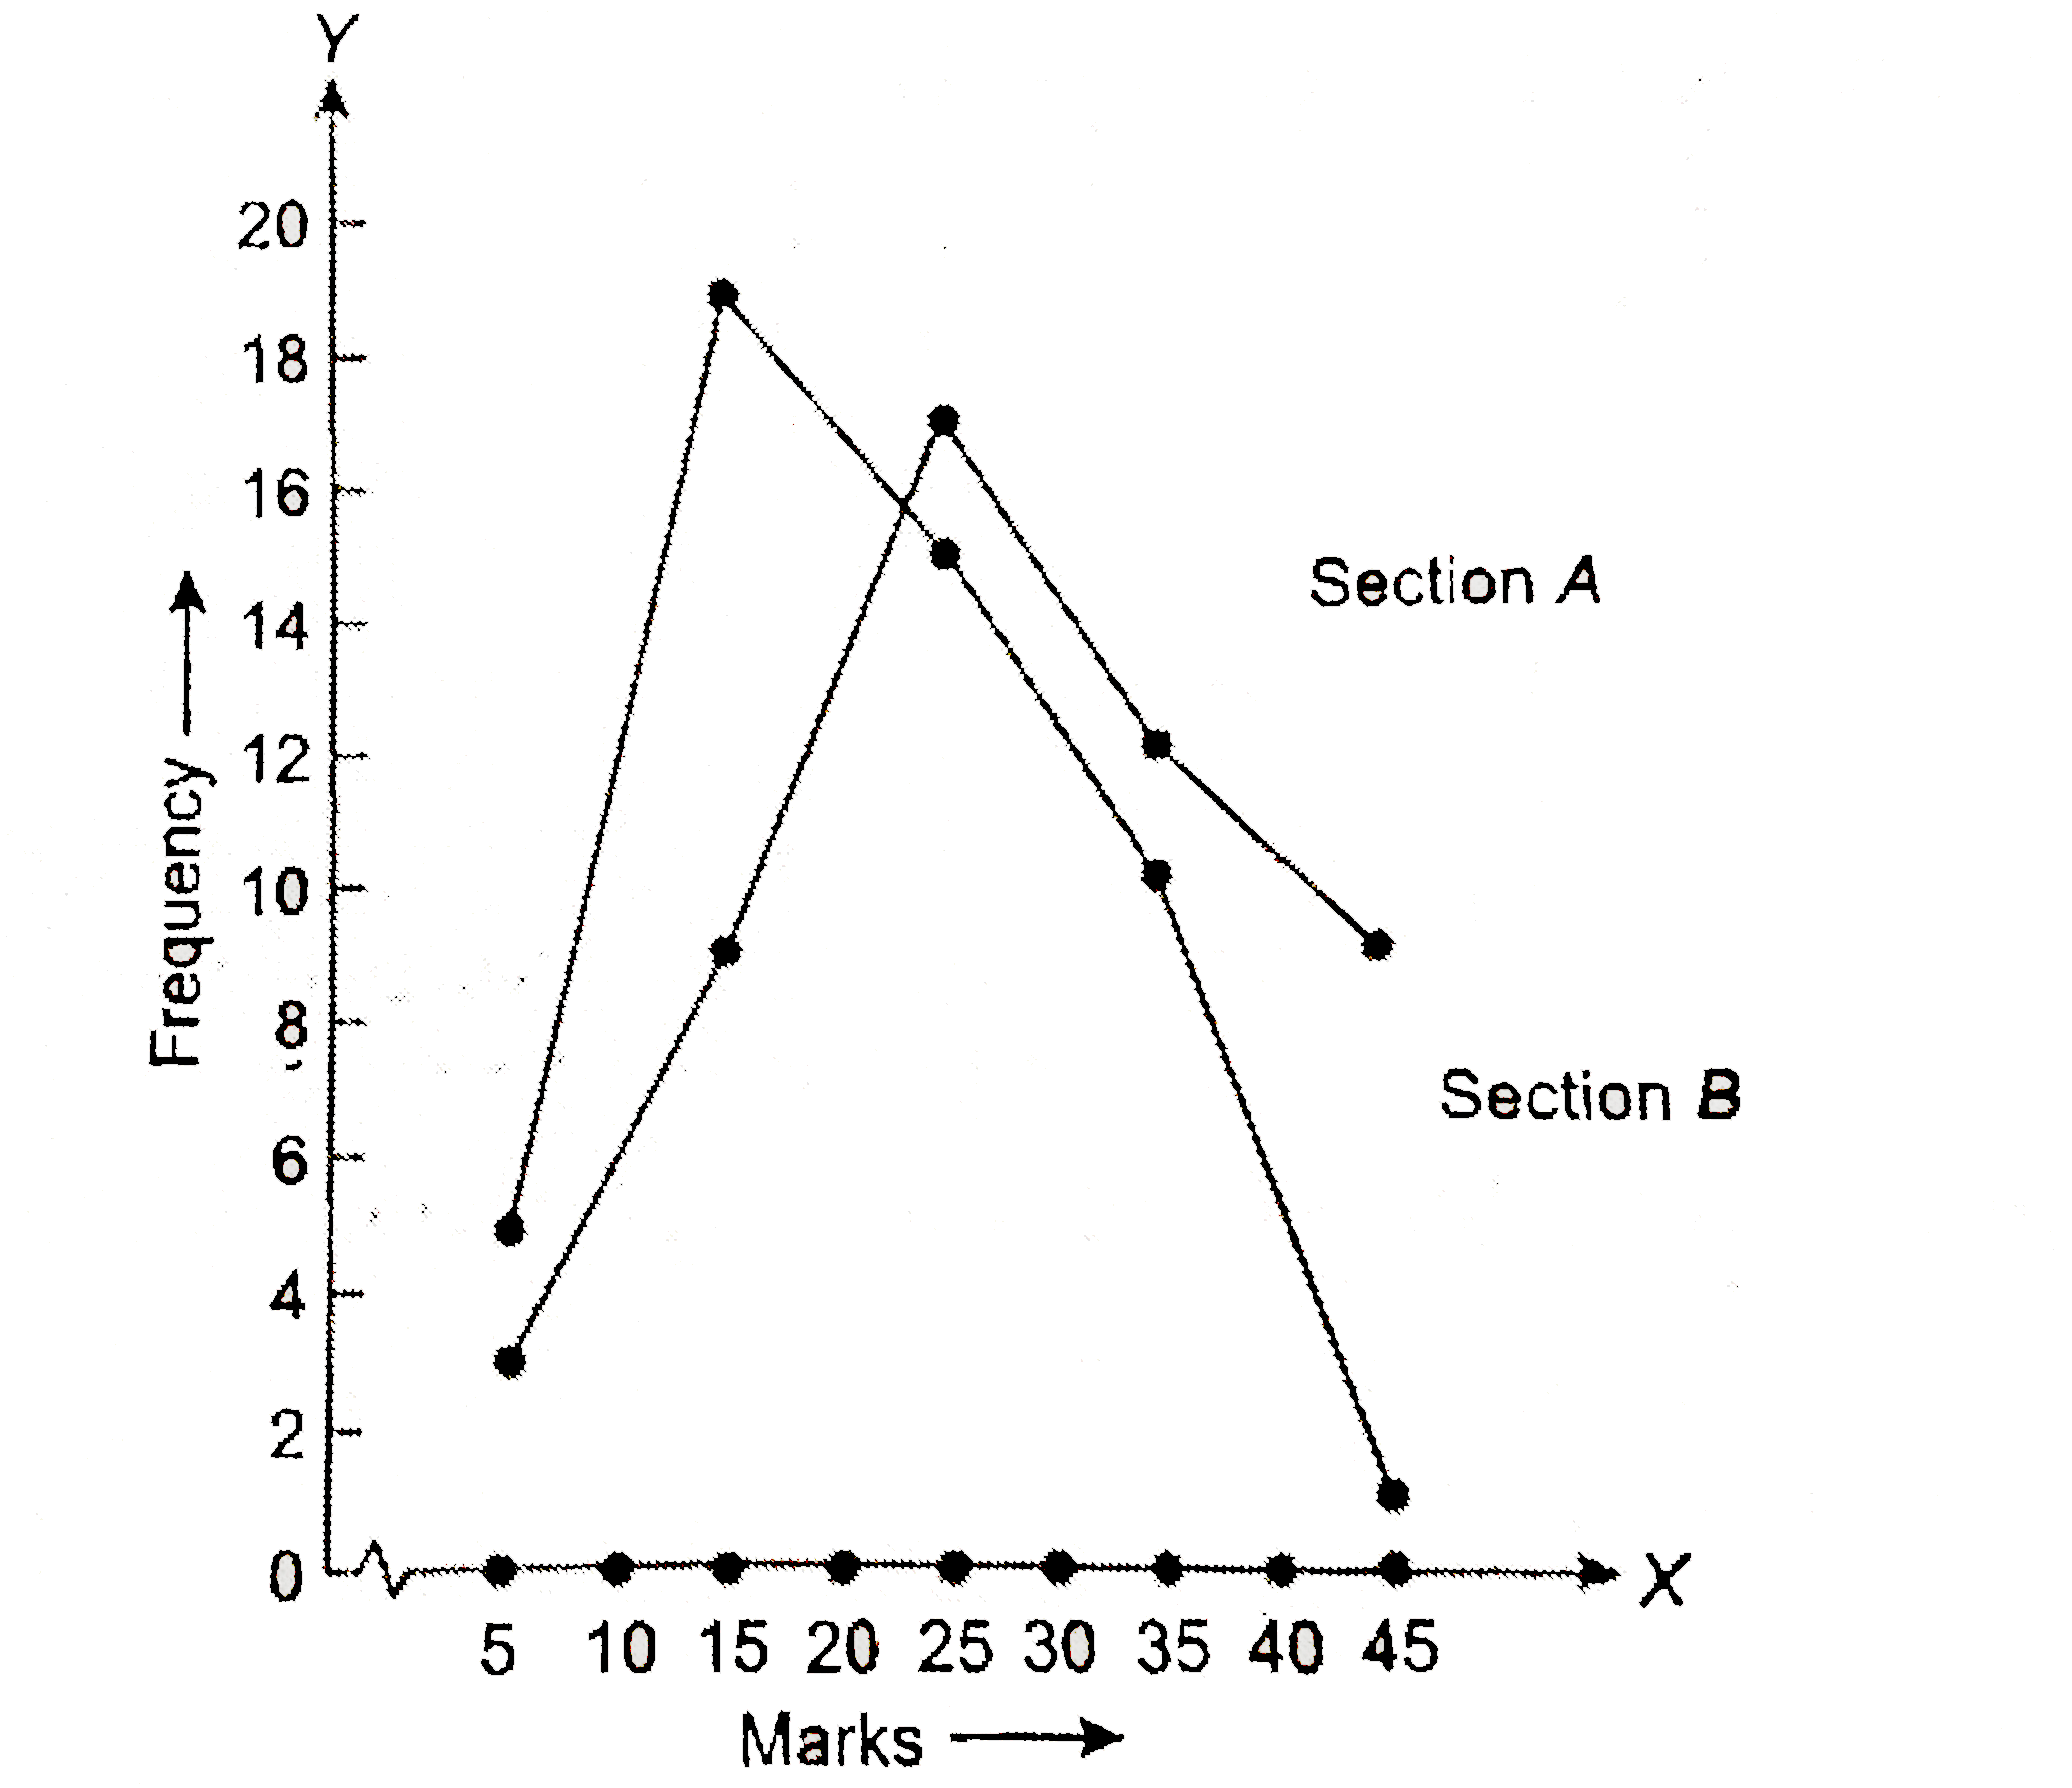
Represent the marks of the students of both the sections on the same graph by two frquency polygons. From the two polygons compare the performance of the two sections.
Here, we make modified tables by given data.
For section A,

For section B,

Now, required frequency polygon curves are:

Topper's Solved these Questions
- STATISTICSBook:NAGEEN PRAKASHANChapter:STATISTICSExercise:Exercise 14a
Explore 10 Videos
- STATISTICSBook:NAGEEN PRAKASHANChapter:STATISTICSExercise:Exercise 14c
Explore 20 Videos
- STATISTICSBook:NAGEEN PRAKASHANChapter:STATISTICSExercise:Revision Exercise
Explore 10 Videos
- QUADRILATERALSBook:NAGEEN PRAKASHANChapter:QUADRILATERALSExercise:Revision Exercise (long Answer Questions)
Explore 5 Videos
- SURFACE AREA AND VOLUMEBook:NAGEEN PRAKASHANChapter:SURFACE AREA AND VOLUMEExercise:Revision Exercise (long Answer Questions)
Explore 10 Videos
Similar Questions
The following table gives the distribution of students of two sections according to the marks obtained by them. Represent the marks of the students of botht the sections on the same graph by two frequency polygon. From the two polygons compare the performance of the two sections.
View SolutionFollowing table gives the distribution of students of sections A and B of a class according to the marks obtained by them.

Represent the marks of the students of both the sections on the same graph by two frequency polygons. What do you observe?
View SolutionThe following table represent marks obtained by 100 students in a test.

Find mean marks of the students.
View SolutionThe following table gives the data on the marks obtained by two students 'A and B' in five subjects :

Represent the data by a multiple bar diagram.
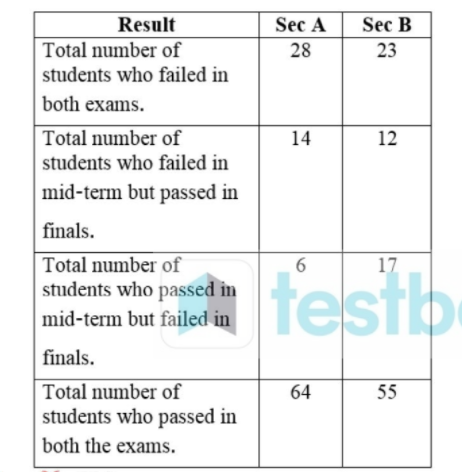
View SolutionThe below table gives the details of the number of students in Class 10, section A and B who had taken mid-term and final exam. What is the total number of students in both, section A and B?

View SolutionIf the average marks of 30 students of section A is 55 and the average marks of 30 students of section B is 60 ,then find the combined average of both the sections.
View SolutionIf the average marks of 30 students of section A is 55 and the average marks of 30 students of section B is 60 ,then find the combined average of both the sections.
View SolutionThe following table shows the classification of percentages of marks of students and the number of students. Draw a frequency polygon from the table.

View SolutionThe frequency distribution of marks obtained by students in a class test is given below .
Draw frequency polygon and ogive.

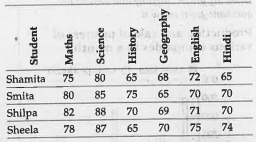
View SolutionThe following table represents the percentage marks of four students in six subjects. Consider the table and answer questions based on it.

The average marks obtained by the students in Geography and History are
View Solution
