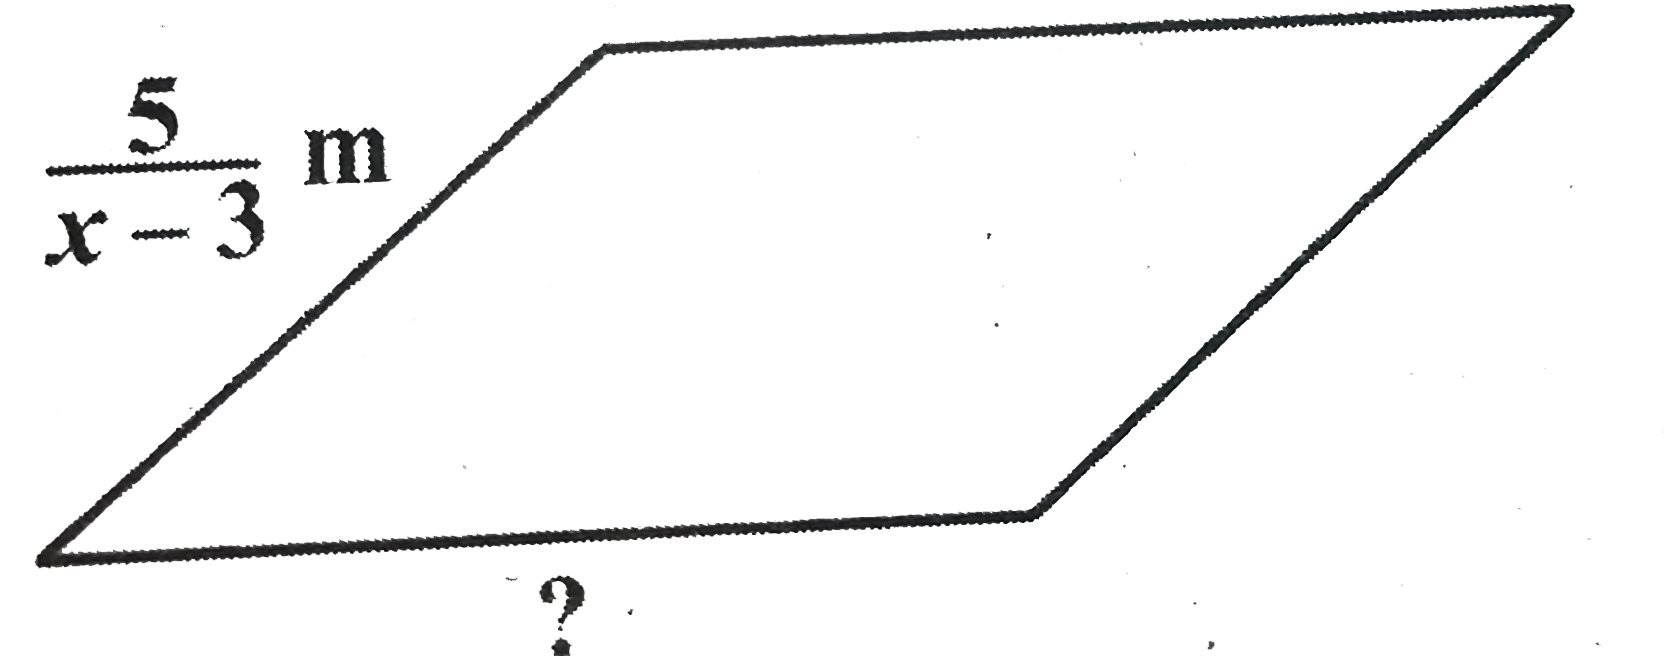
Find the base of the given parallelogram whose perimeter is =4x2+10x−50(x−3)(x+5).
 Solution in Tamil
Step by step video & image solution for Find the base of the given parallelogram whose perimeter is =(4x^(2)+10x-50)/((x-3)(x+5)). by Maths experts to help you in doubts & scoring excellent marks in Class 10 exams.
Topper's Solved these Questions
- BOOK - PREMIERS PUBLISHERSCHAPTER - ALGEBRAEXERCISE - SOLUTION TO ACTIVITIES7videos
ALGEBRA
- BOOK - PREMIERS PUBLISHERSCHAPTER - ALGEBRAEXERCISE - OTHER IMPORTANT OBJECTIVE TYPE QUESTIONS28videos
ALGEBRA
- BOOK - PREMIERS PUBLISHERSCHAPTER - ALGEBRAEXERCISE - SOLUTION THINKING CORNER (Say True or False:)1videos
ALGEBRA
- BOOK - PREMIERS PUBLISHERSCHAPTER - CO-ORDINATE GEOMETRY EXERCISE - Other Important Objective25videos
CO-ORDINATE GEOMETRY
Similar Questions
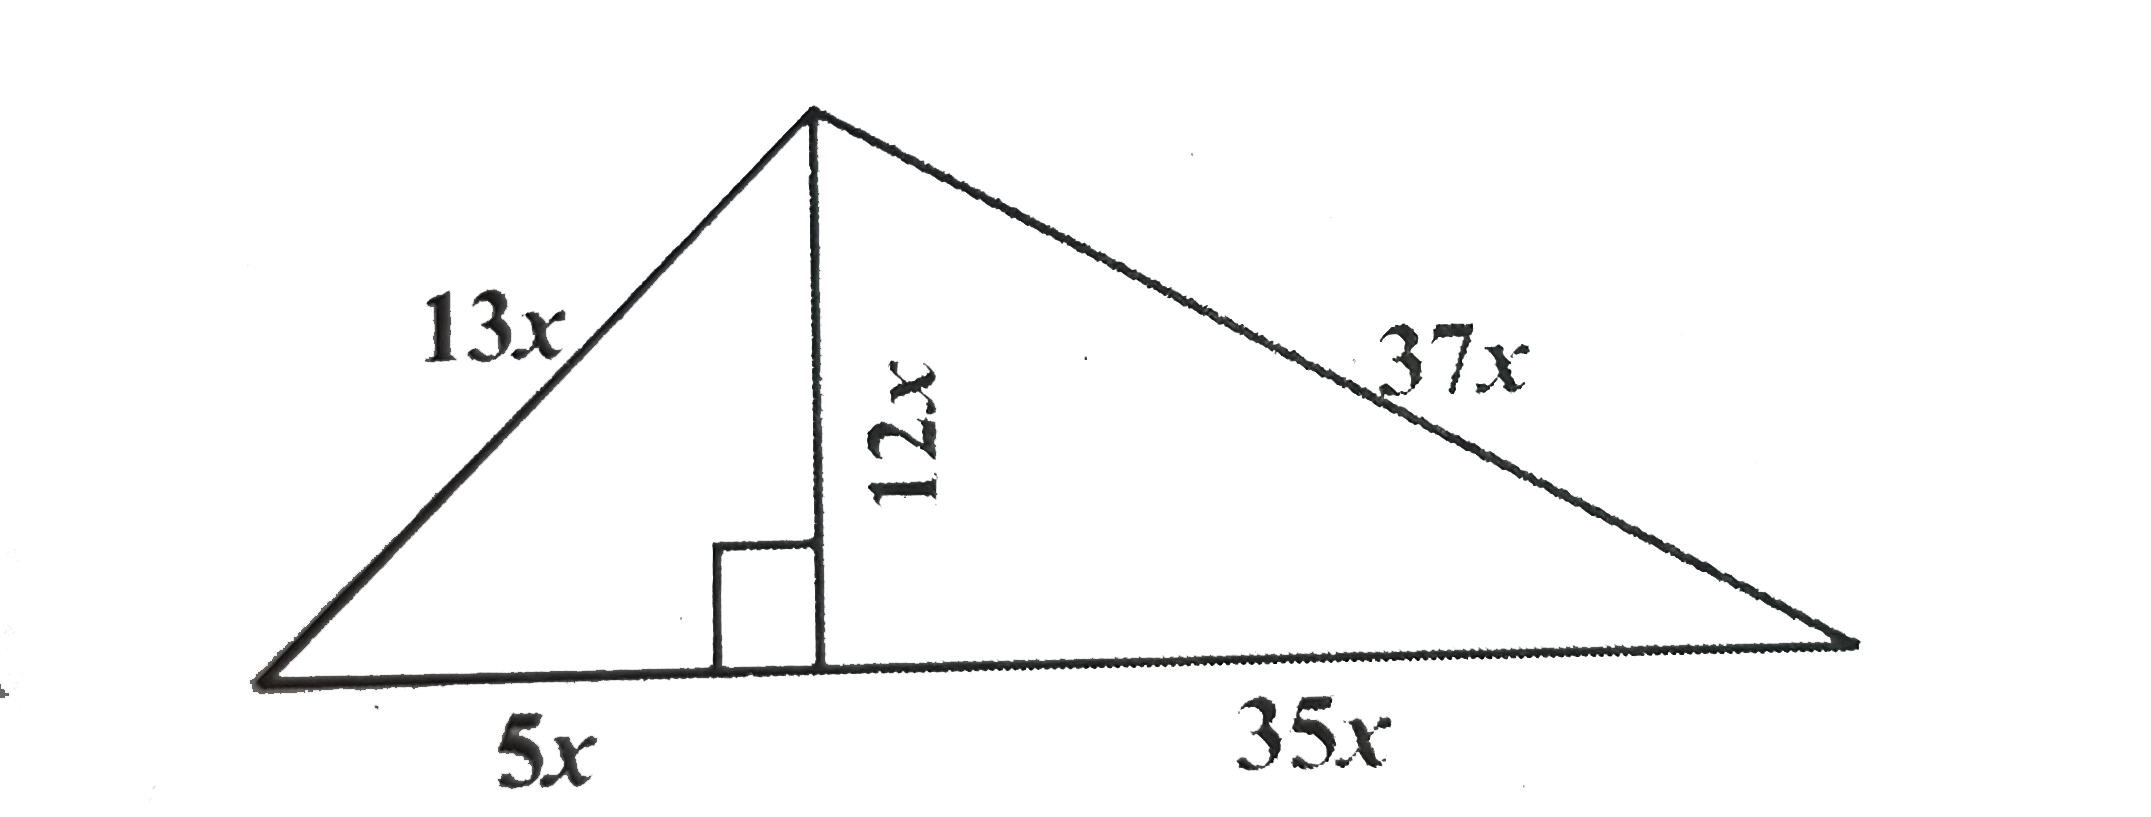
Find the ratio of the perimeter to the area of the given triangle.
 02:11View Solution
A linear equation in two variables represent a ………………. In xy plane.
01:31View SolutionFill up the empty box in each of the given expression so that the resulting quadratic polynomial becomes a perfect square.
(i) x2+14x+ …………….
(ii) x2−24x+ ……………..
(iii) (p)2+2qp+ ………………..02:45View SolutionThe area of the triangle formed by the points (0,0),(3,0) and (0,4) is :
02:17View SolutionDetermine the point of symmetry of a regular hexagon.
05:41View SolutionDtermine the images of the following figure about the given line :
03:28View SolutionMatch the following Column A to Column B
 02:31View Solution
Match the following Column A to Column B
 02:21View Solution
Match the following Column A to Column B
 02:10View Solution
Find the area of figure given below.
 02:17View Solution
Find the perimeter of the figure given below.
 02:10View Solution
Find the area of the figure given below.
 04:23View Solution
The inequation represented by the graph given below is :
01:13View SolutionThe inequation that best describes the graph given below is _________
01:50View SolutionThe inequation that best describes the following graph is _________
03:10View SolutionWhich inequations represent the shaded region in the given figure
02:34View Solution

