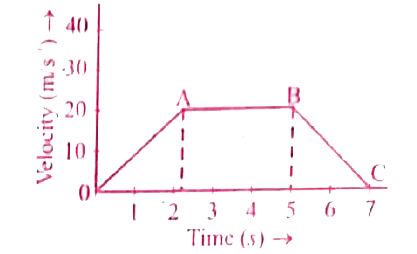
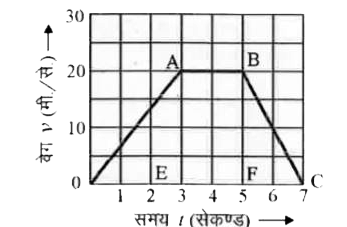
The velocity -time graph for a vehicle is shown in the figure . Draw acceleration-time graph from it
 Solution in Tamil
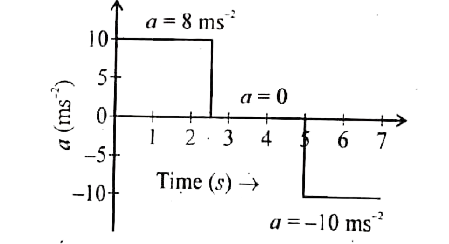
In time 0 to 2.5 s , acceleration of the vehicle,
a = slope of OA =20−02.5−0=8ms−2
In time 2.5 to 5s, velocity of the vehicle is uniform .
So acceleration = 0
In time 5 to 7s , acceleration of the vehicle,
a = slope of BC =0−207−5
=−10ms−2
Hence the acceleration-time graph will be as shown in the figure .
Topper's Solved these Questions
- KINEMATICS BOOK - PREMIERS PUBLISHERSCHAPTER - KINEMATICS EXERCISE - Other important questions & answers (IV. Long answer questions).
34 Videos
- GRAVITATIONBOOK - PREMIERS PUBLISHERSCHAPTER - GRAVITATIONEXERCISE - OTHER IMPORTANT QUESTION & ANSWERS (CONCEPTUAL QUESTIONS)
34 Videos
- KINETIC THEORY OF GASESBOOK - PREMIERS PUBLISHERSCHAPTER - KINETIC THEORY OF GASESEXERCISE - OTHER IMPORTANT QUESTIONS & ANSWERS (VI. Conceptual Questions.)
8 Videos
Similar Questions
Define and illustrate the following terms.
Equal vectors.
View SolutionWhy a body weighs less at the equator than at the poles?
View SolutionWhen an automobile travels for a long distance , the air pressure in the tyres increases slightly . Why ?
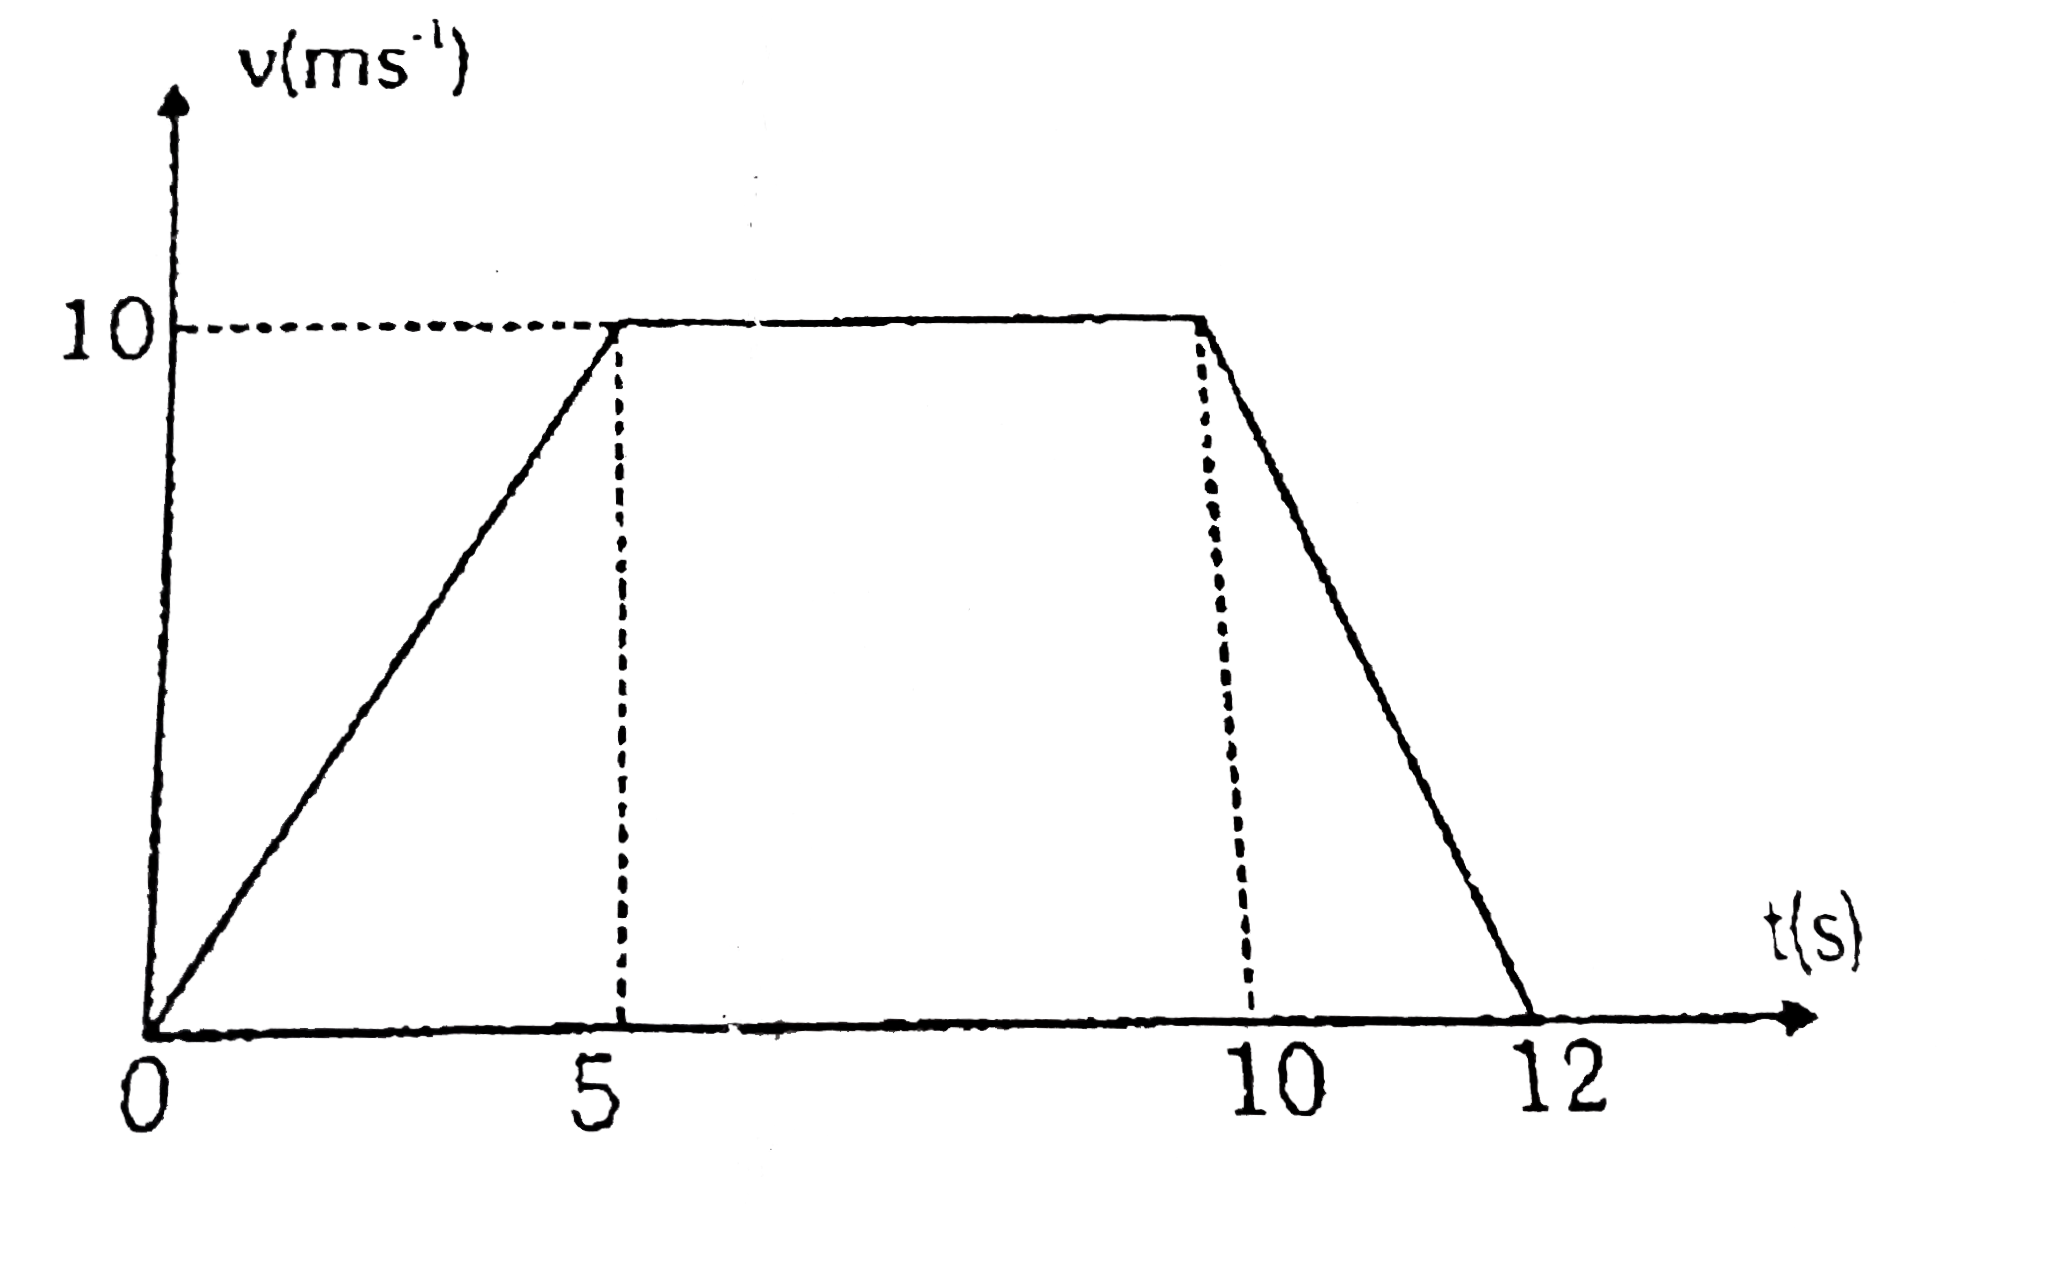
View SolutionDraw displacement time and acceleration -time graph for the given velocity-time graph
View Solutionthe velcoity - time graph for a vehicle is shown if fig 3.24. drow acceleration - time graph from it .
View SolutionThe graph in figure shows the velocity v versus time t for a body. Which of the graphs shown in figure represents the correesponding acceleration versus time graphs ?
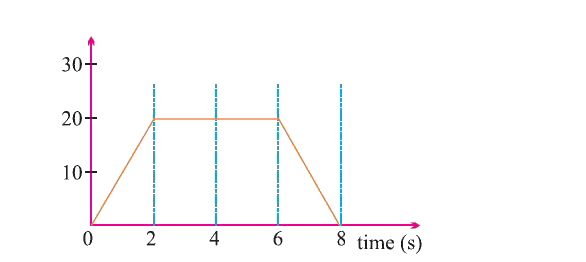
View SolutionThe velocity time graph for a particle is shown in figure. Draw acceleration time graph from it.
View SolutionThe velocity -time graph for a vehicle is shown in the figure . Draw acceleration-time graph from it

View Solutionसंलग्न चित्र में किसी वाहन के लिए दिये गये समय - वेग ग्राफ से त्वरण-समय ग्राफ खींचिये |
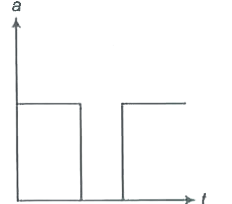
View Solutionचित्र में किसी वस्तु के लिए त्वरण-समय ग्राफ प्रदर्शित किया गया है। इसी वस्तु के लिए वेग-समय ग्राफ होगा
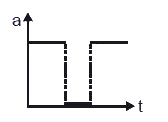
View Solutionकिसी वस्तु के लिये त्वरण-समय ग्राफ चित्र में दिखाया गया है। तो संगत वेग-समय ग्राफ होगा :
View SolutionDraw the velocity-time graph for uniformly accelerated motion. Show that slope of the velocity-time graph gives acceleration of the object.
View SolutionDisplacement-time graph of any object is shown in the adjacent figure. Draw velocity-time graph for this motion.
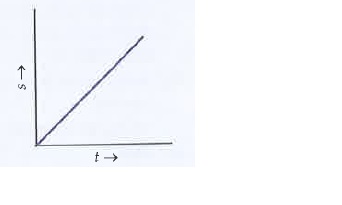
View SolutionAcceleration-time graph of a moving object is shown in figure. Draw the velocity- time graph and displacement-time graph corresponding to this type of motion. .
View SolutionAcceleration -time graph of a body starts from rest as shown below :
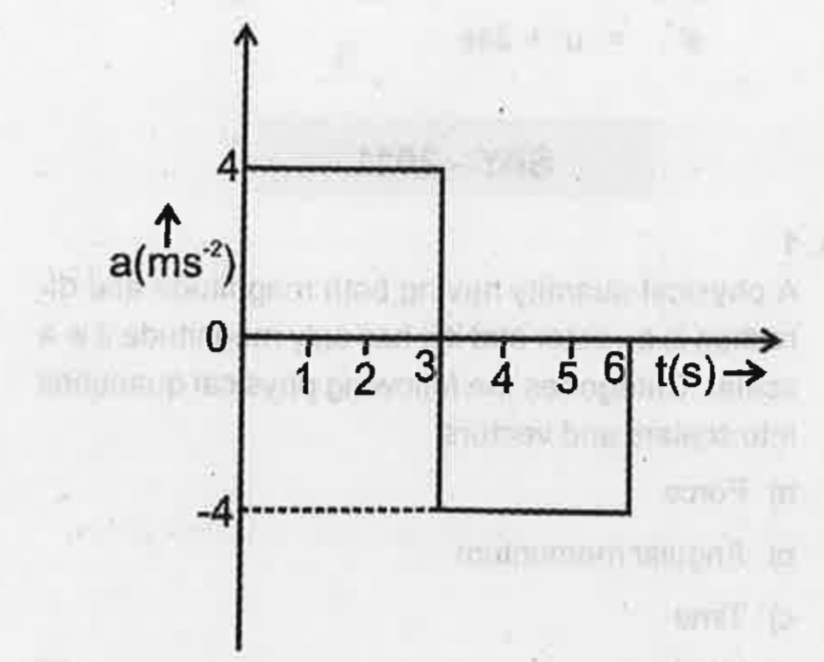
Draw the velocity-time graph using the above graph
View Solution
