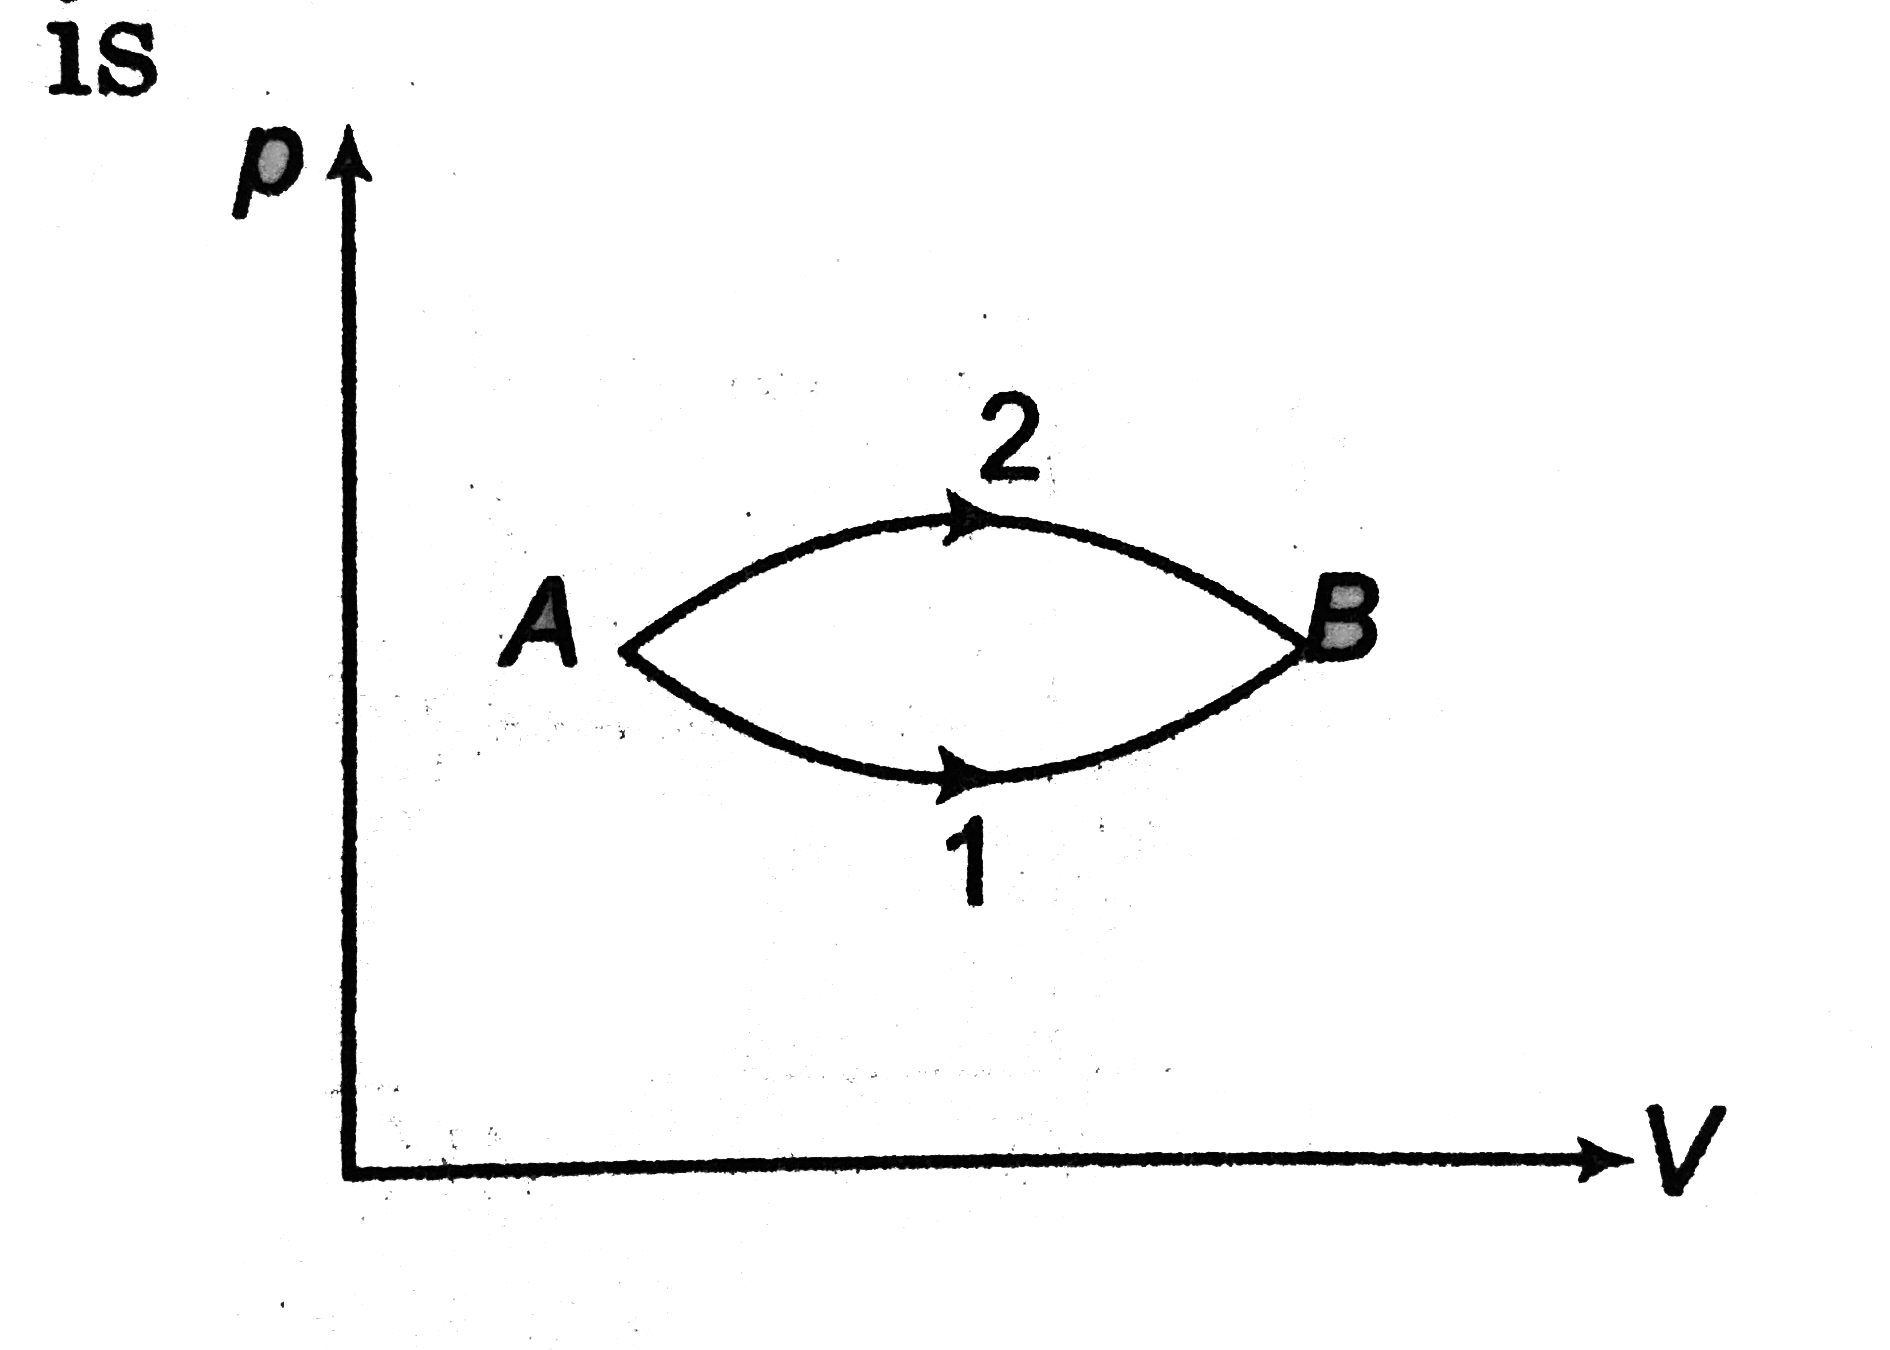
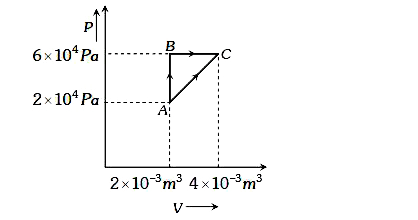
The figure shows two paths for the change of state of a gas from A to B. The ratio of molar heat capacities in path 1 and path 2 is
>1
<1
1
Data insufficient
The correct Answer is:B
Q1=ΔU+W1,Q2=ΔU+W2
Ratio of specific heats
C1C2=(ΔQ1ΔT)(ΔQ2ΔT)=(ΔUΔT+ΔW1ΔT)(ΔUΔT+ΔW2ΔT)<1(∵W2>W1)
Topper's Solved these Questions
- GEOMETRICAL OPTICSBOOK - ALLENCHAPTER - GEOMETRICAL OPTICSEXERCISE - EXERCISE -03
11 Videos
- GEOMETRICAL OPTICSBOOK - ALLENCHAPTER - GEOMETRICAL OPTICSEXERCISE - ASSERTION-REASON
40 Videos
- GEOMETRICAL OPTICSBOOK - ALLENCHAPTER - GEOMETRICAL OPTICSEXERCISE - EXERCISE -01
65 Videos
- CURRENT ELECTRICITYBOOK - ALLENCHAPTER - CURRENT ELECTRICITYEXERCISE - All Questions
427 Videos
- GRAVITATIONBOOK - ALLENCHAPTER - GRAVITATIONEXERCISE - EXERCISE 4
9 Videos
Similar Questions
The figure shows two paths through which a gas can be taken from state A to state B. If the ratio of work done by the gas in the two paths is xy, then find (x+y).
'(##CEN_KSR_PHY_JEE_C15_E01_001_Q01##)'
View SolutionThe given figure shows a change of state A to state C by two paths. ABC and AC for an ideal gas. Calculate the ,
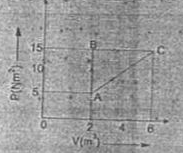
(a) Path along which work done is least.
(b) Internal energy at C if the internal energy of gas at A is 10 J and amount of heat supplied to change its state to C through the path AC is 200 J.
( c) Amount of heat supplied to the gas to gd from A to B, if internal energy of gas at state B is 10 J.
(ii) In an insulated contained 1 mole of a liquid, molar volume 100 mL. is at 1 bar liquid is steeply taken to 100 bar, where volume of liquid decreases by 1 mL. Find ΔE and ΔH for the process?
(iii) 14 g of oxygen at 0∘ C and 10 atm are subjected to reversible adiabatic expansion to a pressure of 1 atm. Calculate the work done in
(i) Litre atm.
(ii) Calorie (Given, CpCv=1.4).
View Solution
Knowledge Check
In (figure). shows two path that may be taken by a gas to go from a state A to state C
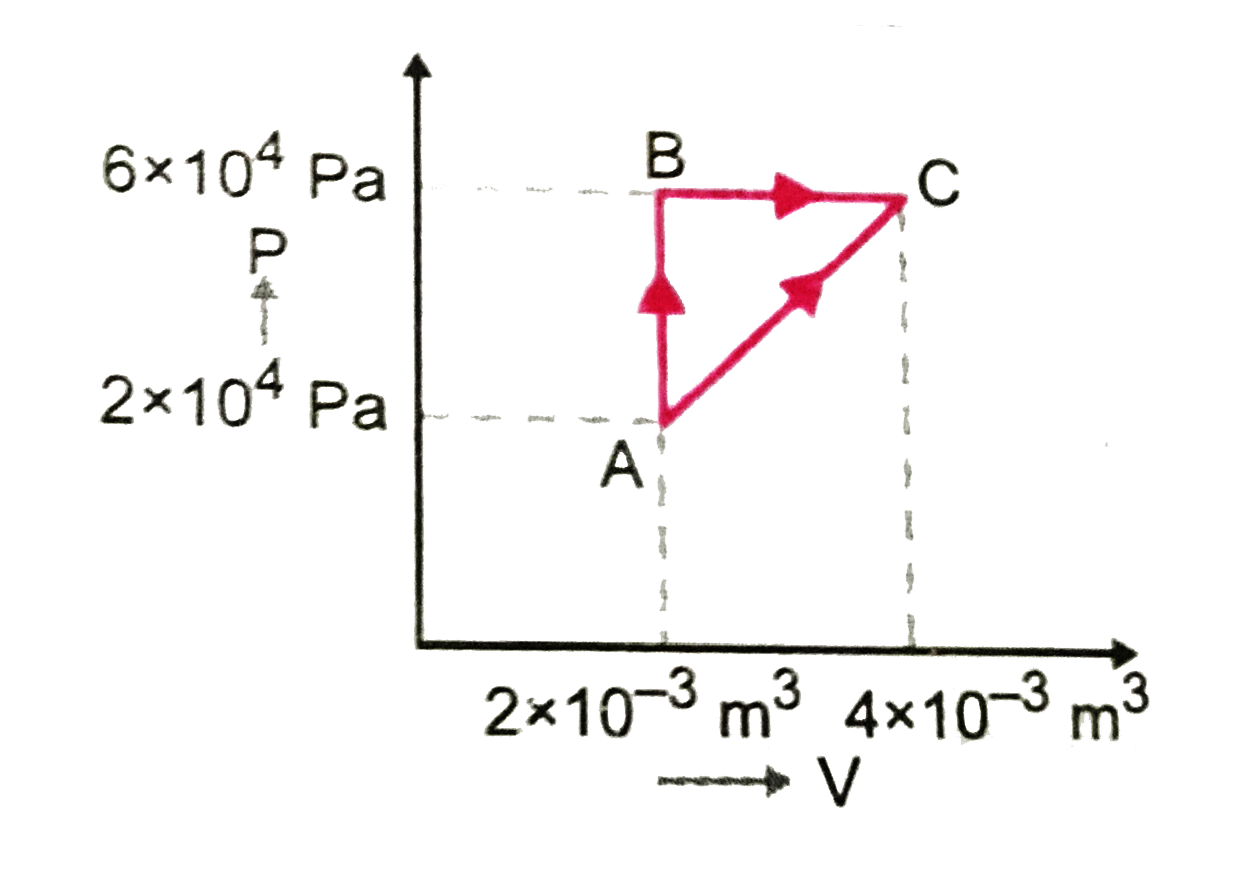
In the process AB, 400J of heat is added to the system and in process Bc, 100J of heat is added to the system. The heat absorbed by the system in the process AC will beA500JB460JC300JD380JIn the graph shown below A-B, B-C , C-D are parts of the carnot cycle operating on an ideal gas.Consider only the path from State 1 to State 2 . W denotes the work in the path. Equations and plots in the table have standard notations γ is the ratio of heat capacities at constant pressure and constant volume. The moles of the gas is 'n'.

For which of the following options dQrev(sys)T>0 and simultaneously dQirrev(sys)T>0 If taken irreversiblyA(I)(iv)(Q)B(IV)(i)(P)C(II)(iii)(R)DNone of theseIn the graph shown below A-B, B-C , C-D are parts of the carnot cycle operating on an ideal gas.Consider only the path from State 1 to State 2 . W denotes the work in the path. Equations and plots in the table have standard notations γ is the ratio of heat capacities at constant pressure and constant volume. The moles of the gas is 'n'.

For which of the following options dQirrev(sys)T>dQrev(sys)TA(I)(iv)(Q)B(IV)(i)(P)C(II)(iii)(R)DNone of these
The given figure shown a change of state A to state C by two paths ABC and AC for an ideal gas. Calculate the :
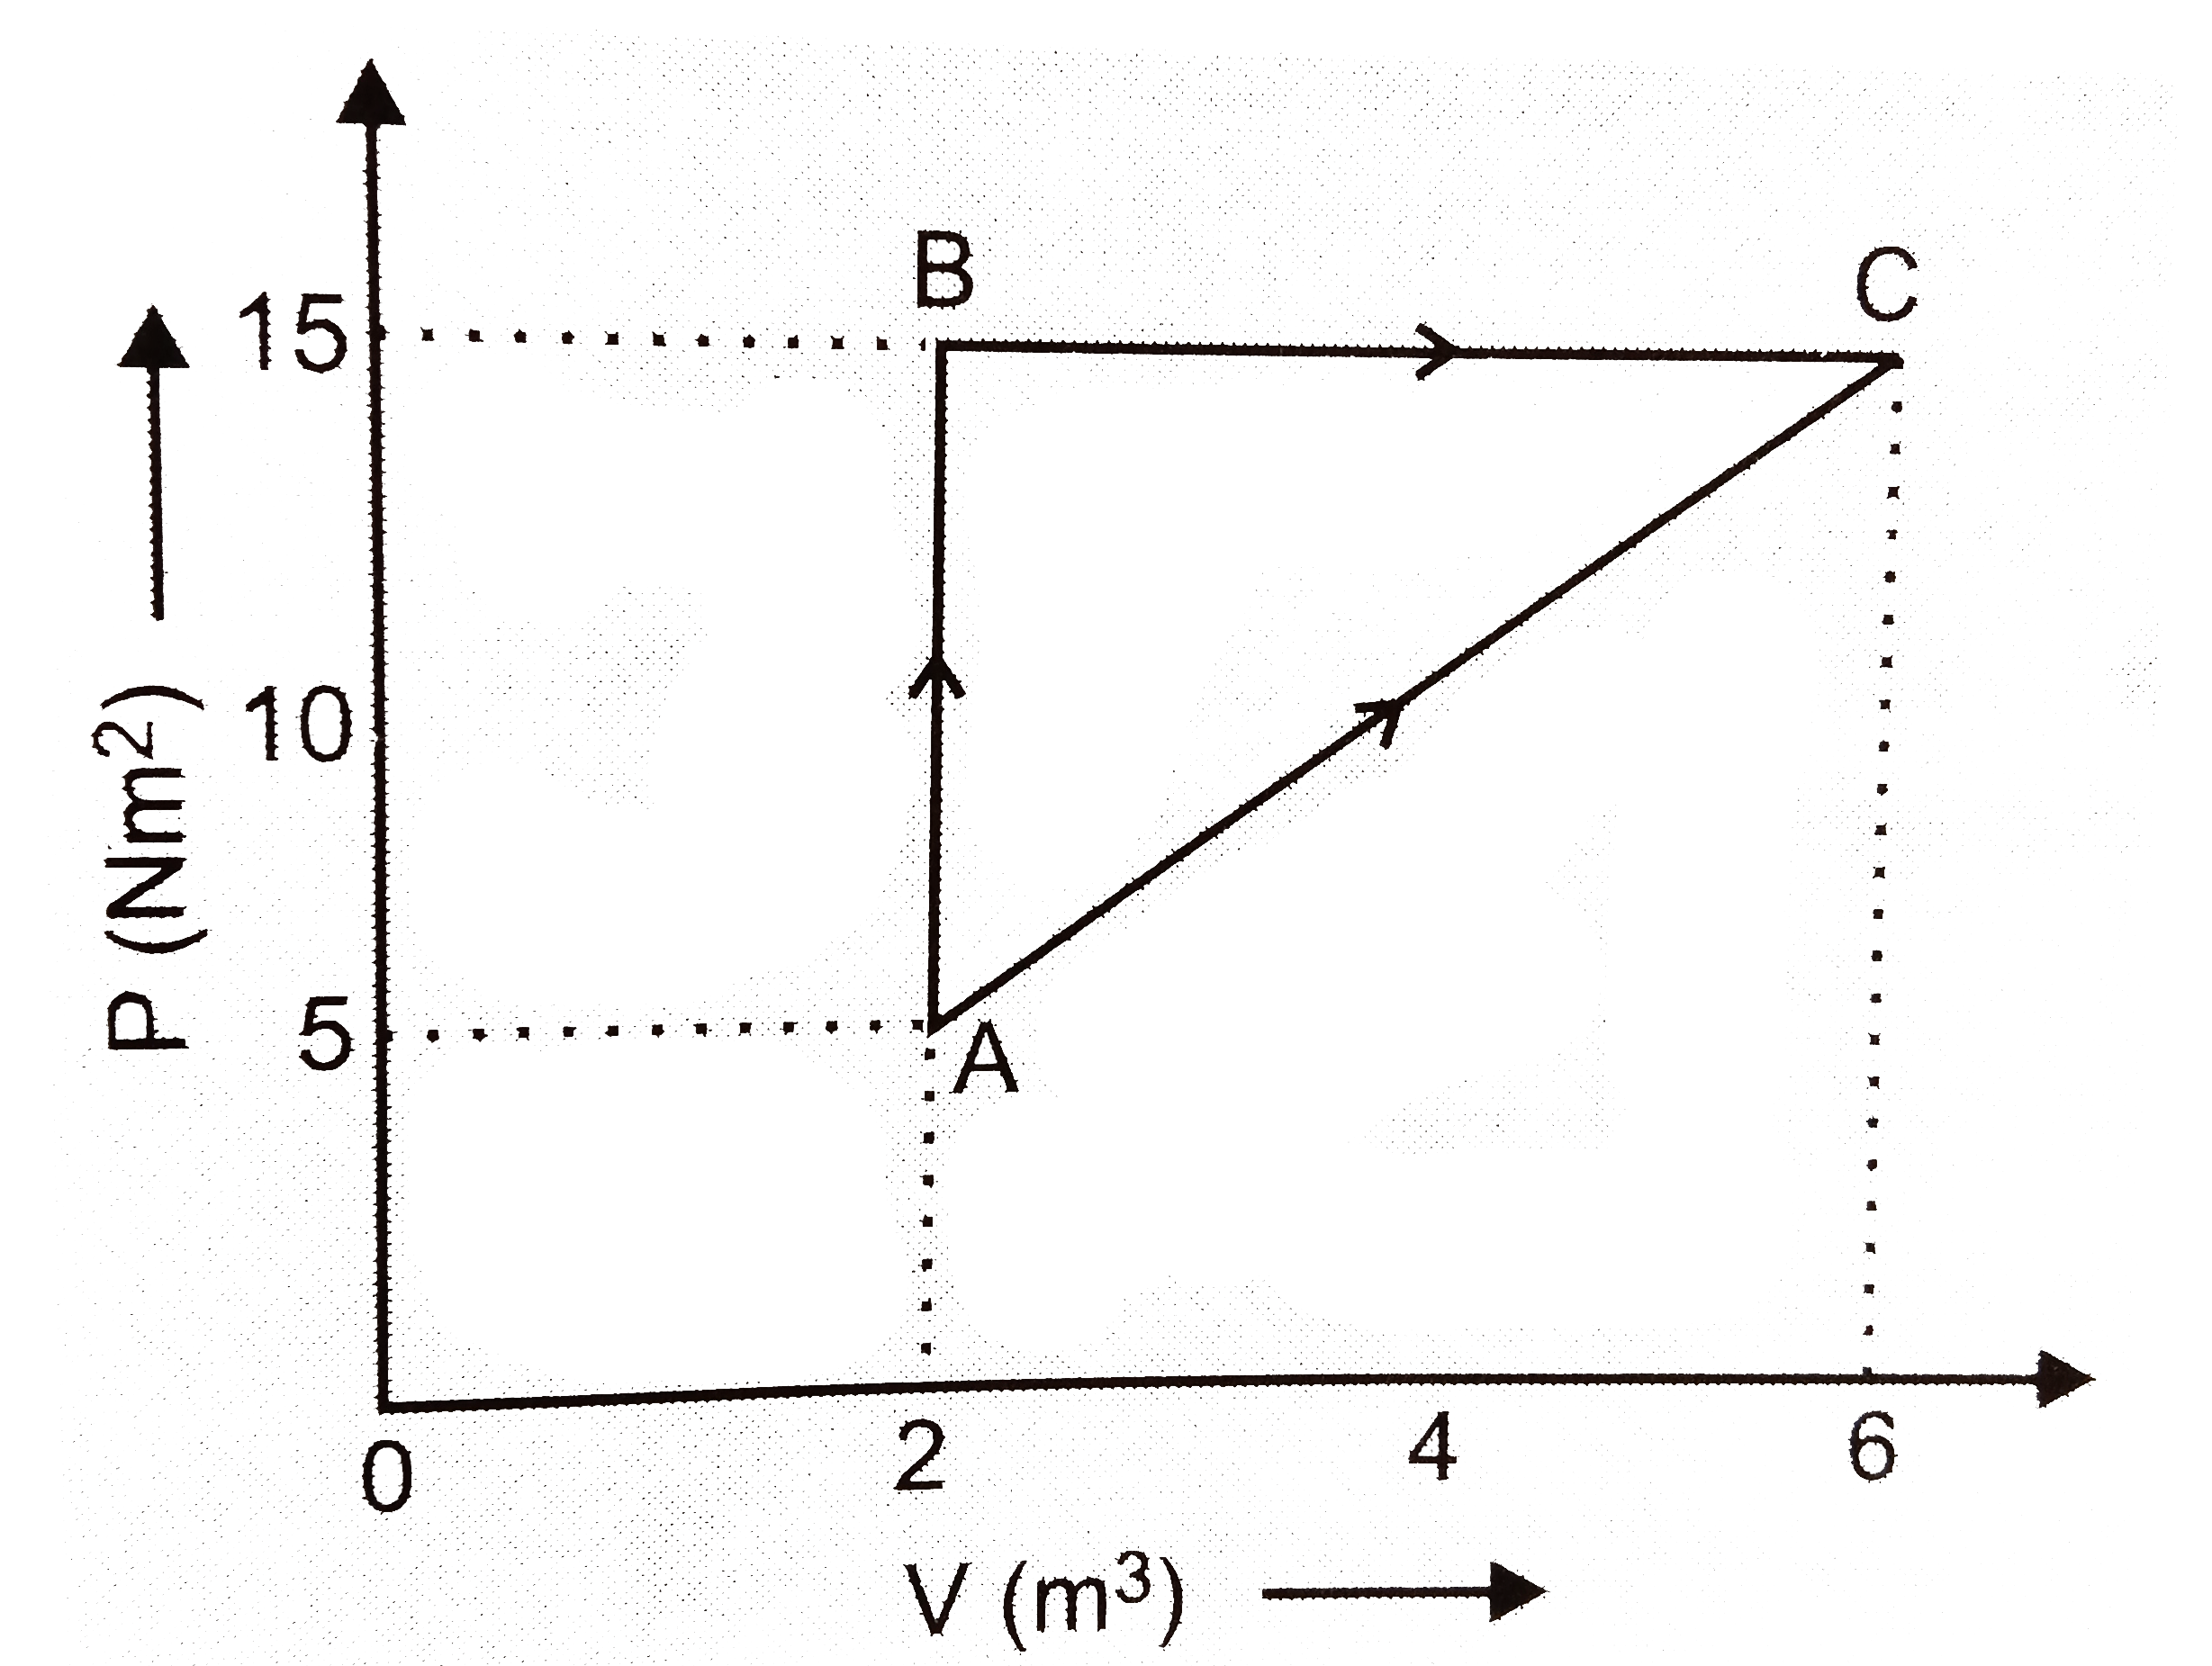
(a) Path along which work done is least.
(b) Internal energy at C if the internal energy of gas at A is 10J and amount of heat supplied to change its state to C through the path AC is 200J.
(c) Amount of heat supplied ot the gas to go from A to B, if internal energy of gas at state B is 10J.
View SolutionState Function || Path function || Heat capacities
View SolutionIn the graph shown below A-B, B-C , C-D are parts of the carnot cycle operating on an ideal gas.Consider only the path from State 1 to State 2 . W denotes the work in the path. Equations and plots in the table have standard notations γ is the ratio of heat capacities at constant pressure and constant volume. The moles of the gas is 'n'.

For which of the following options dQrevsysT=0 and dQrev(sys)T=0 it taken irreversibly
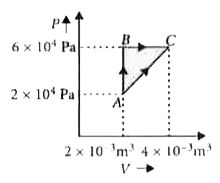
View SolutionFigure below shows two paths that may be taken by a gas to go from a state A to a state C. In process AB, 400 J of heat is added to the system and in process BC, 100 J of heat is added to the system. The heat absorbed by the system in the process AC will be
View SolutionFigure below shows two paths that may be taken by a gas to go from state A to a state C. In process AB, 400 Jof heat is added to the system and in proces BC, 100 J of heat is added to the system. The heat absorbed by the system in the process AC will be
View Solution
