A well insulated substance in solid state is heated at a constant rate until it vaporizes completely. The temperature-time graph of the substance is shown below . Which of the following statements is//are true?
_E01_077_Q01.png)
The specific heat capacity of the substance in solid state is greater than that of the substance in liquid state.
The specific latent heat of fusion of the substance is greater than the specific latent heat of vaporization of the substance.
If the rate of heating increases, the slope of AB will be increased but the length of BC remains unchanged.
If the mass of the substance is doubled, the length of DE is also doubled but the slope of CD is halved.
The correct Answer is:B, D
(B)Lf∝BC & LV∝DE
(D)DE∝m, slope of CD∝1m
Topper's Solved these Questions
- GEOMETRICAL OPTICSBOOK - ALLENCHAPTER - GEOMETRICAL OPTICSEXERCISE - EXERCISE -03
11 Videos
- GEOMETRICAL OPTICSBOOK - ALLENCHAPTER - GEOMETRICAL OPTICSEXERCISE - ASSERTION-REASON
40 Videos
- GEOMETRICAL OPTICSBOOK - ALLENCHAPTER - GEOMETRICAL OPTICSEXERCISE - EXERCISE -01
65 Videos
- CURRENT ELECTRICITYBOOK - ALLENCHAPTER - CURRENT ELECTRICITYEXERCISE - All Questions
427 Videos
- GRAVITATIONBOOK - ALLENCHAPTER - GRAVITATIONEXERCISE - EXERCISE 4
9 Videos
Similar Questions
In the above problem if heat is supplied at a constant rate of q=10cal/min, then plot temperature versus time graph.
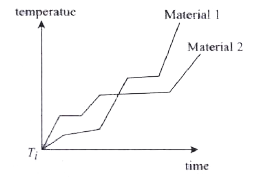
View SolutionTwo solid blocks having same mass but different material are supplied heat at a constant rate. They have same initial temperature. The graph between temperature and time is shown.
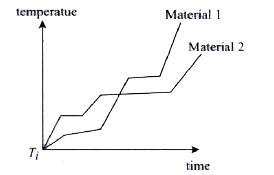
Answer the following questions on the basis of information given in the above statement.
Which material has higher specific heat capacity in solid state?
View Solution
Knowledge Check
Which of the following substances will conduct current in the solid state?
ADiamondBGraphiteCIodineDSodium chlorideLiquid oxygen at 50K is heated to 300K at constant pressure of 1atm. The rate of heating is constant. Which of the following graphs represents the variation of temperature with time?
A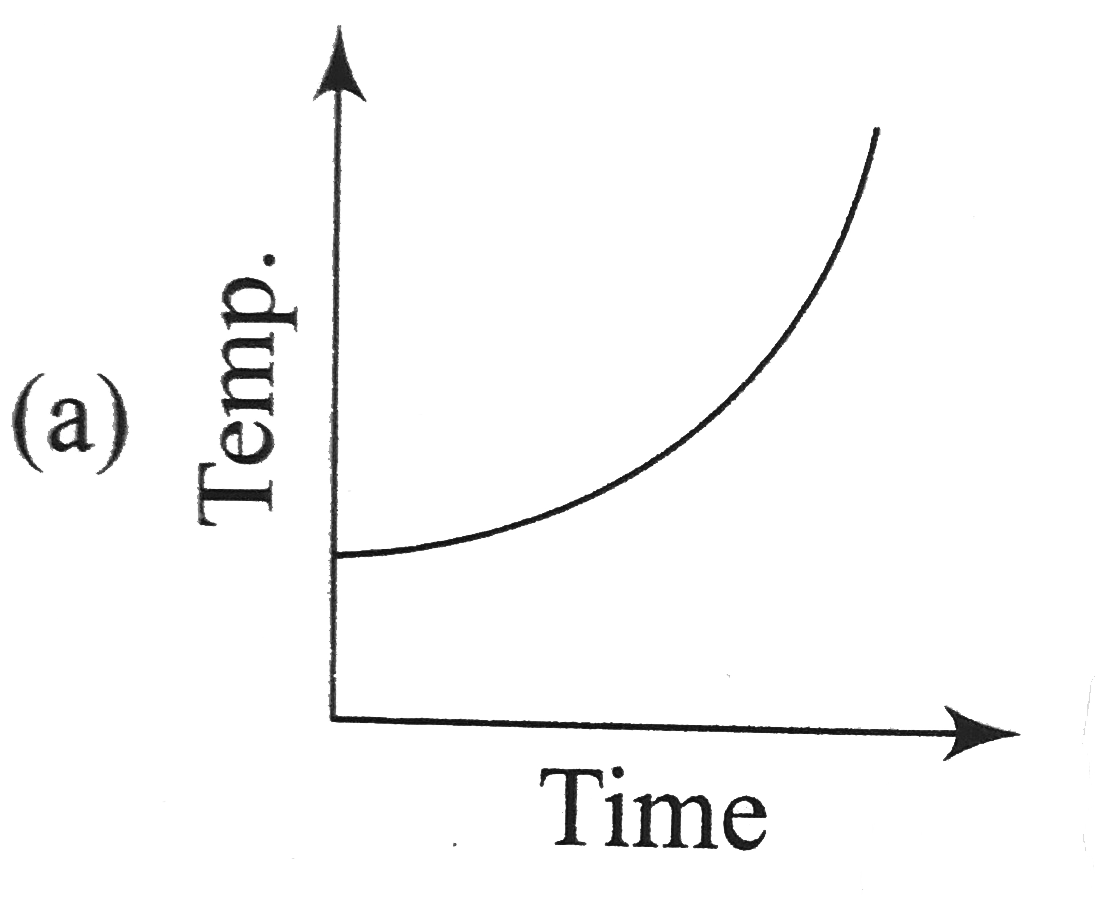 B
B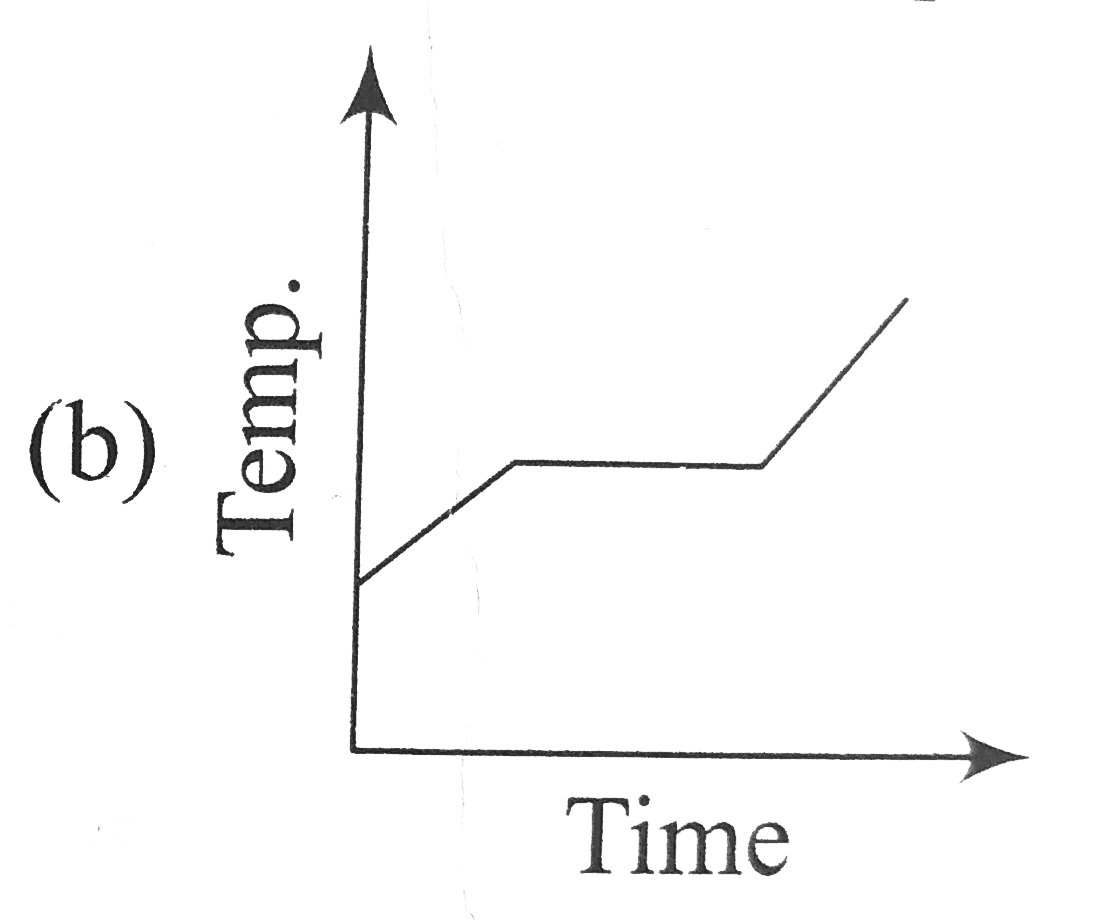 C
C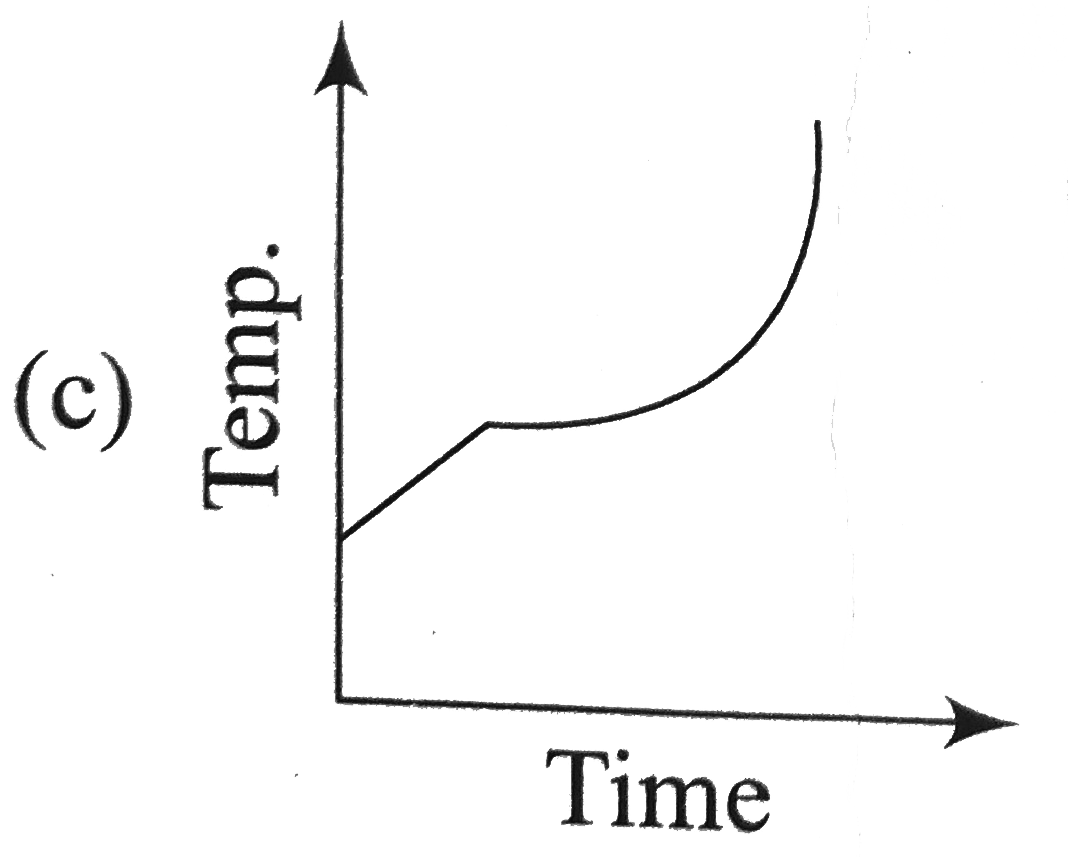 D
D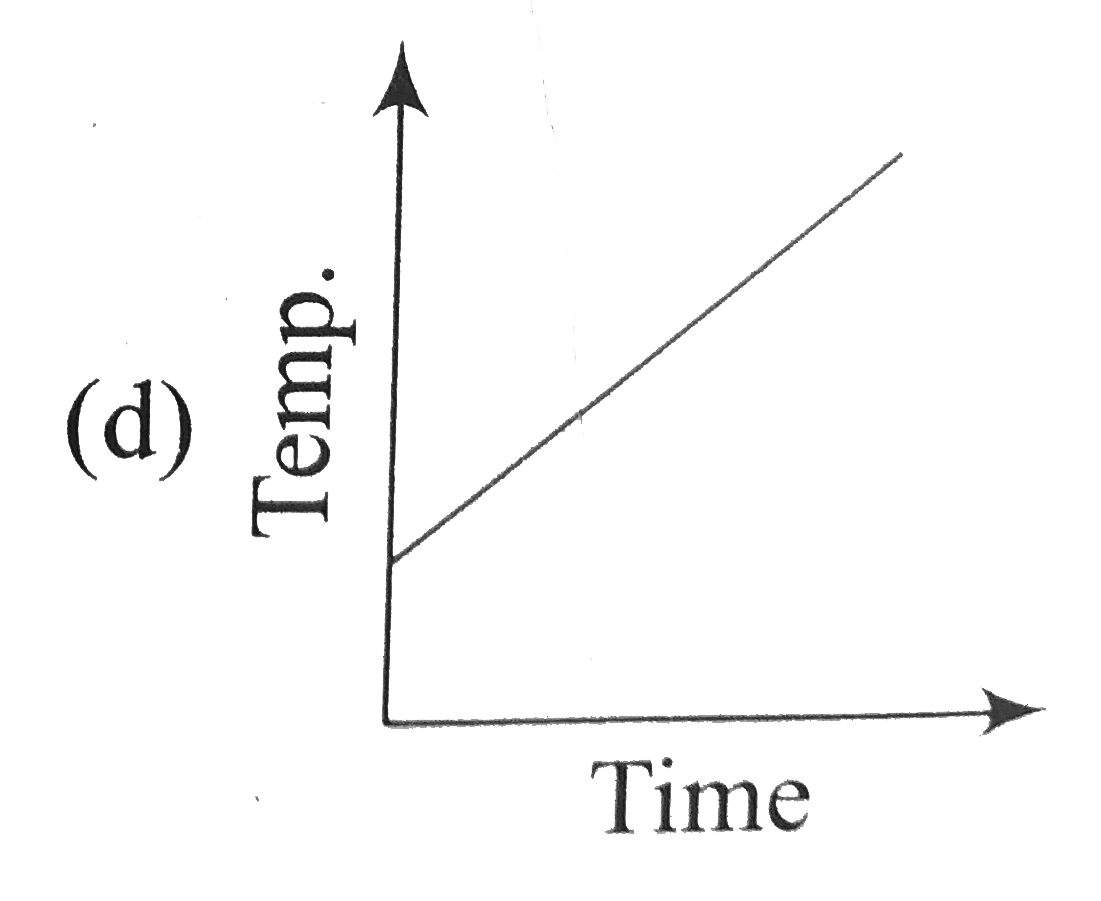
A solid material is supplied heat at a constant rate. The temperature of material is changing with heat input as shown in the figure. What does the slope of DE represent ?
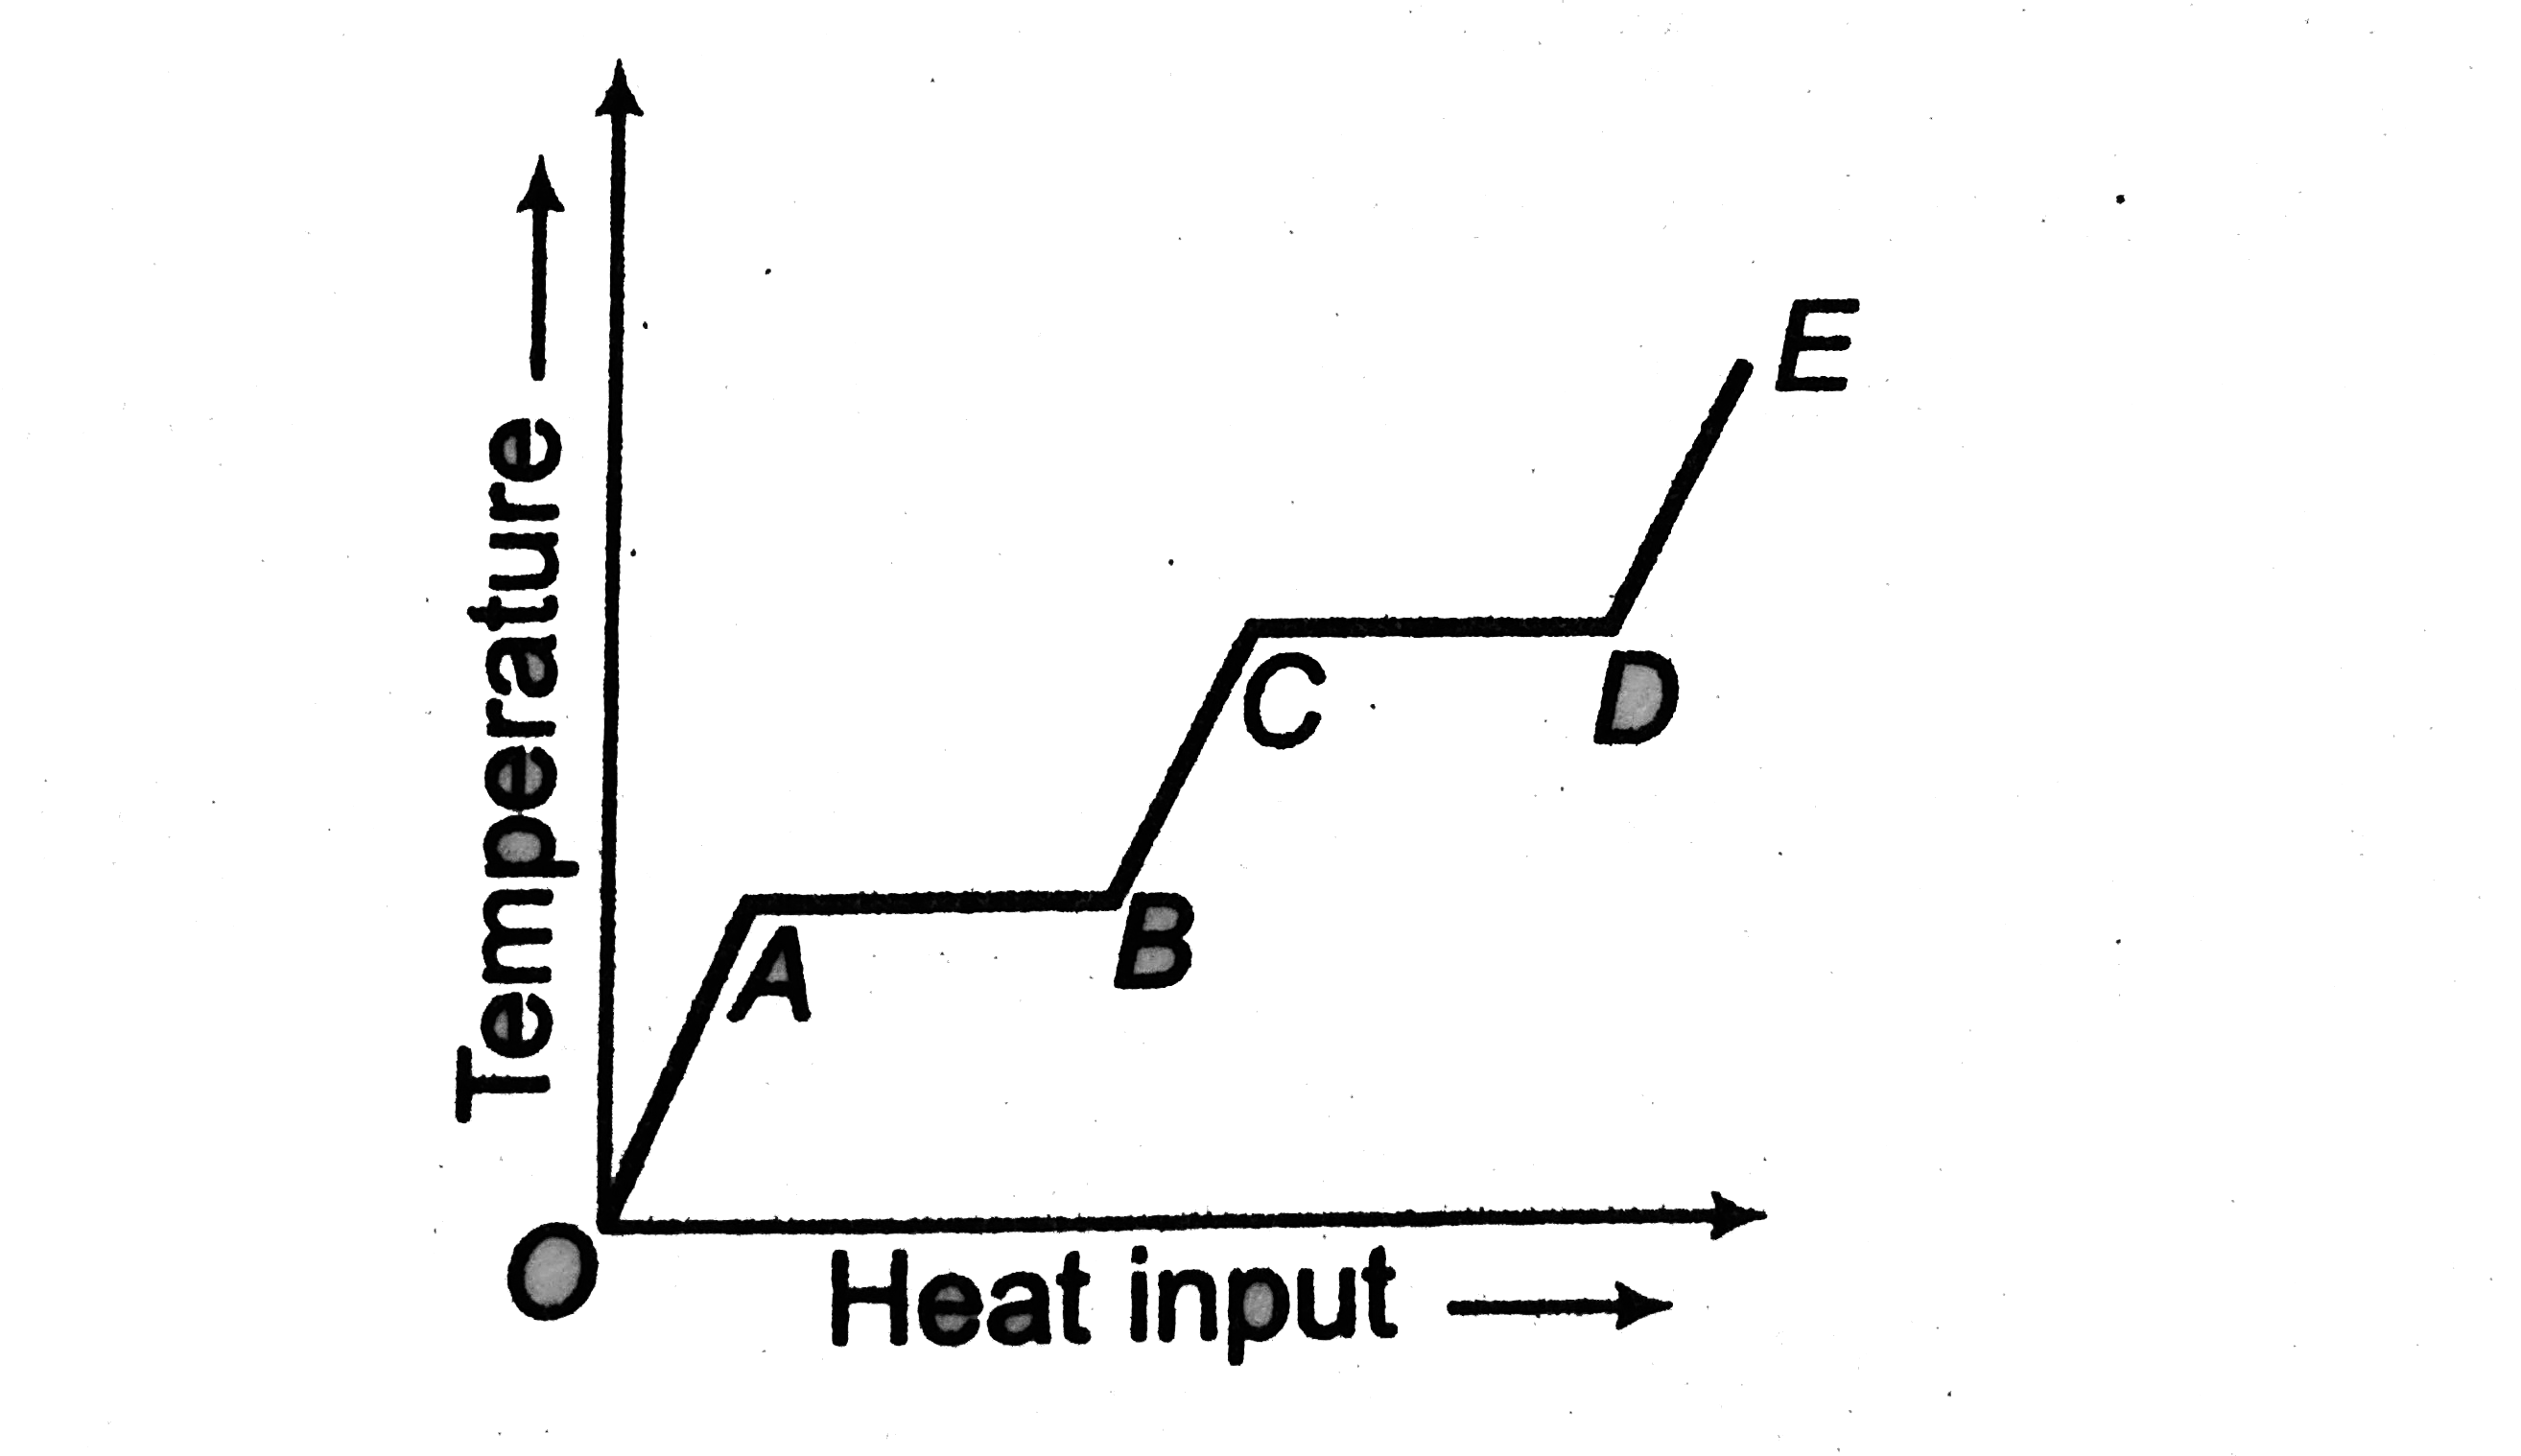 ALatent heat of liquidBLatent heat of vaporizationCHeat capacity of vapourDInverse of heat capacity of vapour
Two solid blocks having same mass but different material are supplied heat at a constant rate. They have same initial temperature. The graph between temperature and time is shown.
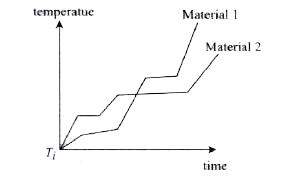
Answer the following questions on the basis of information given in the above statement.
Which material has higher specific heat capacity in gaseous state?
View SolutionTwo solid blocks having same mass but different material are supplied heat at a constant rate. They have same initial temperature. The graph between temperature and time is shown.
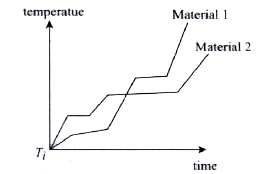
Answer the following questions on the basis of information given in the above statement.
Which material has higher specific heat capacity in liquid state?
View SolutionState true or false.
When heat is supplied to a substance, it always raises the temperature of substance.
View SolutionTwo solid blocks having same mass but different material are supplied heat at a constant rate. They have same initial temperature. The graph between temperature and time is shown.
Answer the following questions on the basis of information given in the above statement.
Which material has higher latent heat of vaporisation?
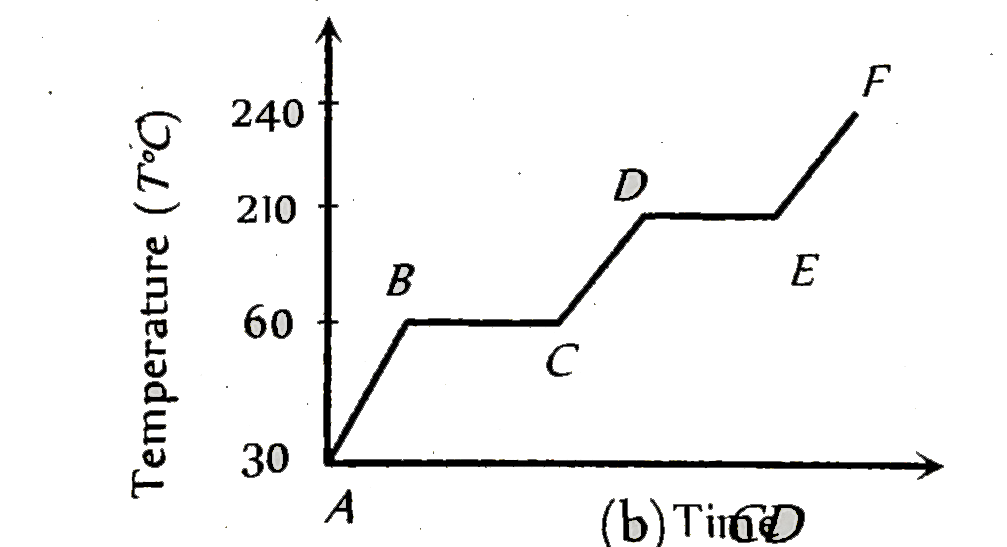
View SolutionA solid substance is at 30∘C . To this substance heat energy is supplied at a constant rate. Then temperature versus time graph is as shown in the figure. The substance is in liquid state for the portion (of the graph)
View Solution
