In the above problem if heat is supplied at a constant rate of , then plot temperature versus time graph.
The correct Answer is:A
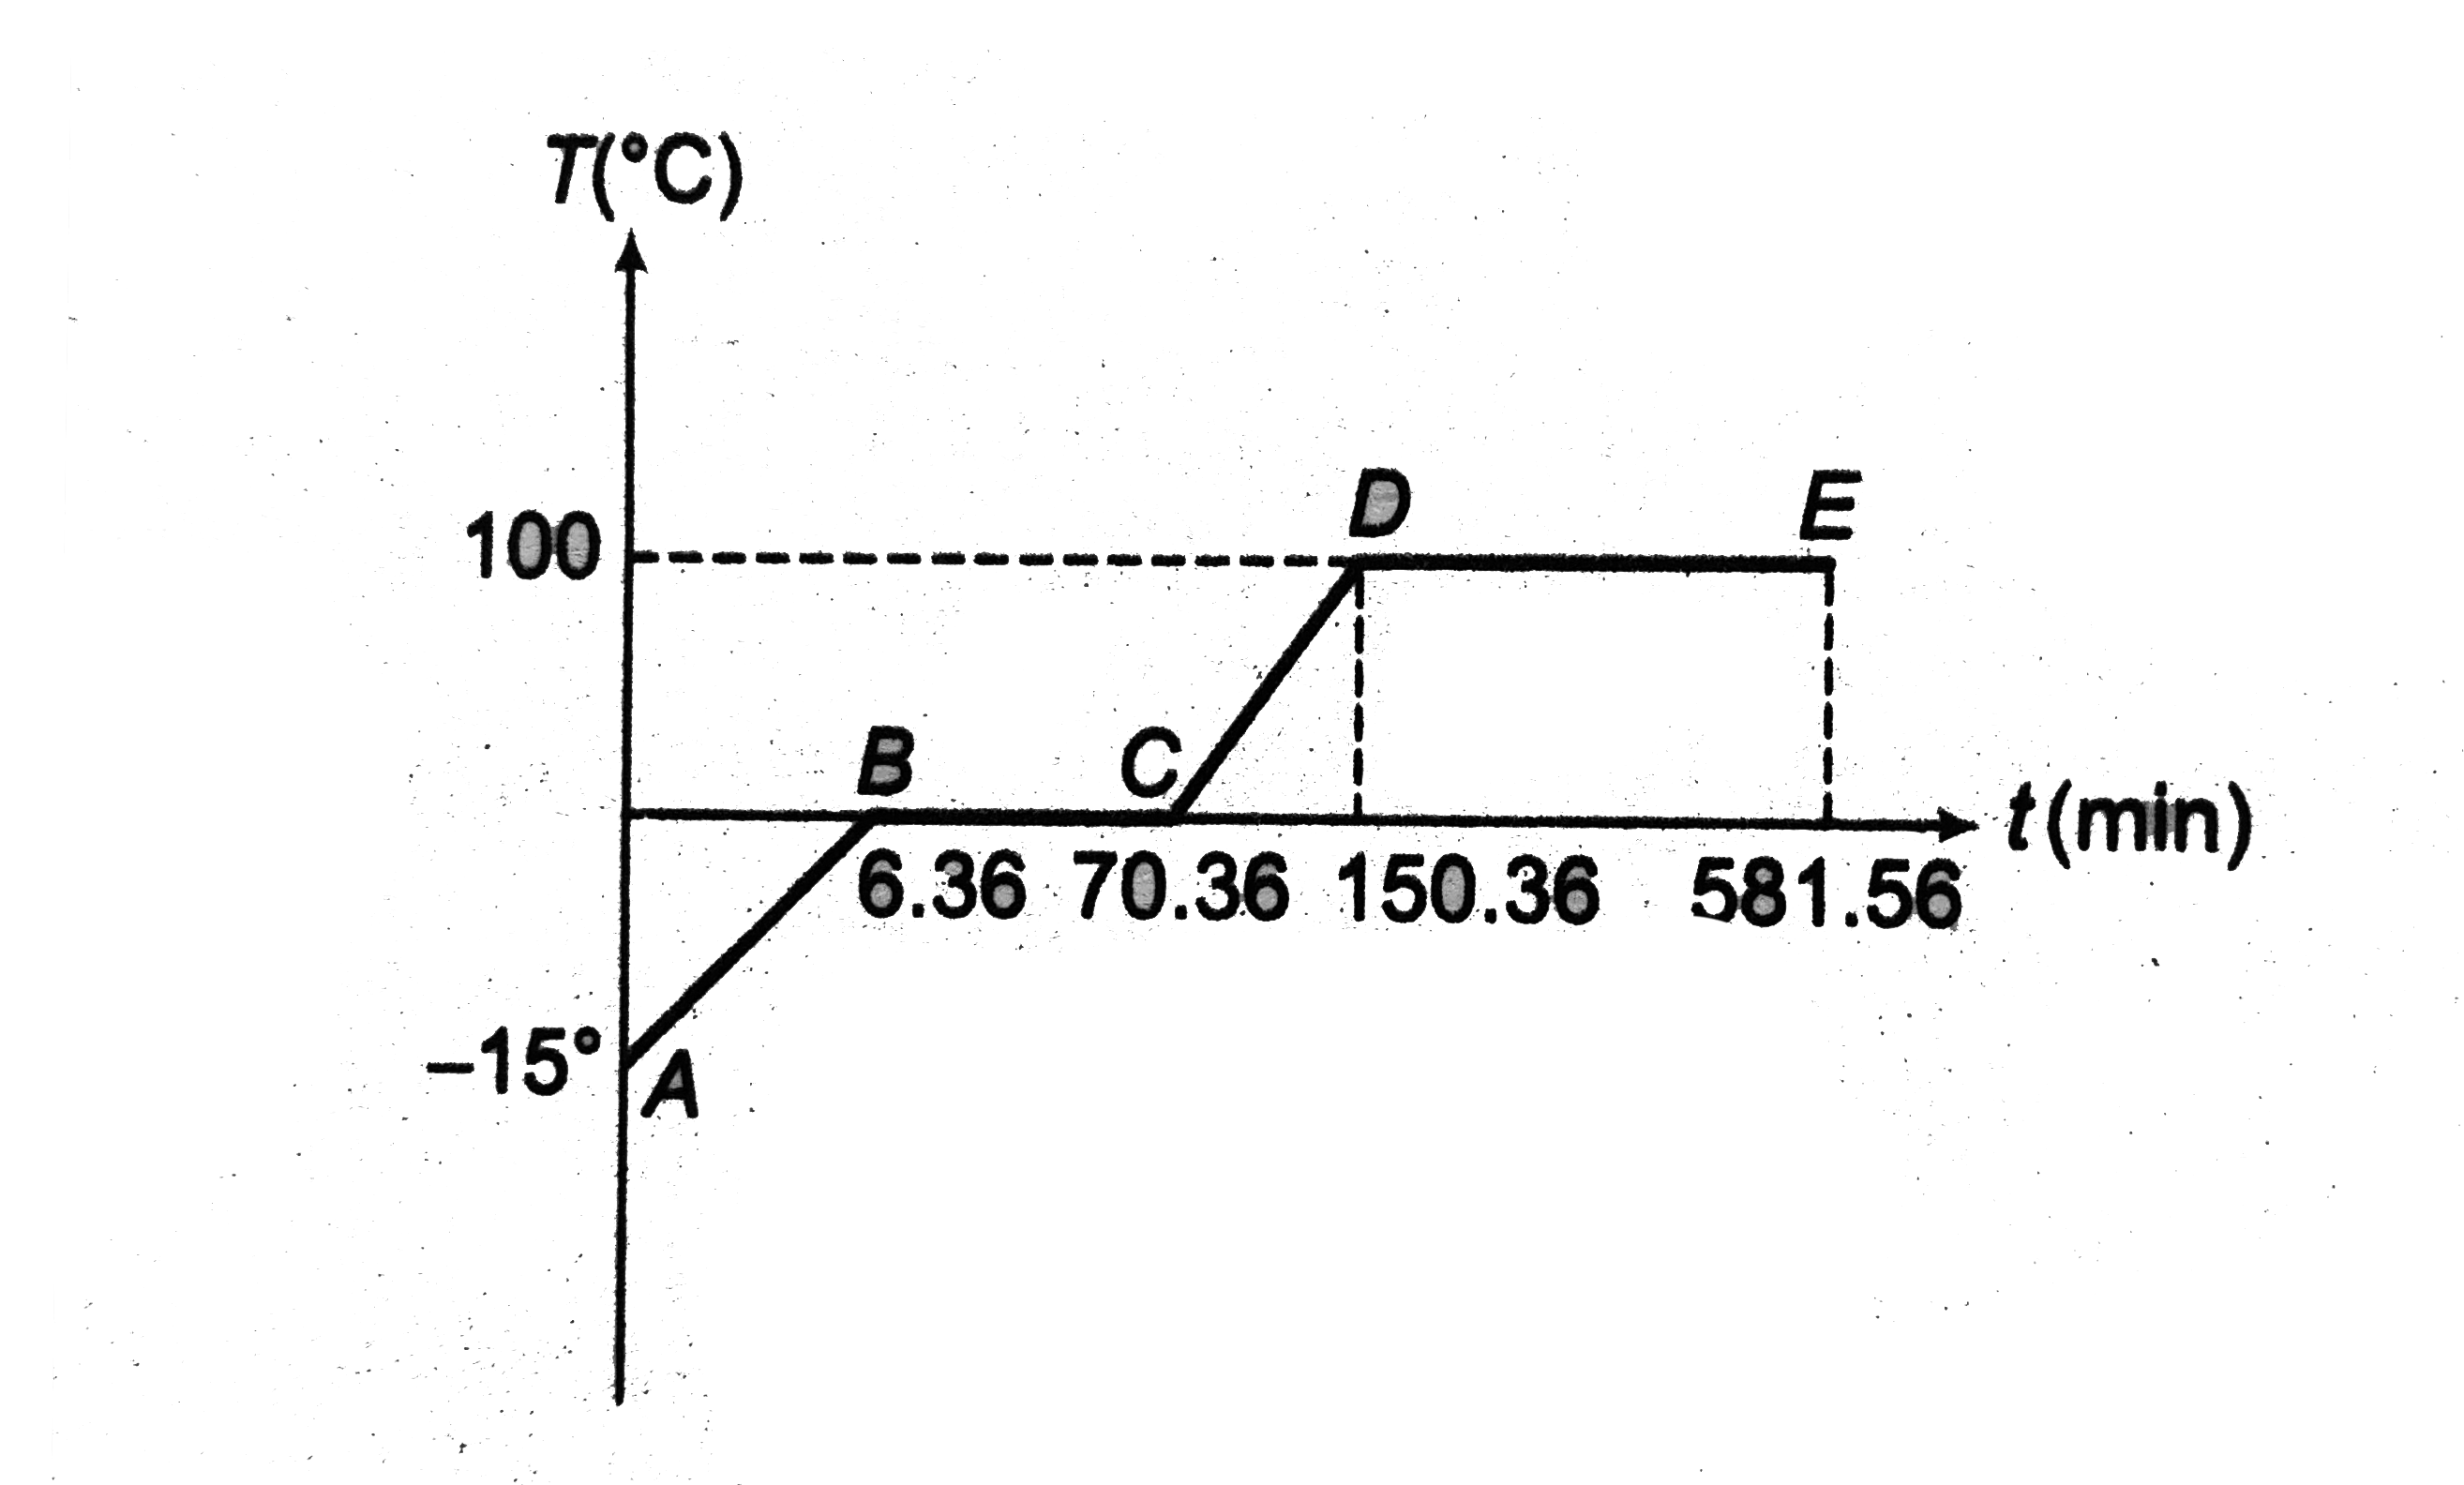
From A to B
(i) Temperature of ice will increase from .
(ii)
(iii) Between A and B we will get only ice.
From B to C
(i) Temperature of (ice + water) mixture will remain constant at .
(ii)
(iii) Between B and C we will get both ice and water.
From C to D
(i) Temperature of water increases from .
(ii)
(iii) Between C and D we will get only water.
From D to E
(i) Temperature of (water+steam) mixture will remain constant at C.
(ii)
(iii) Between D and A we will get both water and steam.
The corresponding graph is as shown in fig.
Topper's Solved these Questions
- BOOK - DC PANDEYCHAPTER - CALORIMETRY & HEAT TRANSFEREXERCISE - Example Type 14videos
CALORIMETRY & HEAT TRANSFER
- BOOK - DC PANDEYCHAPTER - CALORIMETRY & HEAT TRANSFEREXERCISE - Example Type 22videos
CALORIMETRY & HEAT TRANSFER
- BOOK - DC PANDEYCHAPTER - BASIC MATHEMATICSEXERCISE - Exercise13videos
BASIC MATHEMATICS
- BOOK - DC PANDEYCHAPTER - CALORIMETRY AND HEAT TRANSFEREXERCISE - Medical entrance s gallery38videos
CALORIMETRY AND HEAT TRANSFER
Similar Questions
Knowledge Check
- Question 1 - Select One
A solid substance is at 30∘C . To this substance heat energy is supplied at a constant rate. Then temperature versus time graph is as shown in the figure. The substance is in liquid state for the portion (of the graph)
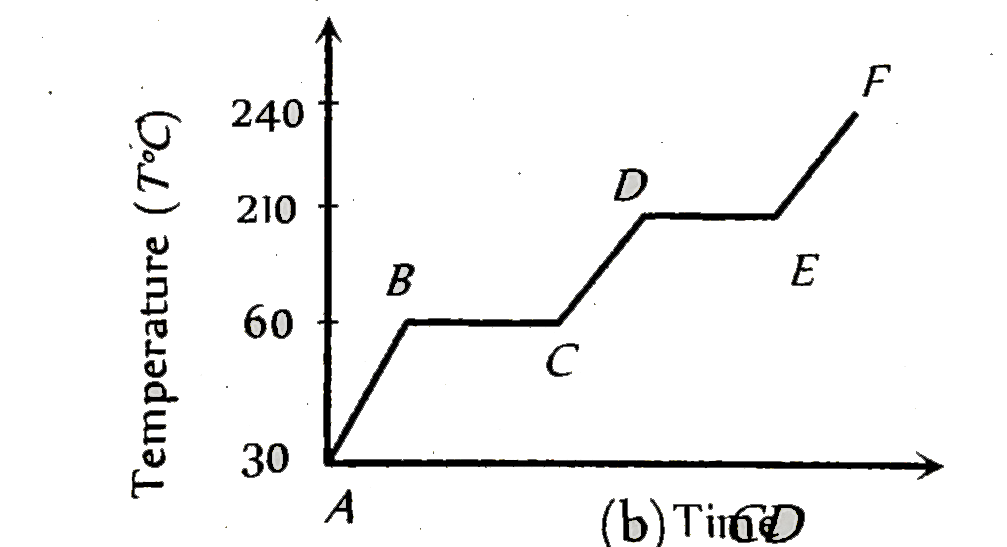 ABCBCDCEDDEF
 - Question 2 - Select One
A certain amount of ice is supplied heat at a constant rate for 7 min. For the first one minute the temperature rises uniformly with time. Then it remains constant for the next 4 min and again the temperature rises at uniform rate for the last 2 min. Given Sice=0.5cal/g∘C,Lf=80cal/g.
Final temperature at the end of 7 min isA10∘CB20∘CC30∘CD40∘C - Question 3 - Select One
If liquefied oxygen at 1 atmospheric pressure is heated from 50K to 300k by supplying heat at constant rate. The graph of temperature vs time will be
A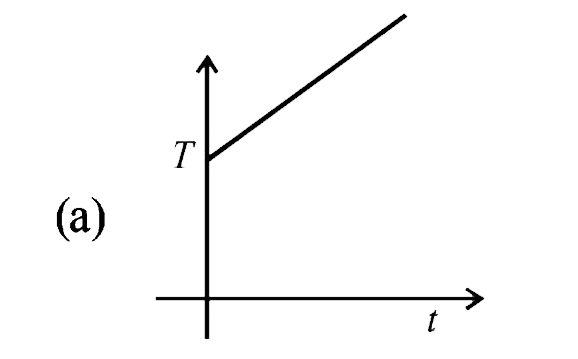 B
B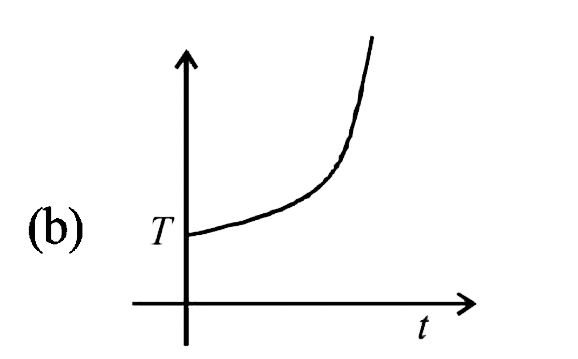 C
C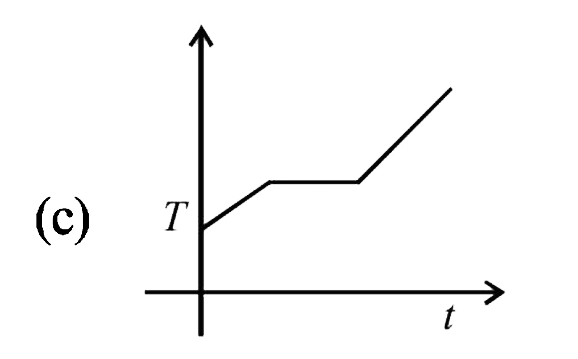 D
D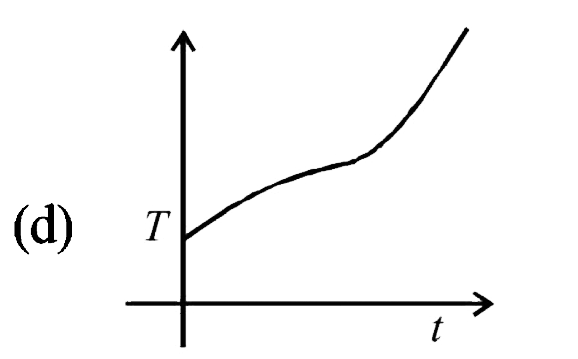
A source of heat supplies heat at constant rate to a solid cube. The variatiion of the temperature of the cube with heat supplied is shown in figure. The portion DE of the graph represents conversion of
 View Solution
Calculate the amount of heat required to convert 10 g ice at −10∘C into steam at 120∘C at normal pressure. If heat is supplied uniformly at the rate 50cal/s, sketch variation temperature with time
View SolutionTwo solid blocks having same mass but different material are supplied heat at a constant rate. They have same initial temperature. The graph between temperature and time is shown.
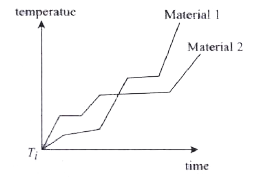
Answer the following questions on the basis of information given in the above statement.
Which material has higher latent heat of vaporisation?View SolutionA certain amount of ice is supplied heat at a constant rate for 7 min. For the first one minute the temperature rises uniformly with time. Then it remains constant for the next 4 min and again the temperature rises at uniform rate for the last 2 min. Given Sice=0.5cal/g∘C,Lf=80cal/g.
The initial temperature of ice isView SolutionIf specific heat capacity of a substance in solid and liquid is proportional to the temperature of substance, then temperature Vs time plot for the substance is best present by [Assume heat is supplied to substance at constant rate and initial temperature is less than melthing pint of substance.
View Solution

