Figure shows the graph of stopping potential verus that frequency of a photosensitive metal. The plank's constant and work funcation of the metal are
_S01_035_Q01.png)
(V2+V1v2+v2)e,(V2v1+V1v2v2+v1)e
(V2+V1v2−v1)e,(V2v1+V1v2v2−v1)e
(V2−V1v2+v1)e,(V2v1−V1v2v2+v1)e
(V2−V1v2−v1)e,(V2v1−V1v2v2−v1)e
The correct Answer is:D
Equation of straight line V−V1v−v1=V2−V1v2−v1⇒V=(V2−V1v2−v1)v−(V2v1−V1v2v2−v1)
But V=(he)v−ϕe⇒h=(V2−V1v2−v1)e and ϕ0=(V2v1−V1v2v2−v1)e
Topper's Solved these Questions
- BOOK - ALLENCHAPTER - SIMPLE HARMONIC MOTIONEXERCISE - Exercise - 021videos
SIMPLE HARMONIC MOTION
- BOOK - ALLENCHAPTER - SIMPLE HARMONIC MOTIONEXERCISE - Exercise - 032videos
SIMPLE HARMONIC MOTION
- BOOK - ALLENCHAPTER - SIMPLE HARMONIC MOTIONEXERCISE - Radioactivity : Solved Example6videos
SIMPLE HARMONIC MOTION
- BOOK - ALLENCHAPTER - RACEEXERCISE - Basic Maths (Wave Motion & Dopplers Effect) (Stationary waves & doppler effect, beats)25videos
RACE
- BOOK - ALLENCHAPTER - TEST PAPEREXERCISE - PHYSICS4videos
TEST PAPER
Similar Questions
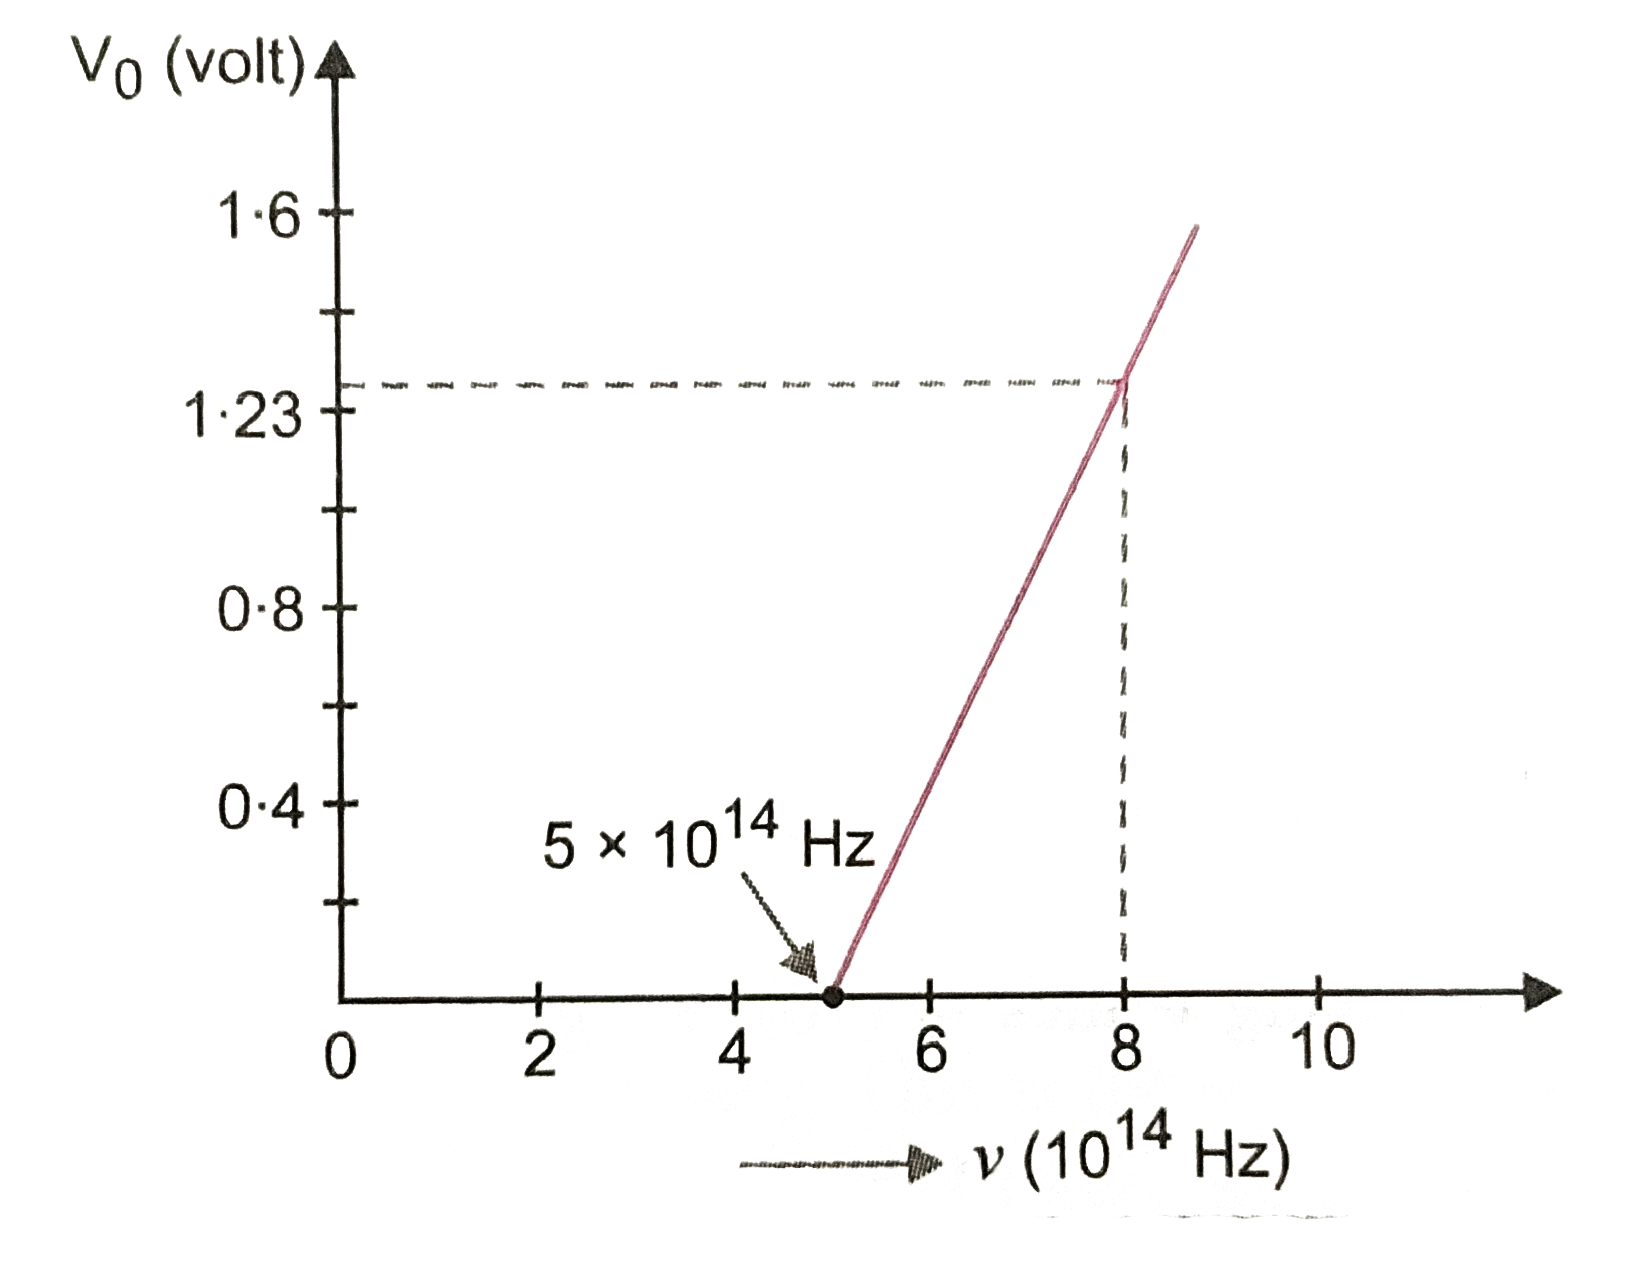
Using the graph shown in fig for stopping potential vs the incident frequency of photons, calculate Planck's constant.
 View Solution
The figure shows the variation of stopping potential VQ with the frequency v of the incident radiations for two photosensitive metals P and
Which metal has smaller threshold wavelength ? Justify your answer.View Solution
Knowledge Check
- Question 1 - Select One
In a photocell circuit the stopping potential, V0, is a measure of the maximum kinetic energy of the photoelectrons. The following graph shows experimentally measured values of stopping potential versus frequency v of incident light.
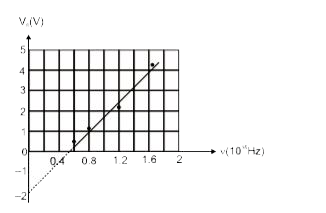
The values of Planks constant and the work function as determined from the graph are (taking the magnitude of electronic charge to be e=1.6×10⁻¹⁹C)A6.4×10−34Js,2.0eVB6.0×10−34Js,2.0eVC6.4×10−34Js,3.2eVD6.0×10−34Js,3.2eV - Question 2 - Select One
Graph between stopping potential and frequency of photon is given in figure
_2019_CBT7_E01_021_Q01.png)
Find out work function of metal:A0.82B0.92C0.72D0.62 - Question 3 - Select One
The stopping potential vs frequency plot for a substance is shown in the figure. The work function of the substance is
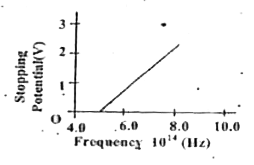 A3.331 eVB4.02 eVC2.07 eVD3.02e V
The slope of the stopping potential versus frequency graph for photoelectric effect is equal to:
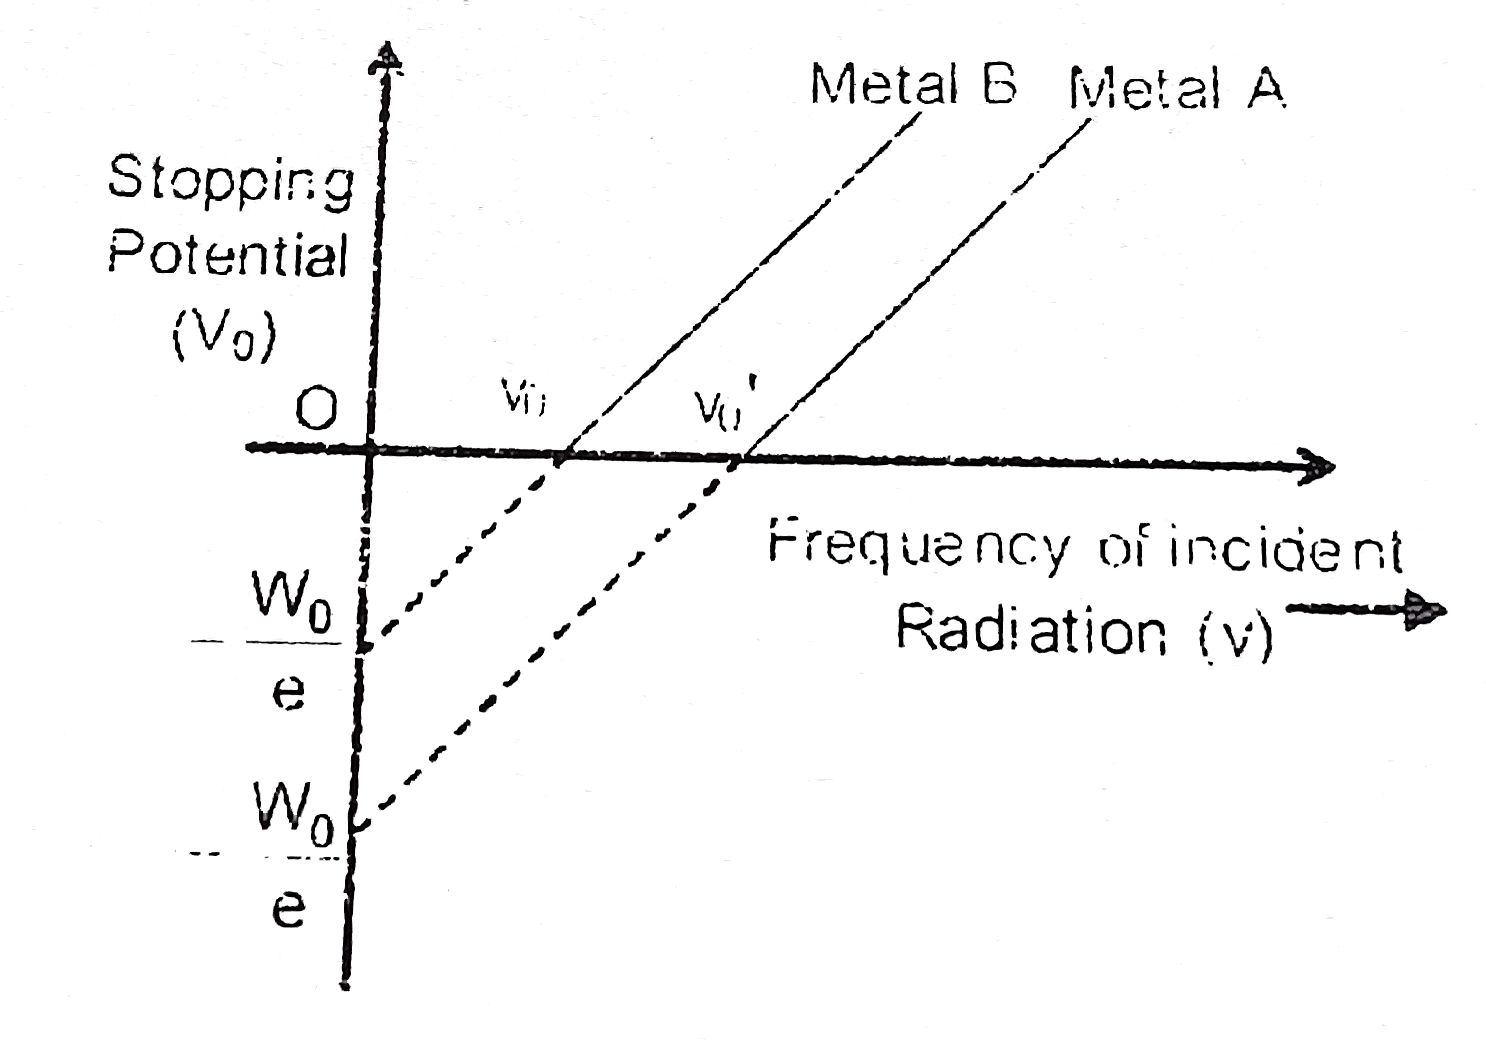
View SolutionThe graph shows variation of stopping potential V0 versus frequency of incident radiation v for two photosensitive metals A and B. Which of two metals has higher threshold frequency and why?
 View Solution
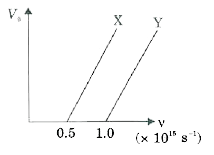
The following graph shows the variation of stopping potential V0 with the frequency v of the incident radiation for two photosensitive metals X and Y.
(i) Which metal has larger threshold wavelength ? Give reason.
(ii) Explain giving reason , which metal gives out electrons , having larger kinetic energy , for same wavelength of the incident radiation.
(iii) If the distance between the light source and metal X is halved , how will the kinetic energy of electrons emitted from it change ? Given reason.
 View Solution
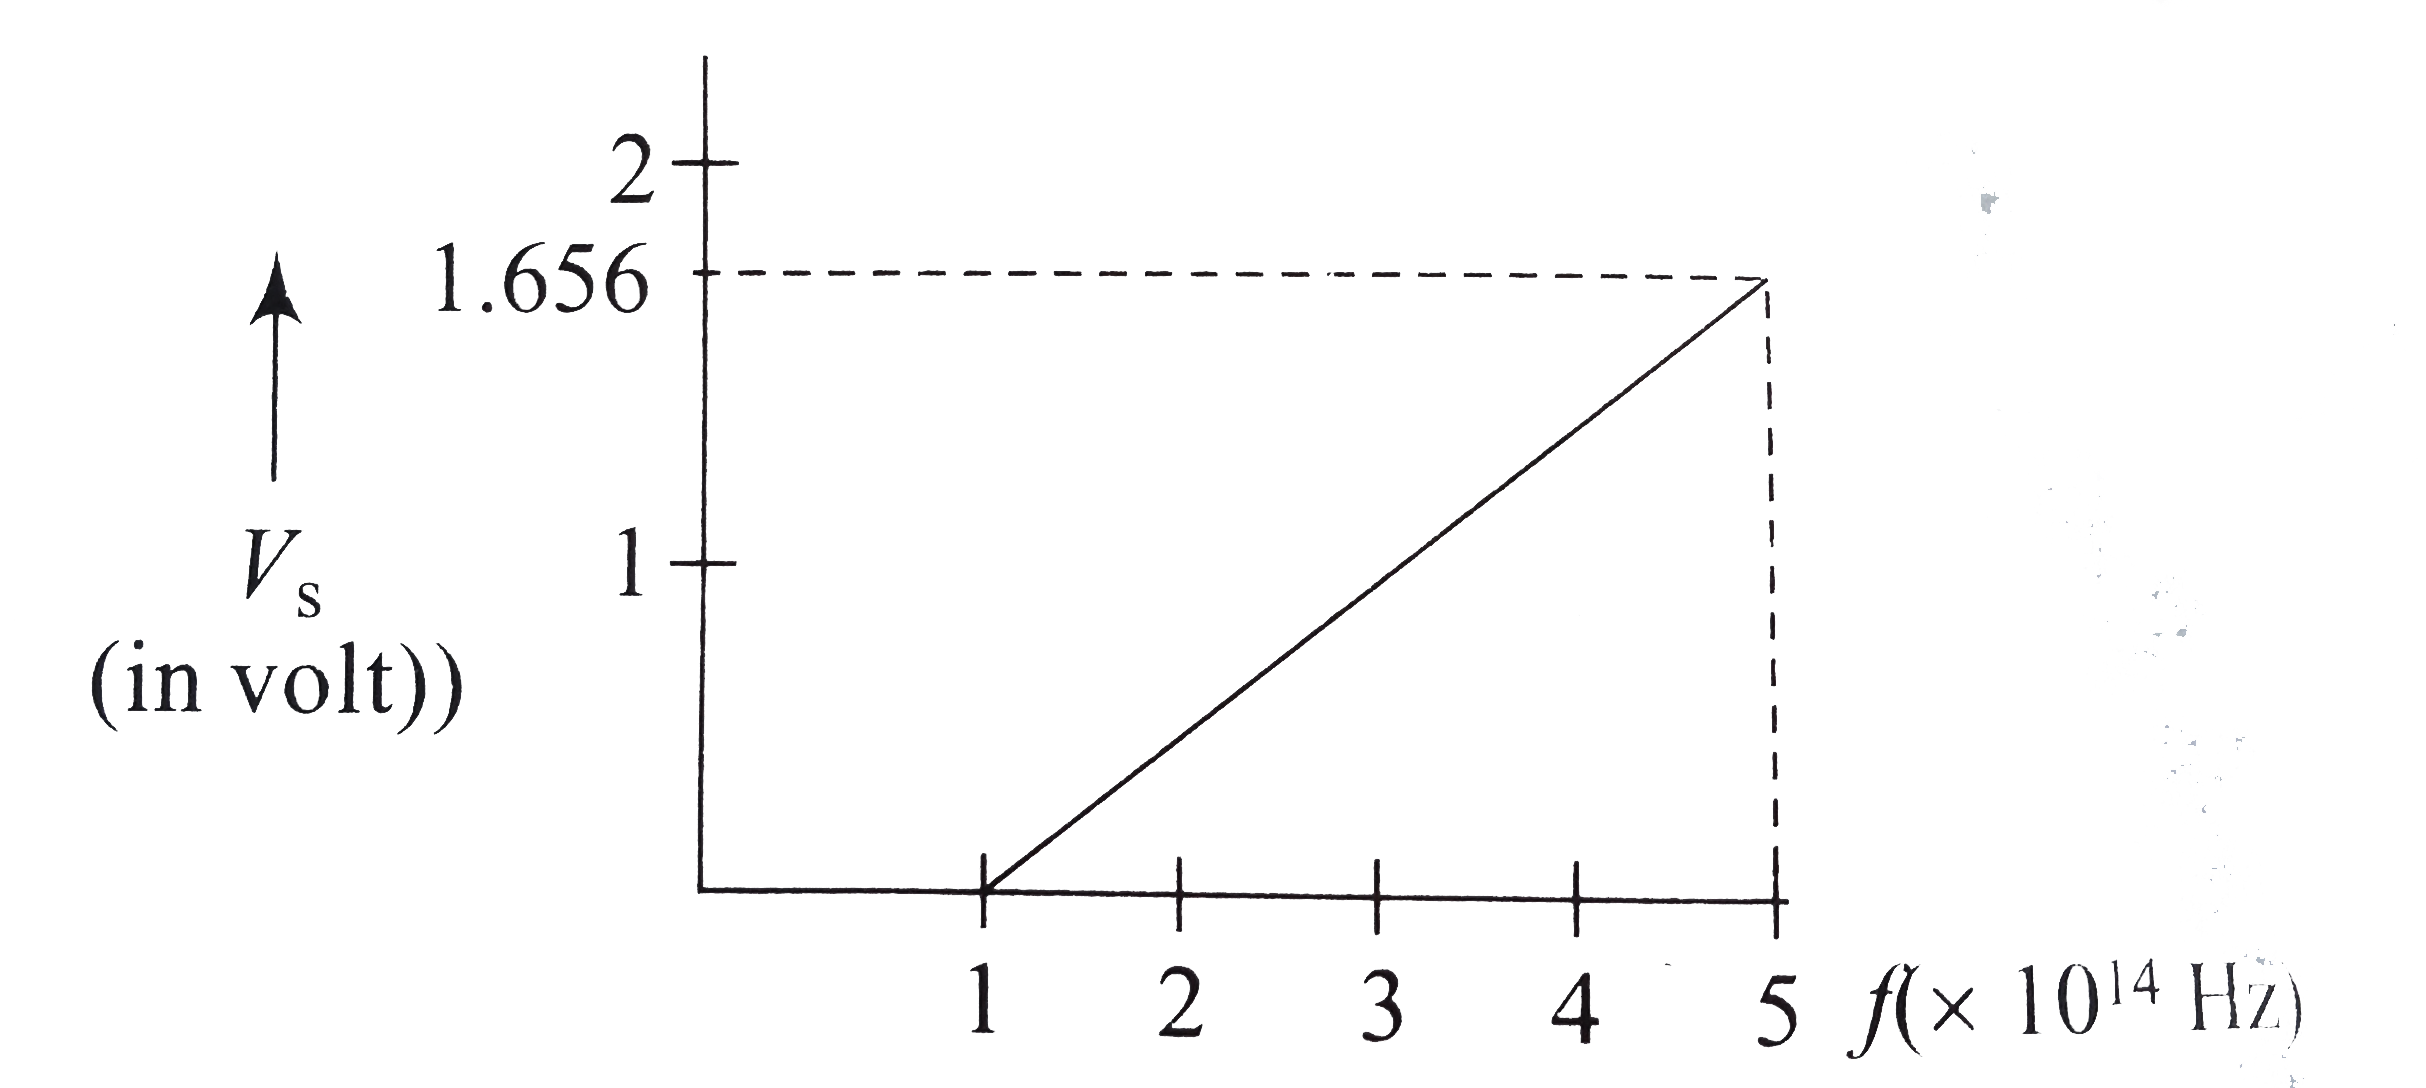
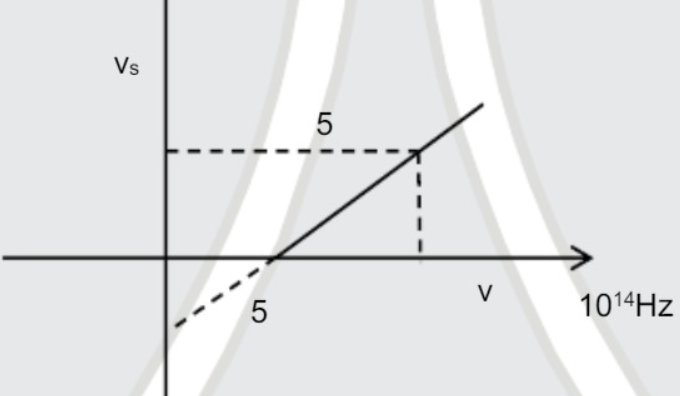
Figure shows the plot of the stopping potential versus the frequency of the light used in an experiment on photoelectric effect. The ratio he isView SolutionGraph between stopping potential and frequency of light as shown find the work function
 View Solution

