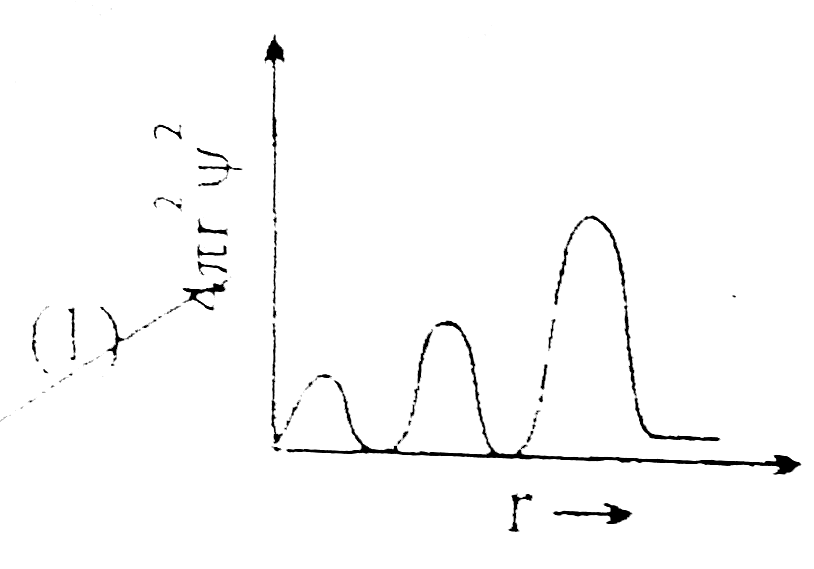
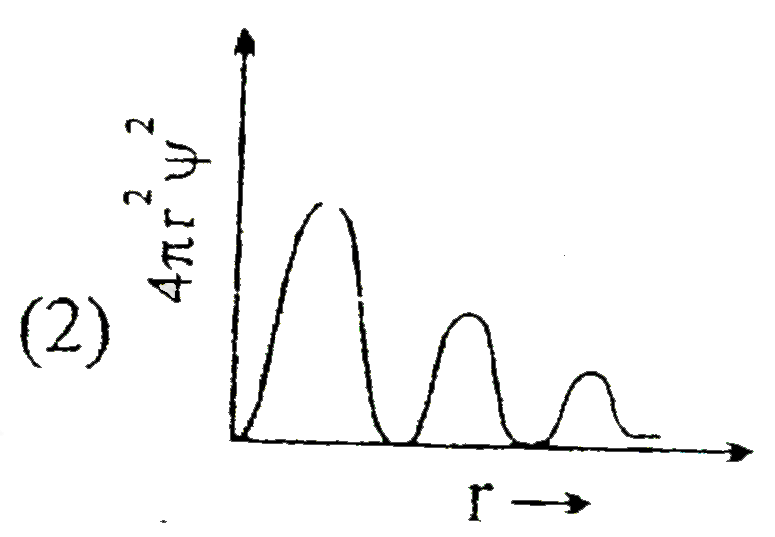
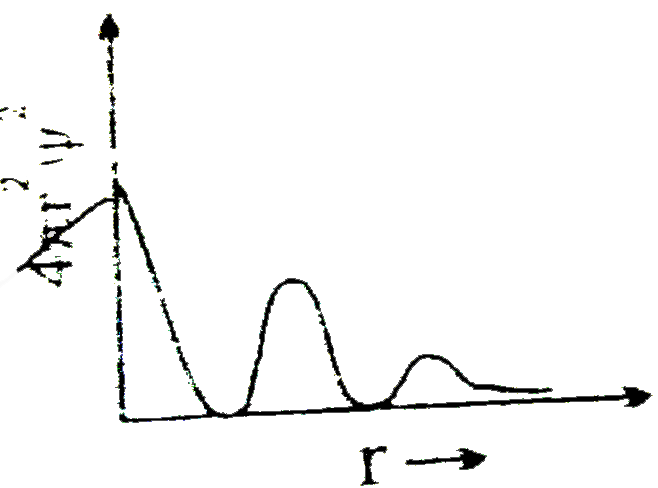
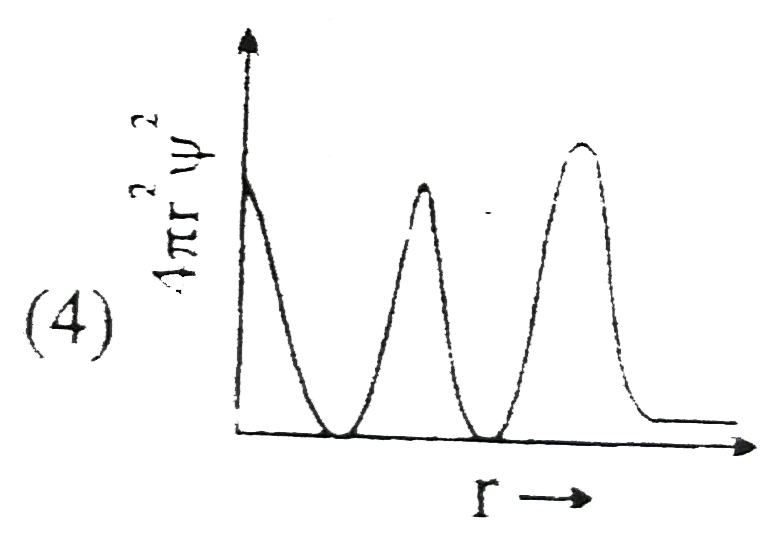
Which of the following graph represents 3s orbital
A
B
C
D
Text Solution
The correct Answer is:A
For 3s orbital
No. of Radial nodes = 2 and height of maxima increases
|
Topper's Solved these Questions
- TEST PAPERSBOOK - BANSALCHAPTER - TEST PAPERSEXERCISE - CHEMISTRY PART (A)
14 Videos
- TEST PAPERSBOOK - BANSALCHAPTER - TEST PAPERSEXERCISE - CHEMISTRY PART (B)
1 Videos
- TEST PAPERSBOOK - BANSALCHAPTER - TEST PAPERSEXERCISE - Chemistry PART D
4 Videos
- SOLUTIONSBOOK - BANSALCHAPTER - SOLUTIONSEXERCISE - Exercise4
32 Videos
- THERMOCHEMISTRYBOOK - BANSALCHAPTER - THERMOCHEMISTRYEXERCISE - Exercise 4
15 Videos
Similar Questions
Knowledge Check
Which of the following graph represents e−x?
A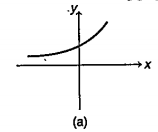 B
B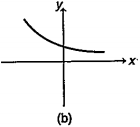 C
C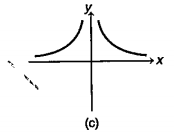 D
D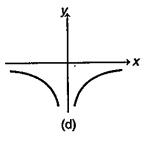
Which of the following graph represents correct graph for SN1 reaction :
A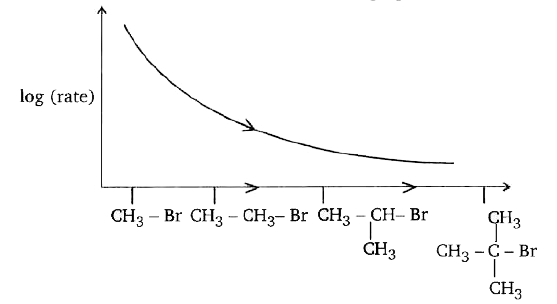 B
B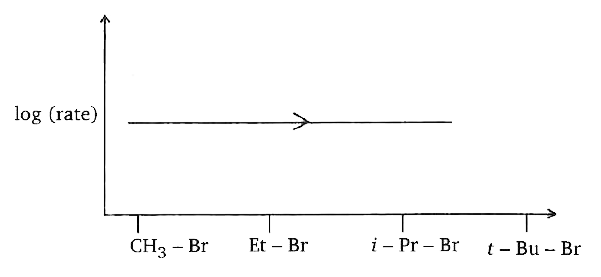 C
C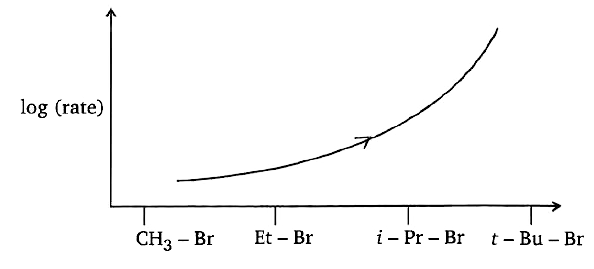 D
D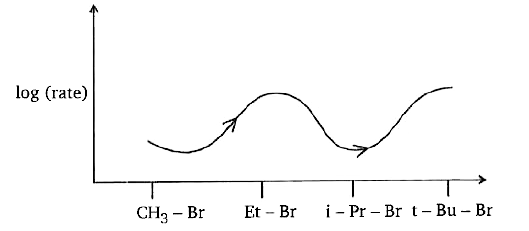
Which of the following graphs represents the displacement (s) -time (t) graph for uniform motion ?
A B
B C
C D
D
Which of the following graph represents correct graph fopr SN1 reaction:
View SolutionThe graph below shws the velocity versus time graph for a body
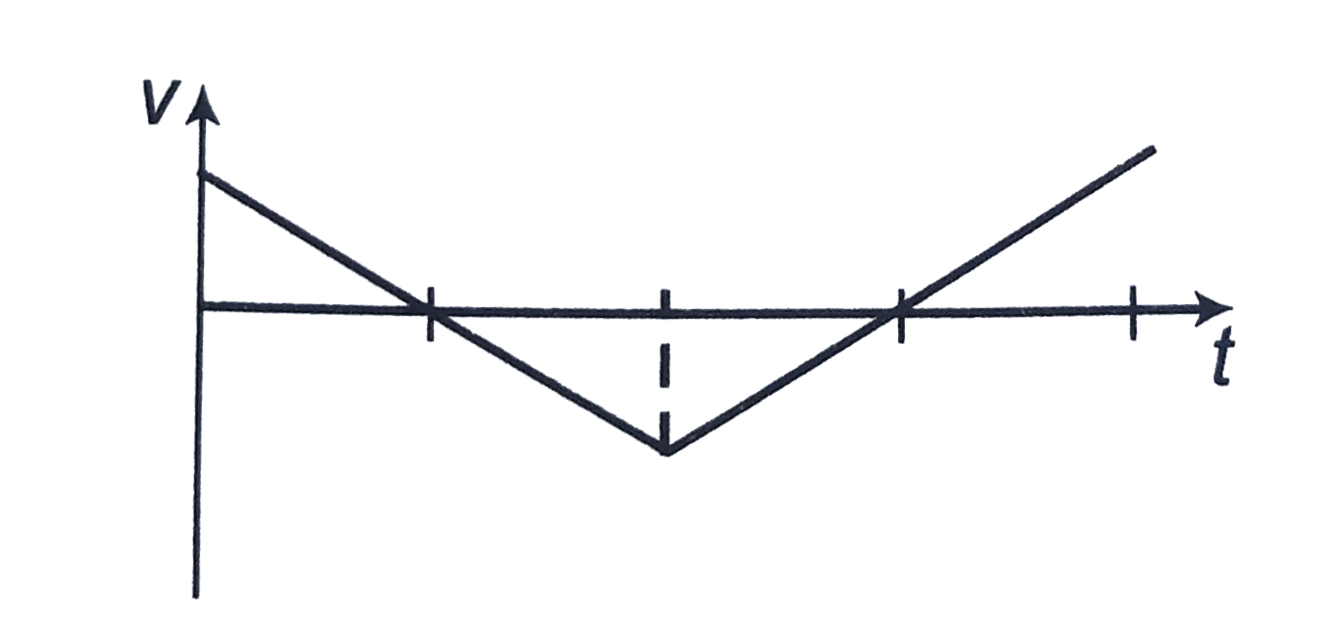
Which of the following graph represents the corresponding acceleration v//s time graph?
View SolutionWhich of the following graph represents exothermic reaction ?
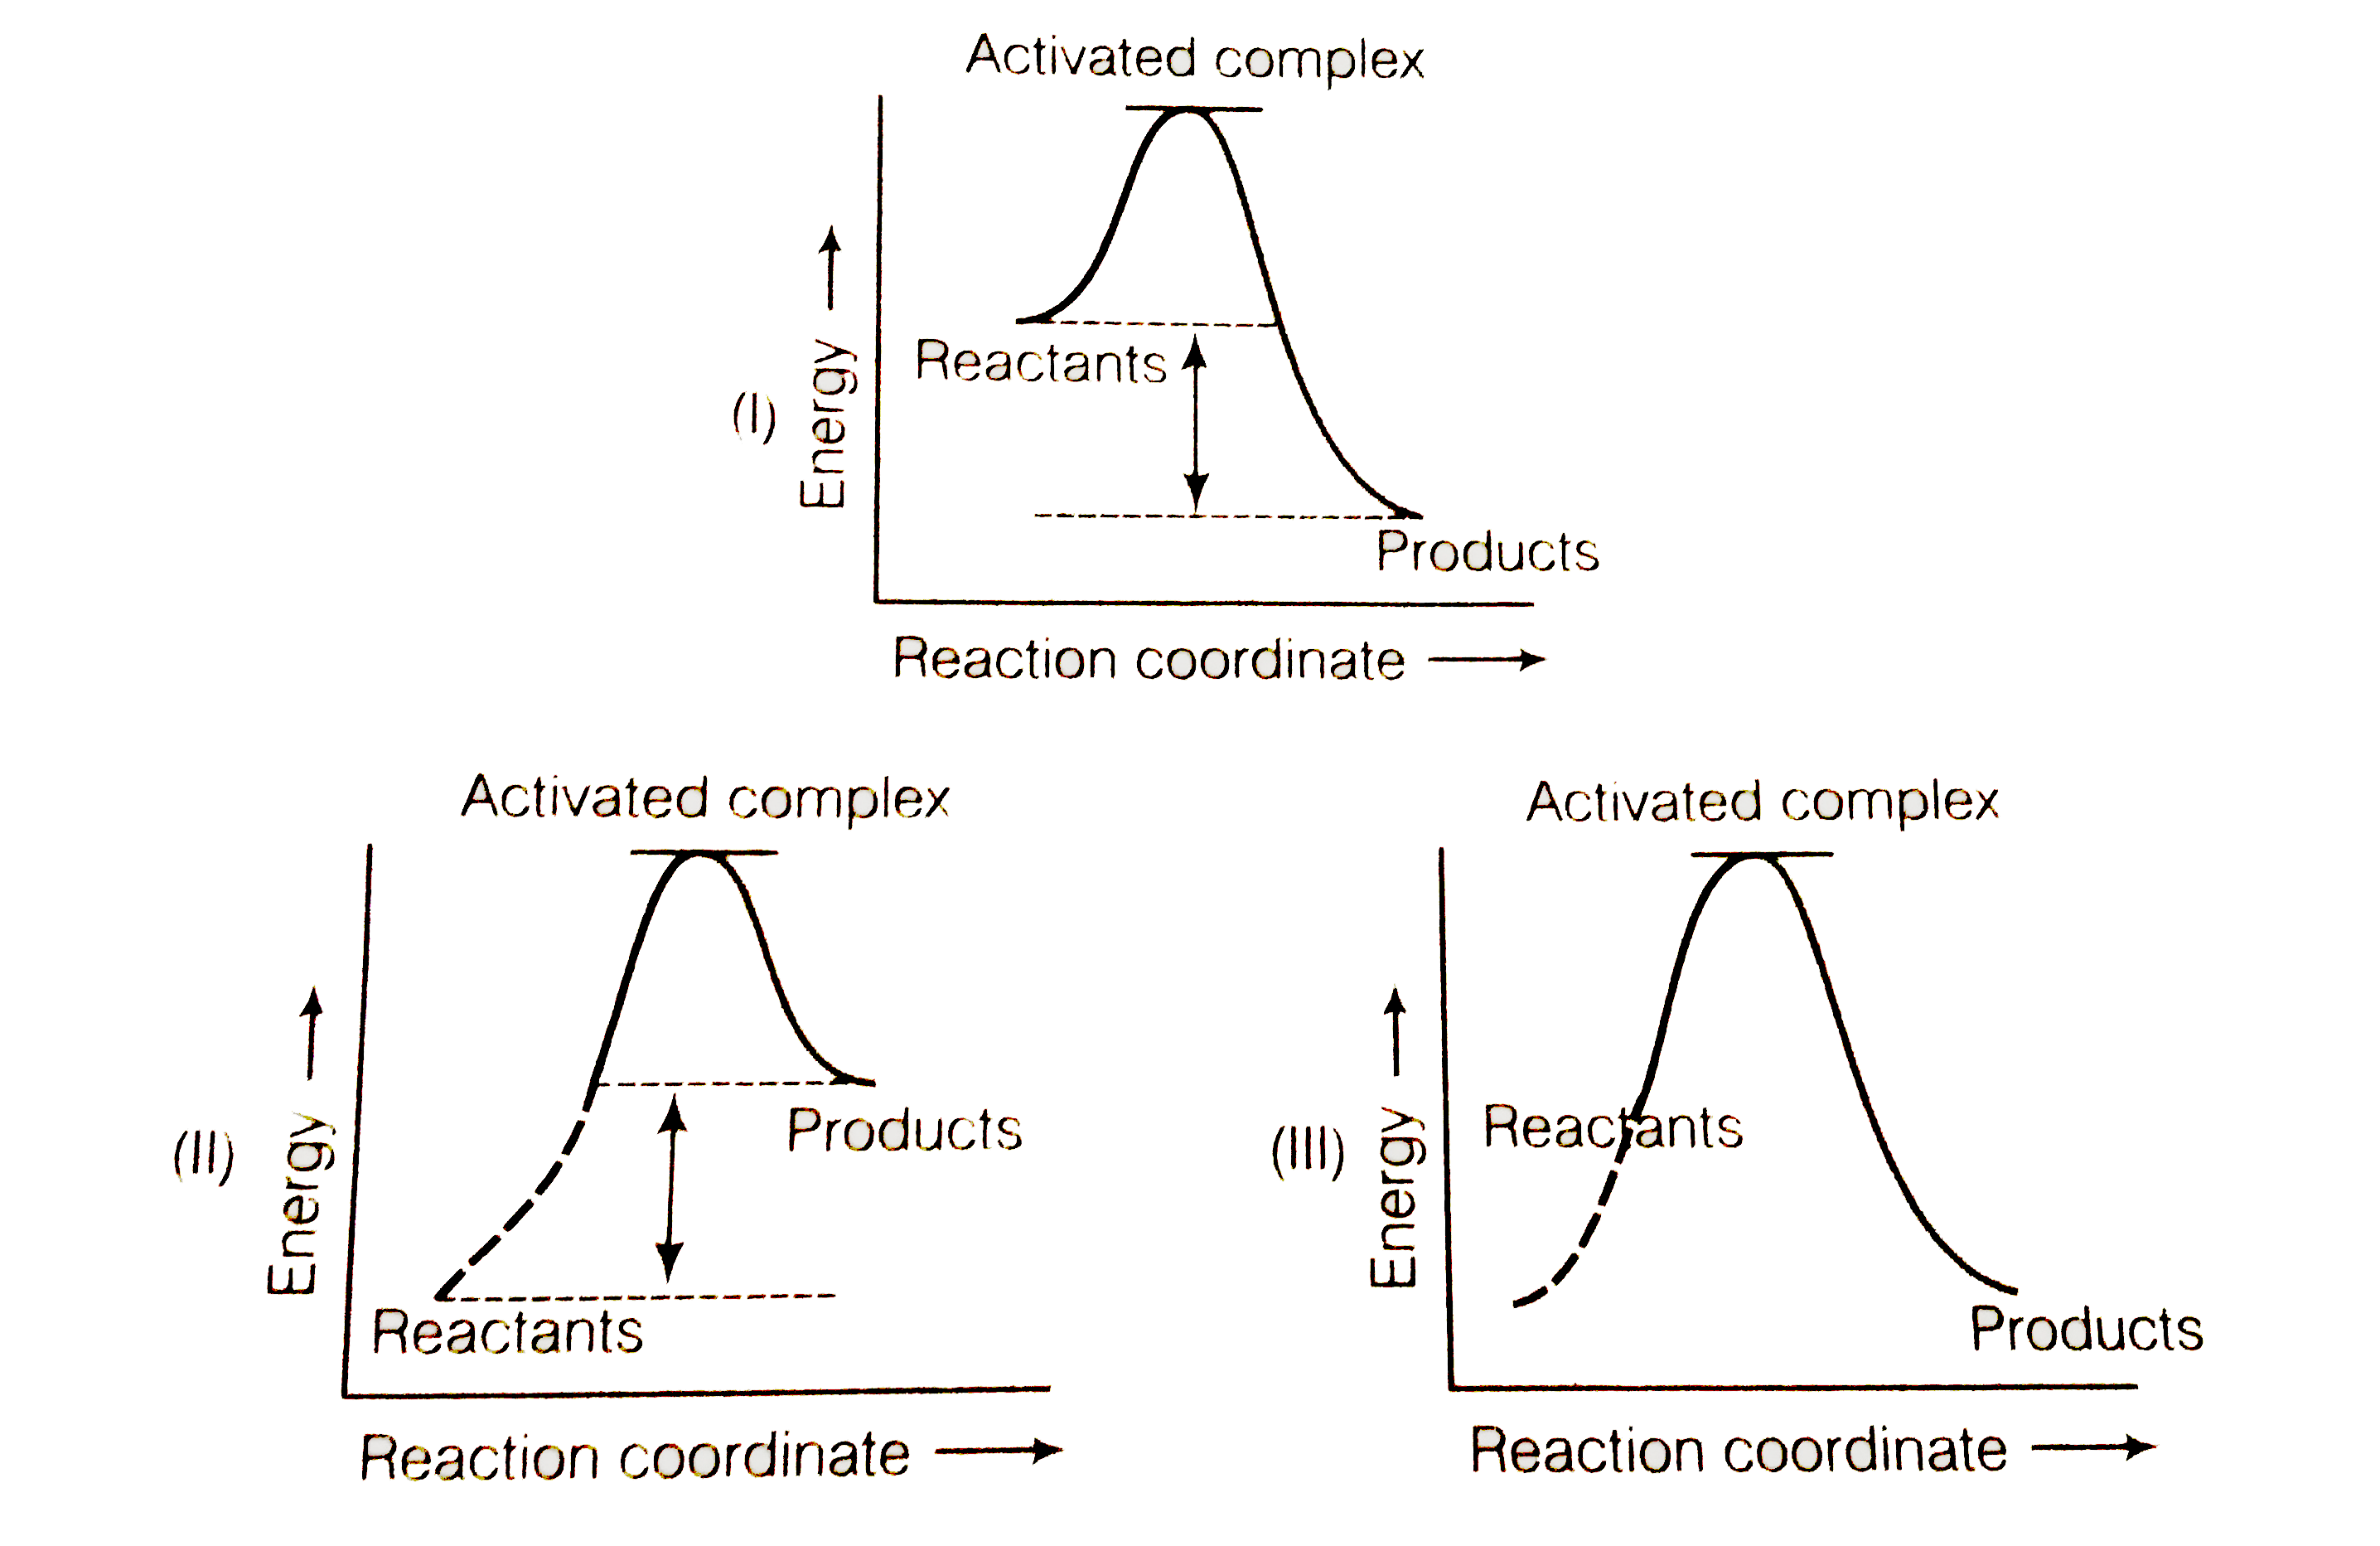
View SolutionWhich of the following graphs represents exothermic reaction?

View SolutionWhich of the following graphs represent a uniformaly accelerated motion ?
View Solution
