The correct graph between the frequecny n and square root of density (p) of a wire, keeping its length, radius and tension constant, is

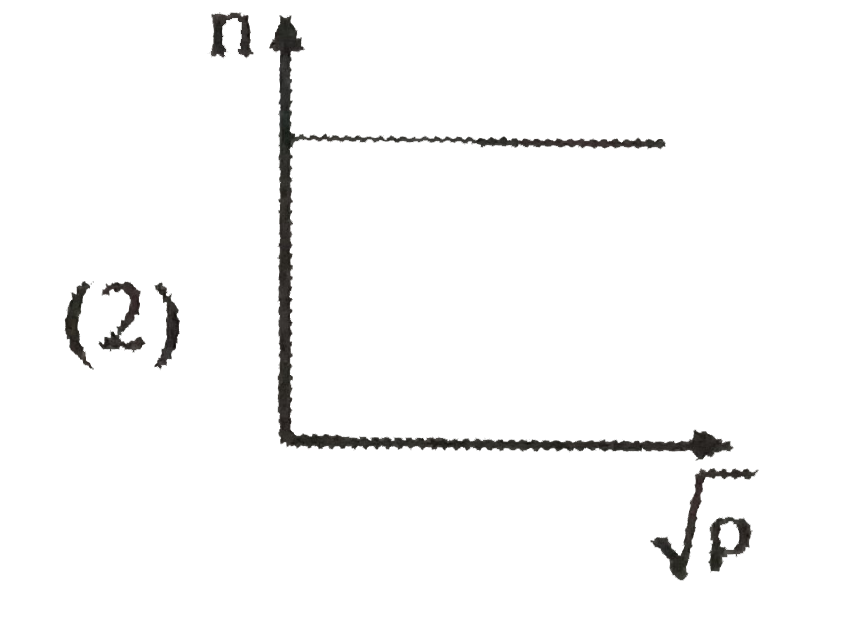
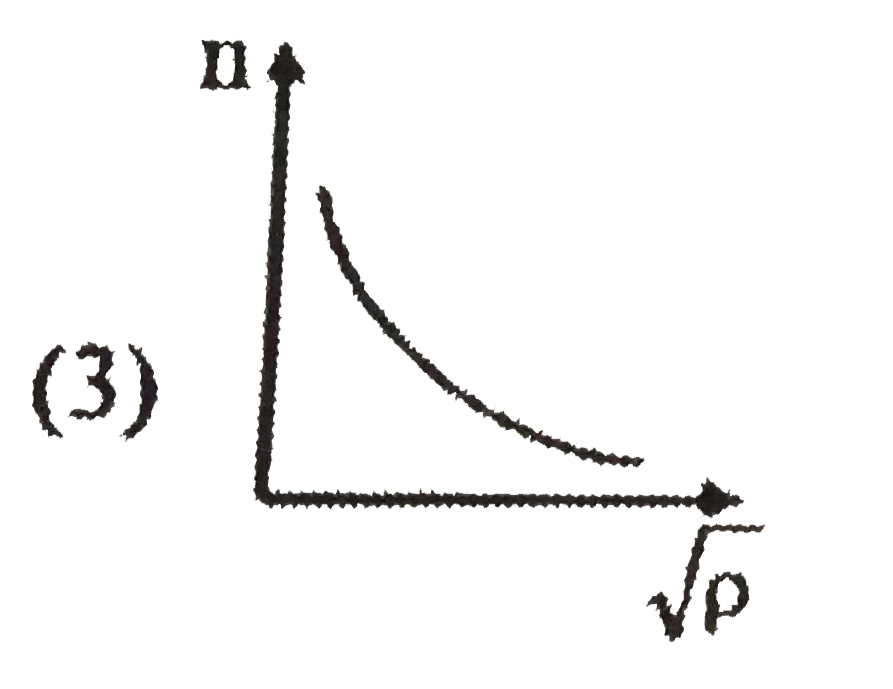
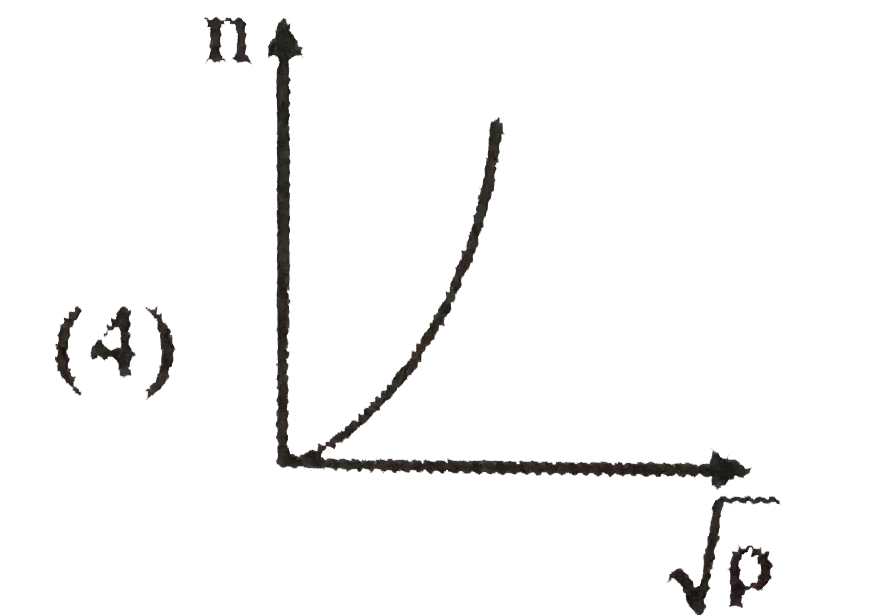
We know frequency n=p2l√Tπr2p
⇒n∝1√p
i.e., graph between n and √p will be hyperbola.
Topper's Solved these Questions
Similar Questions
Knowledge Check
The correct graph between the frequency n and square root of density ρ of a wire, keeping its length, radius and tension constant, is
A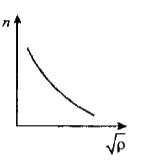 B
B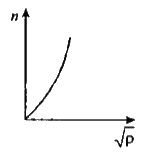 C
C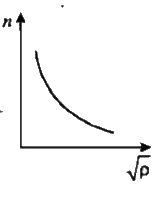 D
D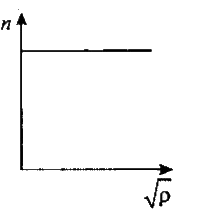
The graph between the length and square of the period of a simple pendulum is a
AcircleBparabolaCstraight lineDhyperbolaAssertion : The fundamental frequency of a stretched string is directly proportional to the square root of the tension in the string if length and mass of the string are constant.
Reason : There are n nodes and n antinodes forms when standing waves are formed in a stretched string.AIf both assertion and reason are correct and reason is a correct explanation of the assertion.BIf both assertion and reason are correct but reason is not the correct explanation of assertion.CIf assertion is correct but reason is incorrectDIf assertion is incorrect but reason is correct.
Draw a graph to show the variation of resistance of a metal wire as a function of its diameter, keeping length and temperature constant.
View SolutionWhat is the frequency of the fundamental note emitted by a wire of length 2 m and radius 1 mm under a tension of 200 N. Density of the wire is 1600 kg/m3.
View SolutionPlot a graph showing the variation of resistance of a conducting wire as function of its radius, keeping the length of a wire and its temperature as constant.
View SolutionThe graph between the surface charge density and radius of curvature for an isolated conductor at constant potential is
View SolutionA stretched wire of length 30 cm emits a note of freqency 200 Hz, when plucked at its centre, By keeping its tension constant, the length of the wire is decreases by 5 cm. then it will a sound note of frequency ?
View Solution
