The figure given below shows a particular food web. Each alphabet represents a different species. Arrows indicate the flow of energy and materials. Which of the following would probaly have the greatest total biomass

K+M
K
J+G
F
The correct Answer is:D
Topper's Solved these Questions
Similar Questions
The figure given below represents an experiment to demonstrate a particular aspect of photosynthesis. The alphabet "A" represents a certain condition inside the flask
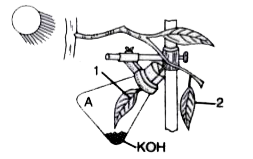
In what manner do the leaves 1 and 2 differ at the end of the starch tast
View SolutionThe figure given below represents an experiment to demonstrate a particular aspect of photosynthesis. The alphabet "A" represents a certain condition inside the flask
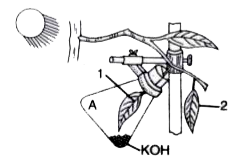
Name an a alternative chemical which can be use instead KOH
View Solution
Knowledge Check
The diagram below shows a particular food web. Each letter represents a different species. Arrows indicate the flow of energy and materials. Which of the following would probably have the greatest total biomass?
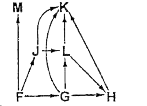 AFBJ + GCKDK + M
Given figure represents demonstration of osmosis by egg membrane osmoscope.
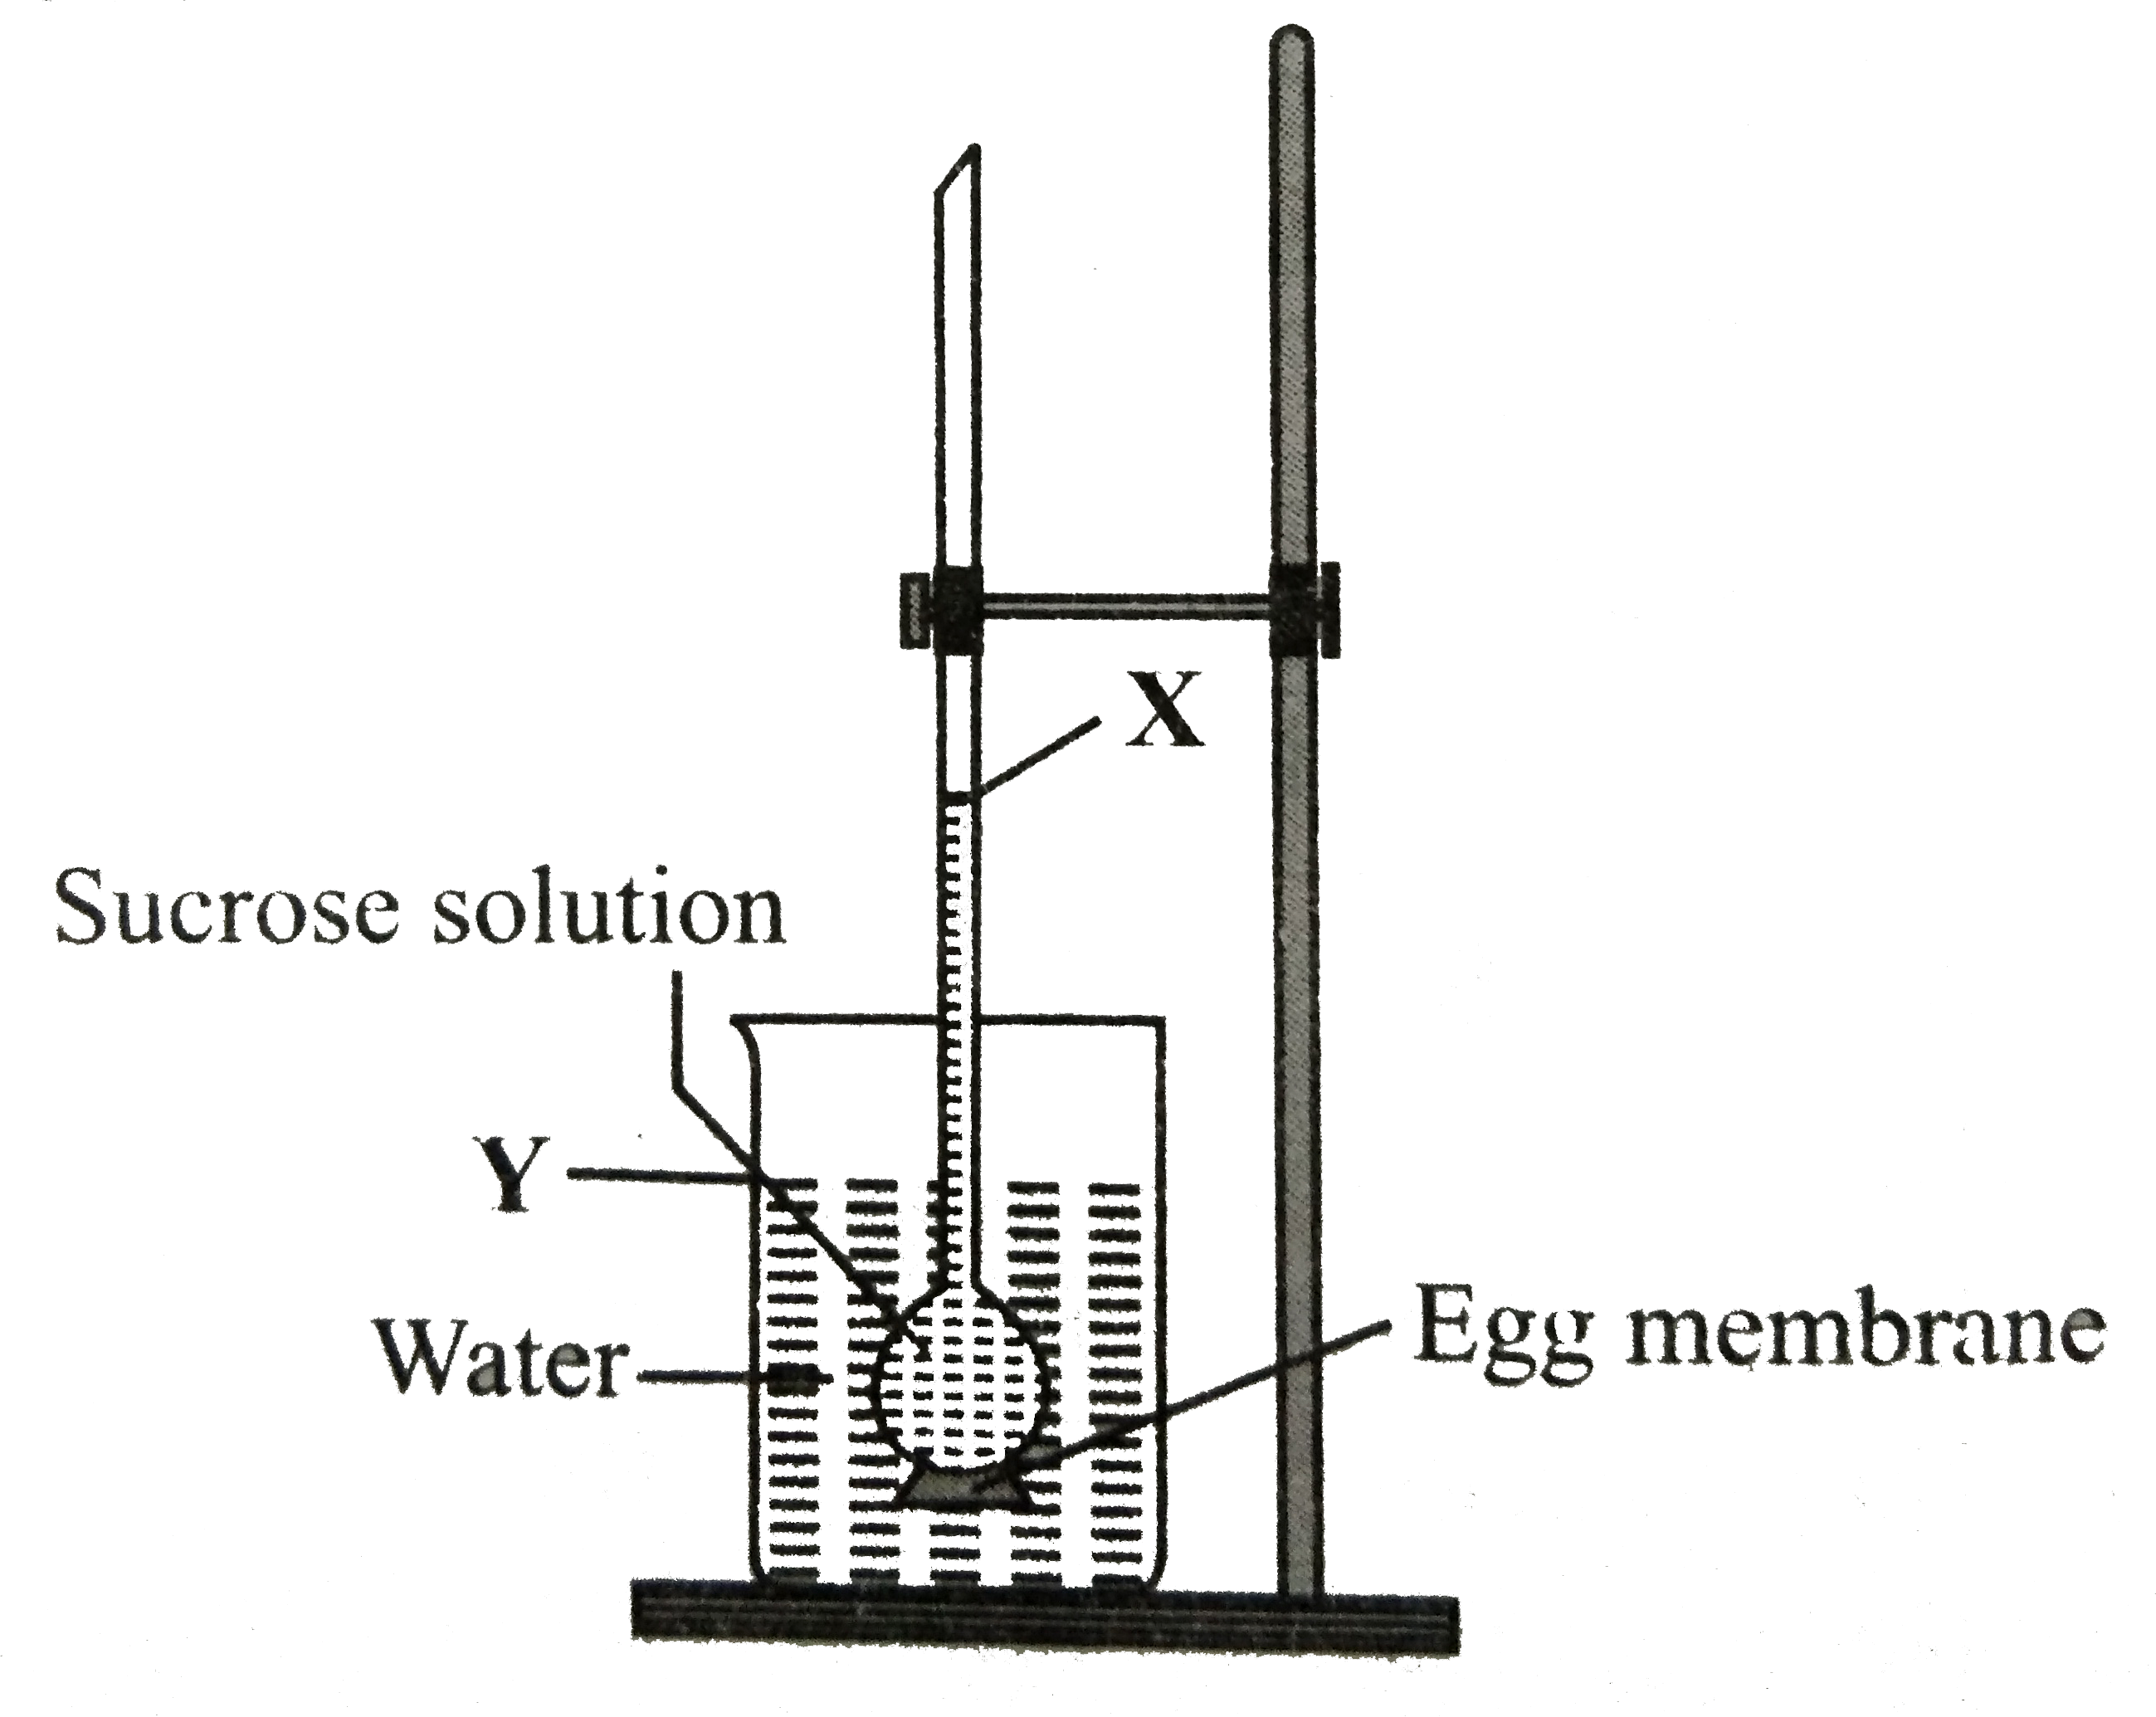
After few days which of the following would have occurred?AA rise in level Xand a drop in levelY.BA drop in level Xand a drop in levelY.CA rise in level Xand a rise in level Y.DA drop in level Xand a rise in level Y.Given figure represents demonstration of osmosis by egg membrane osmoscope.

After few days which of the following would have occurred?AA rise in level Xand a drop in levelY.BA drop in level Xand a drop in levelY.CA rise in level Xand a rise in level Y.DA drop in level Xand a rise in level Y.
The figure given below shows the images of sound waves. Look at them and answer the following questions
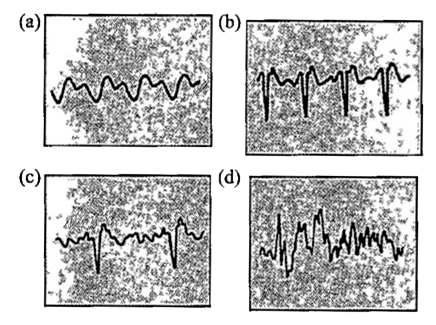
Which represents the softest sound ?
View SolutionThe figure given below shows the images of sound waves. Look at them and answer the following questions
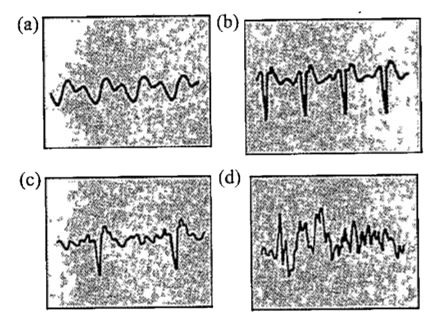
Which represents the sound with the lowest pitch?
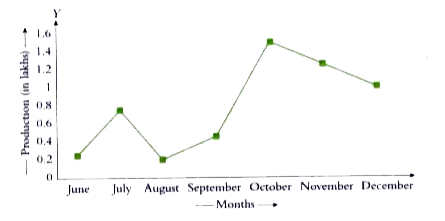
View SolutionThe line graph given below shows the production of a particular model of bike produced in different months. Read the line graph and answer the following questions:
In which month is the production maximum?
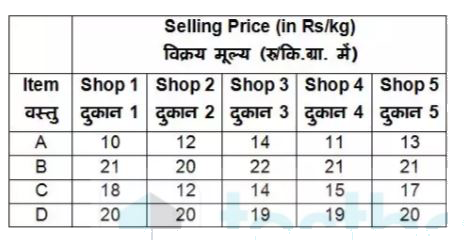
View SolutionThe tabel given below shows the selling price (in Rs/kg) of 4 different items at 5 different shops.
If one kg of each item is purchased from each shop, then which shop will have the least total selling price?
View SolutionThe figure of the lac from E. coli is shown below. Each alphabets indicates its components may be used more than once

Which of the following is corect in which all the alphabets are matched with their functions
View Solution
