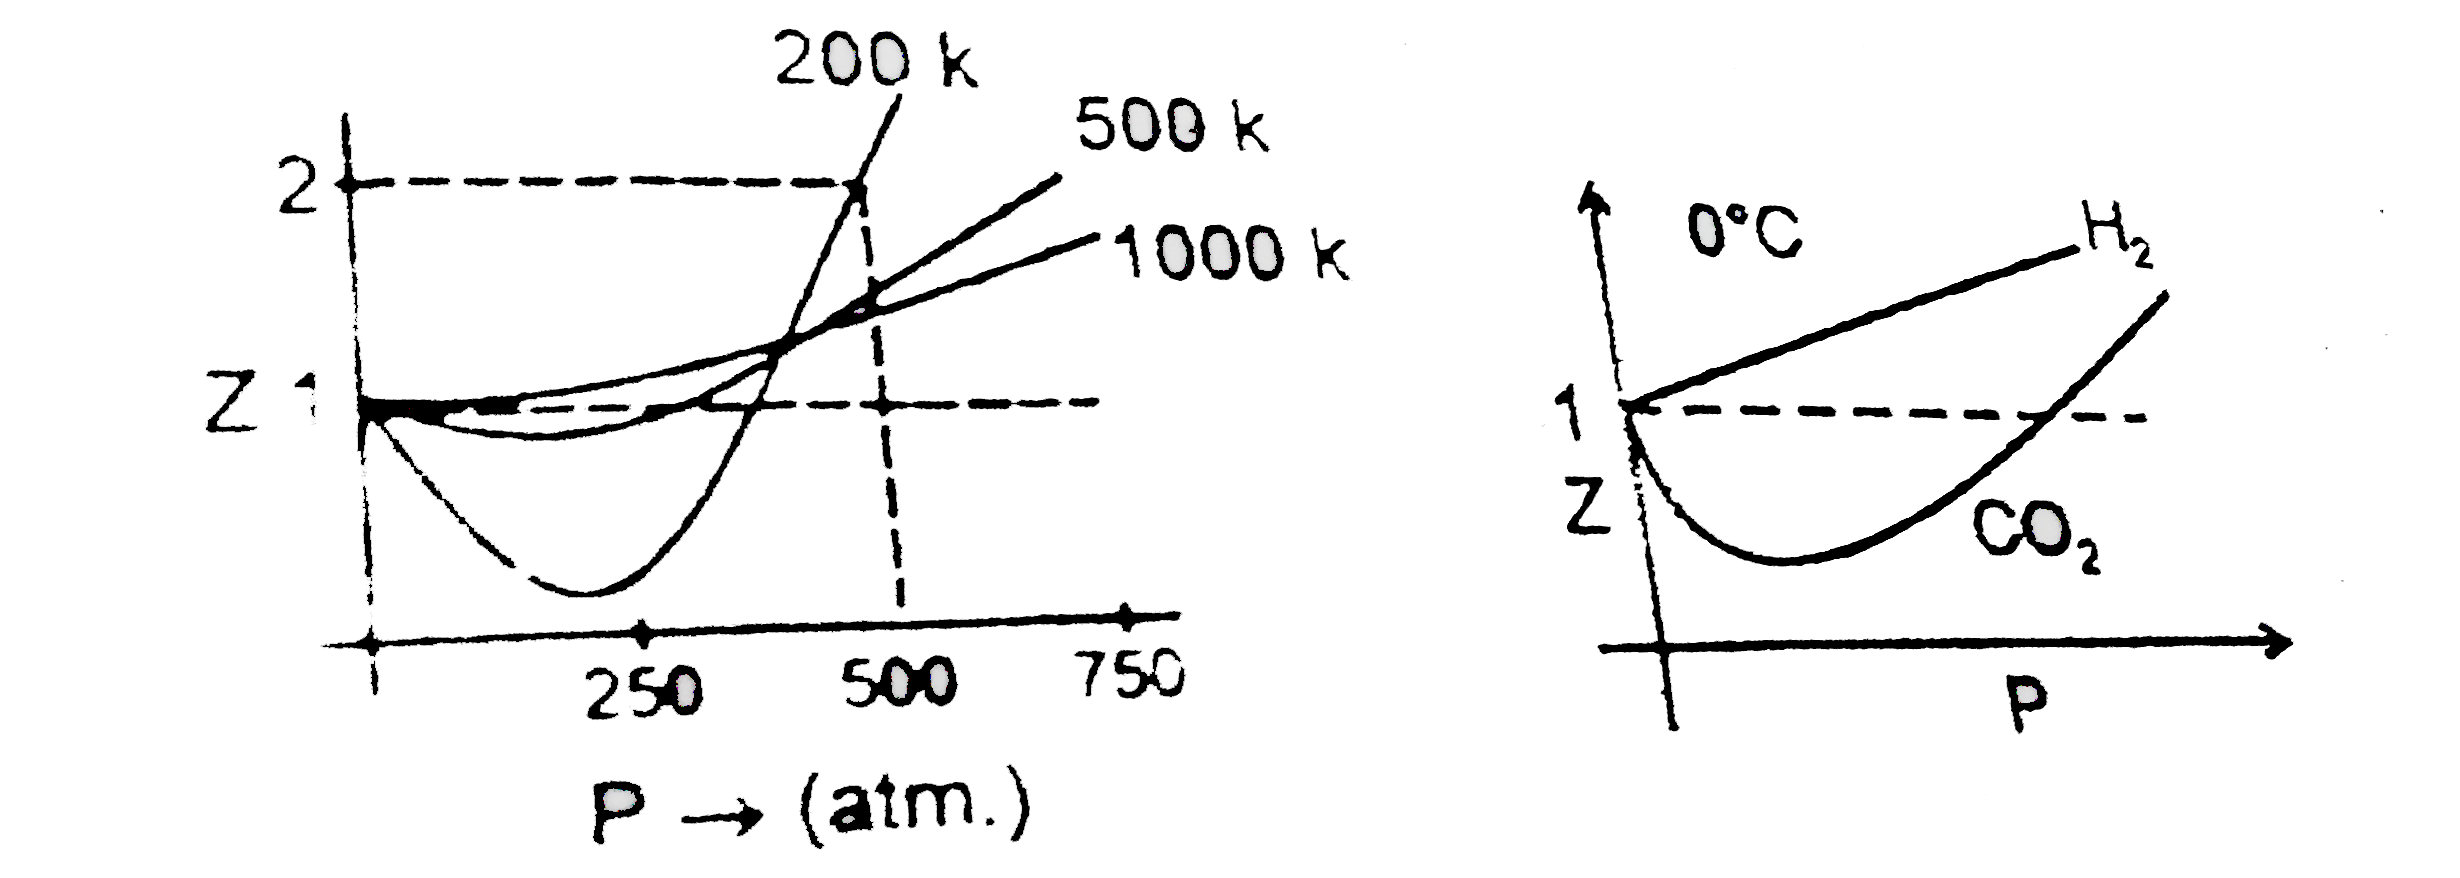
Sketch shows the plot of Z v/s P for a hypothetical gas for one mole at three distint temperature.
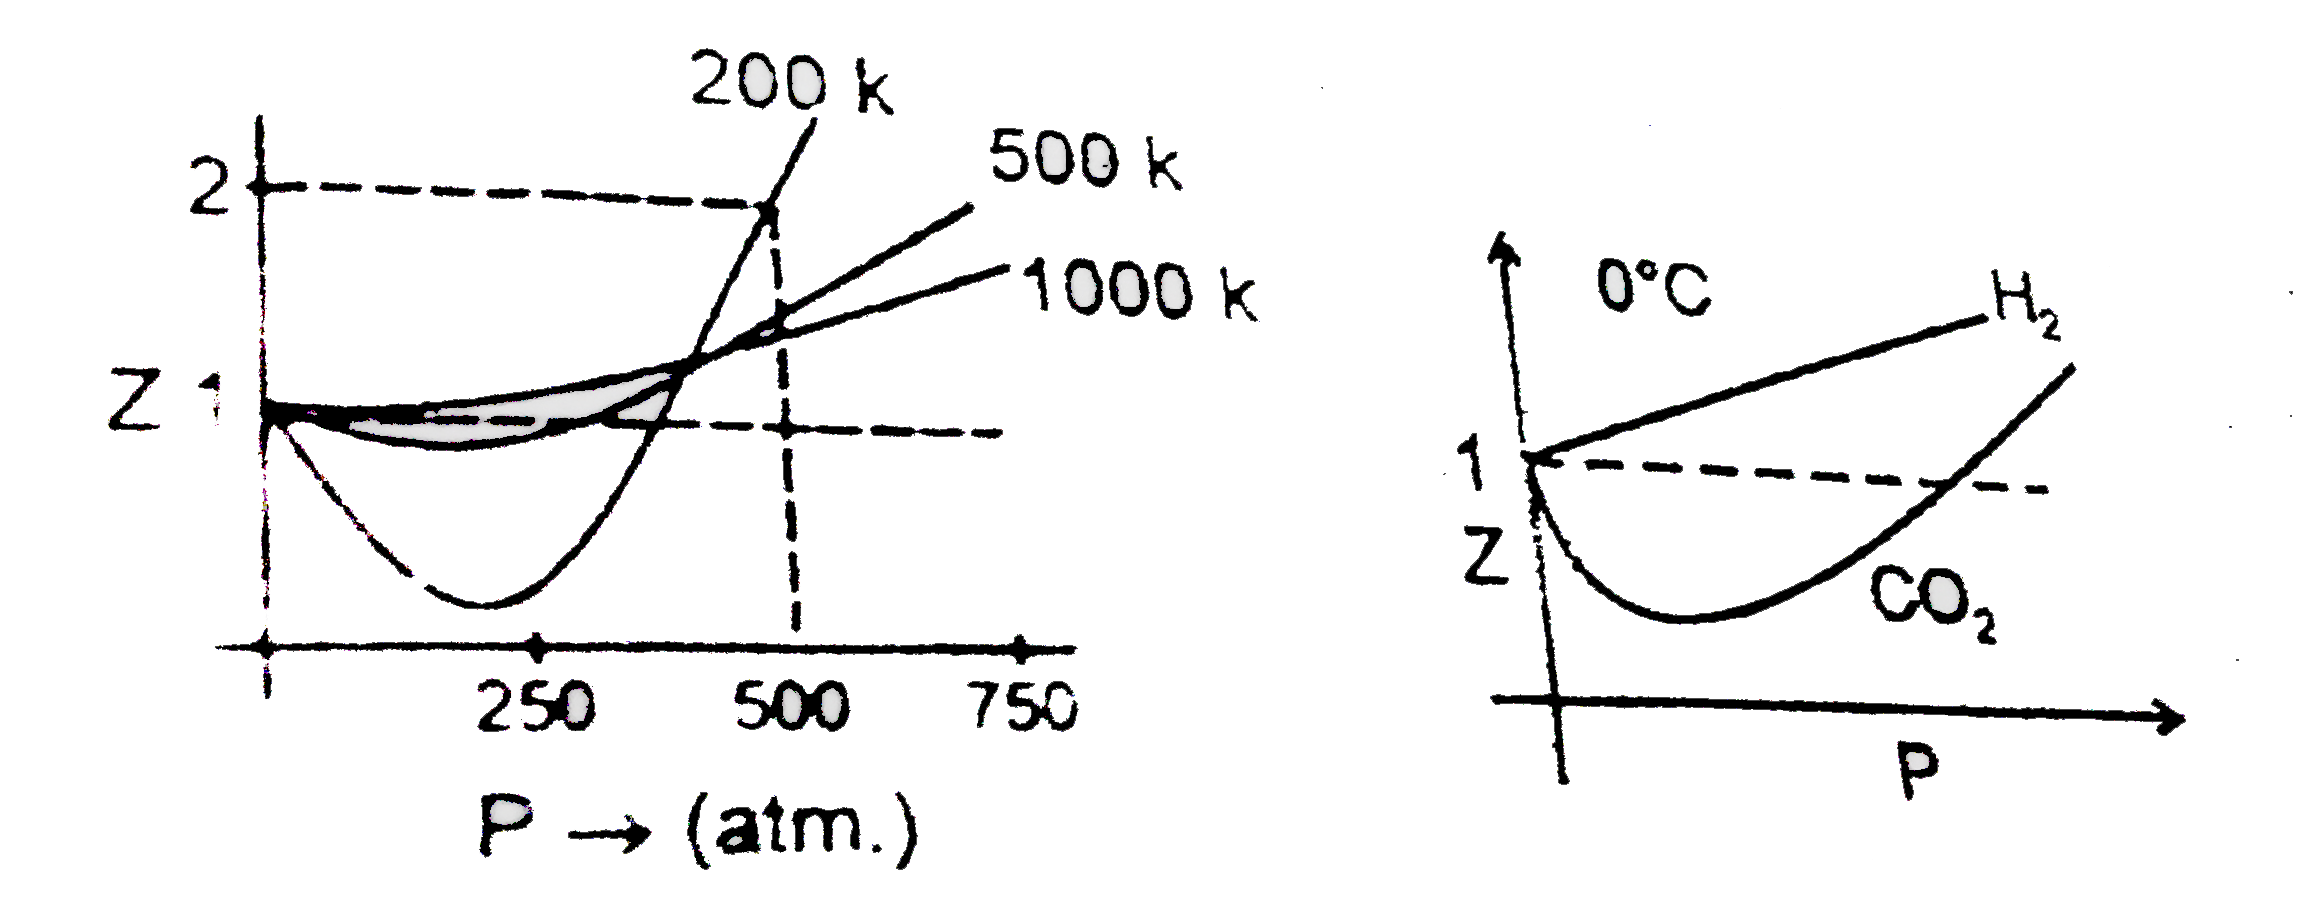
Boyle's temperature is the temperature at which gas shows ideal behaviour over a pressure range in the low pressure region.Boyle's temperature (Tb)=aRb.If a plot is obtained at temperature well below Boyle's temperature then the curve will show negative deviation, in low pressure region and positive deviation in the high pressure region. Near critical temperature the curve is more likely as CO2 and the temperature well above critical temperature curve is more like H2 at 0∘C as shown above.At high pressure suppose all the constant temperature curve varies linearly with pressure according to the following equation : Z=1+PbRT (R=2calmol−1K−1)
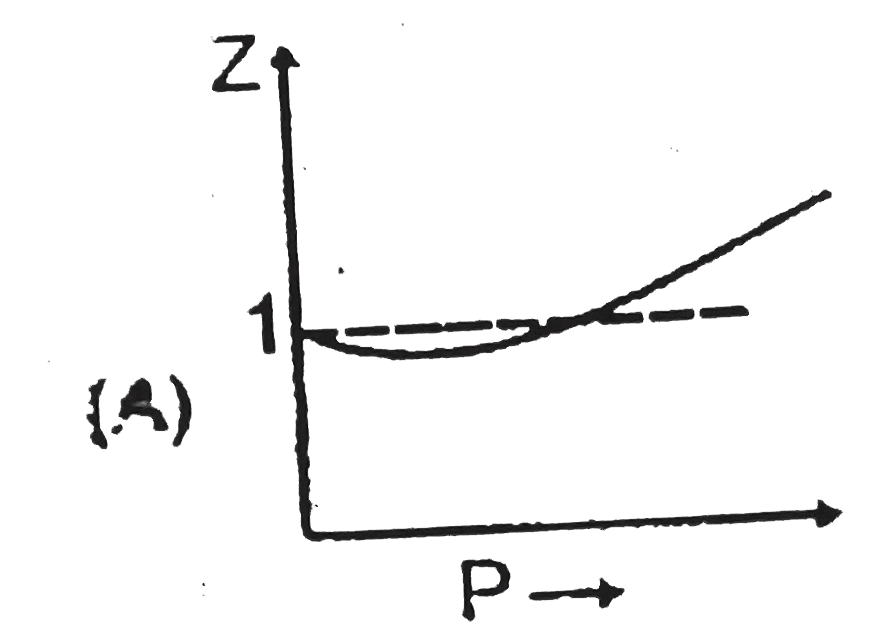
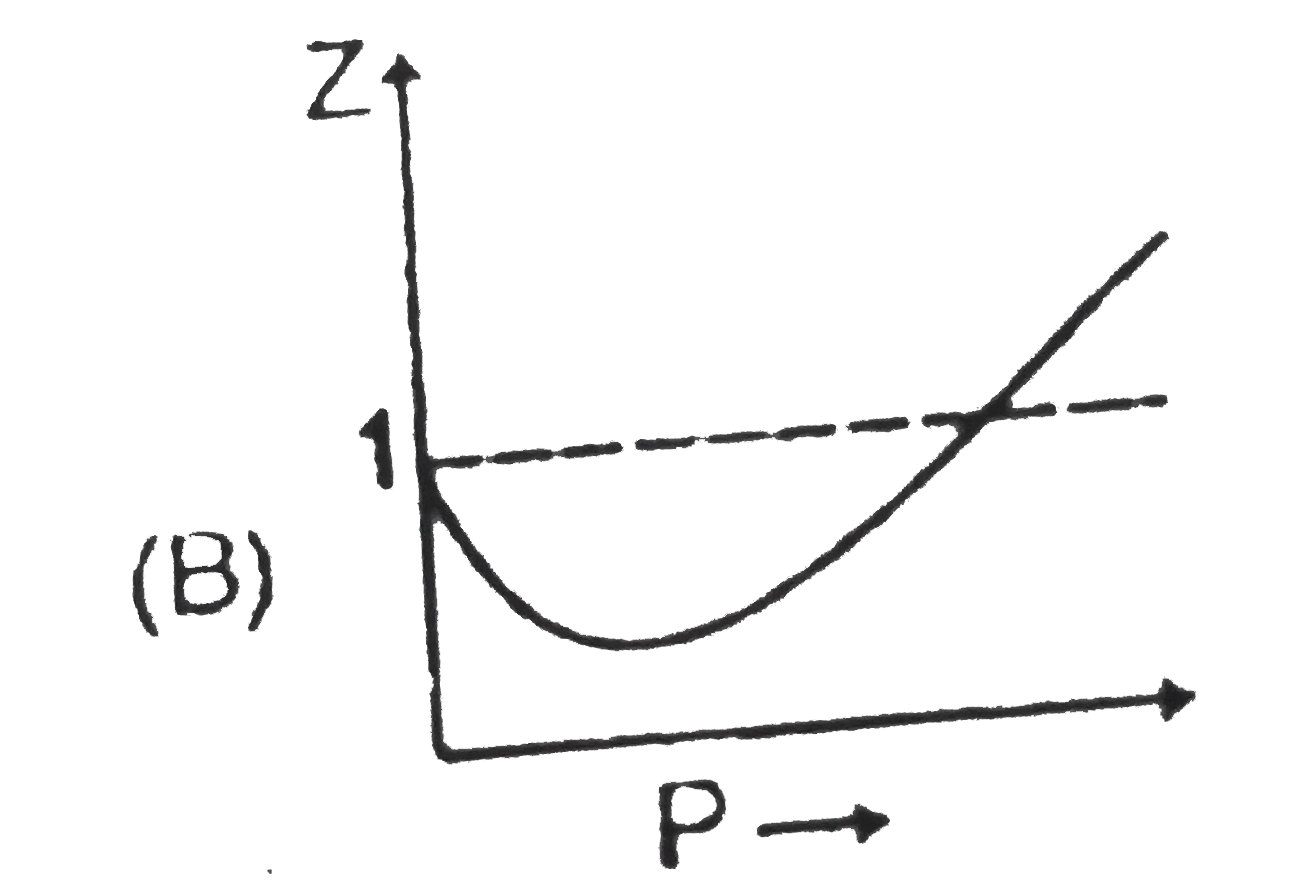
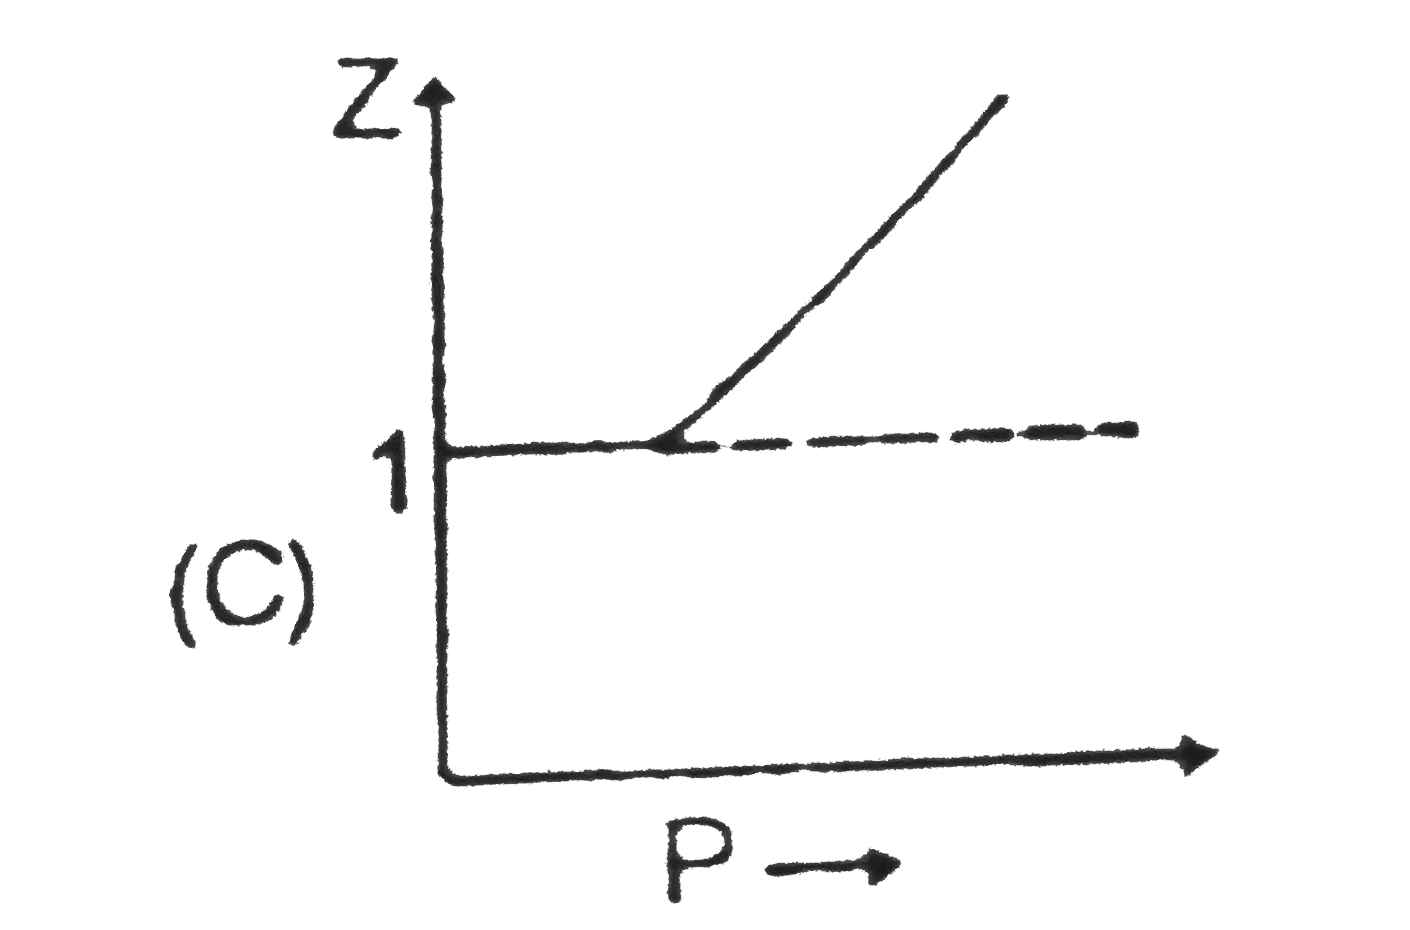
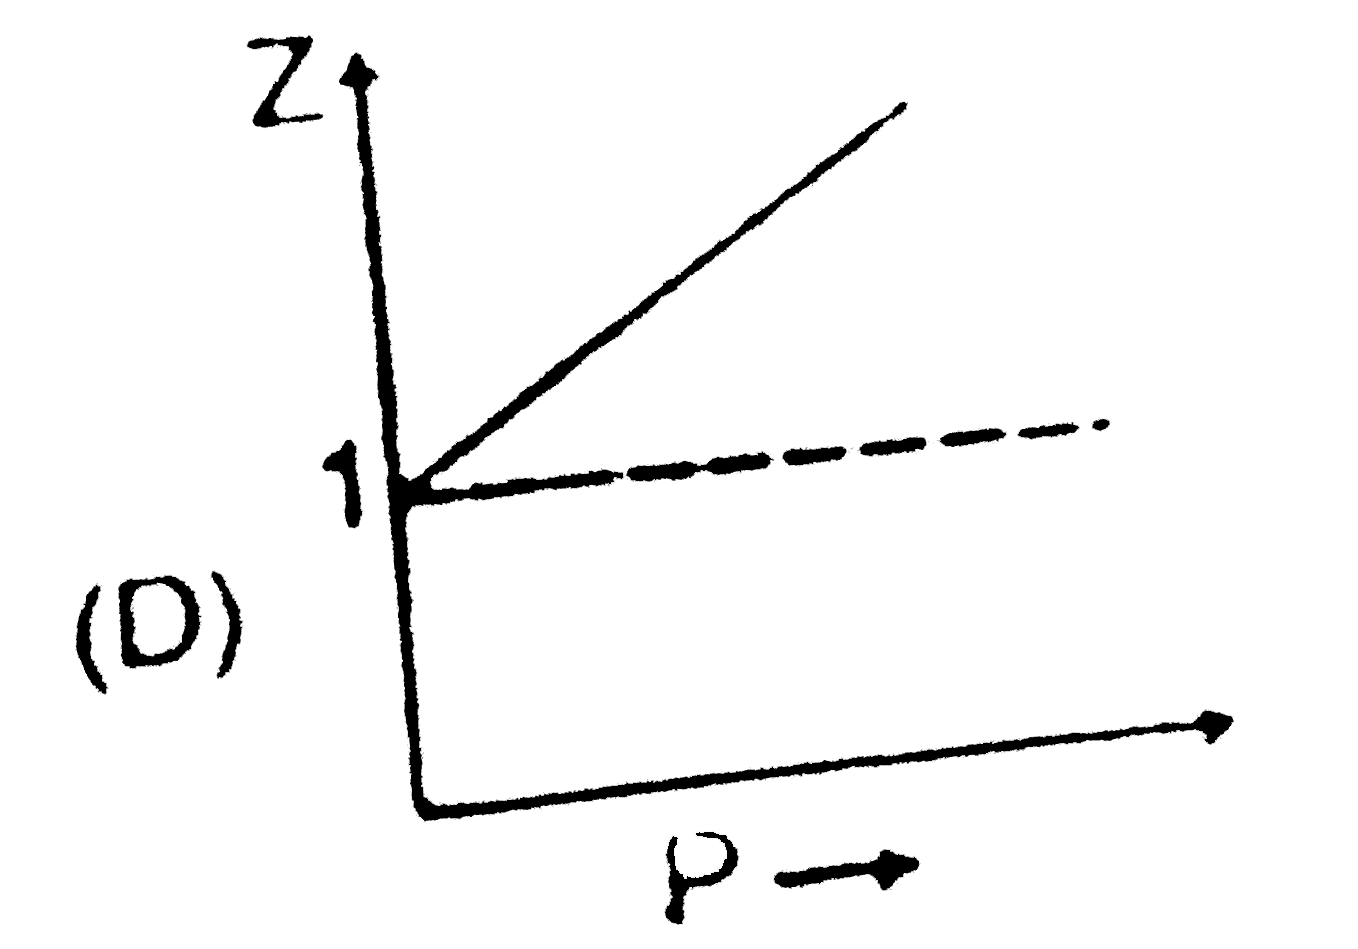
Plot at Boyle's temperature for the gas will be
The correct Answer is:C
AT boyles temp, a real gas shows ideal behaviour in the low pressure region.
Topper's Solved these Questions
Similar Questions
Sketch shows the plot of Z v/s P for a hypothetical gas for one mole at three distint temperature.
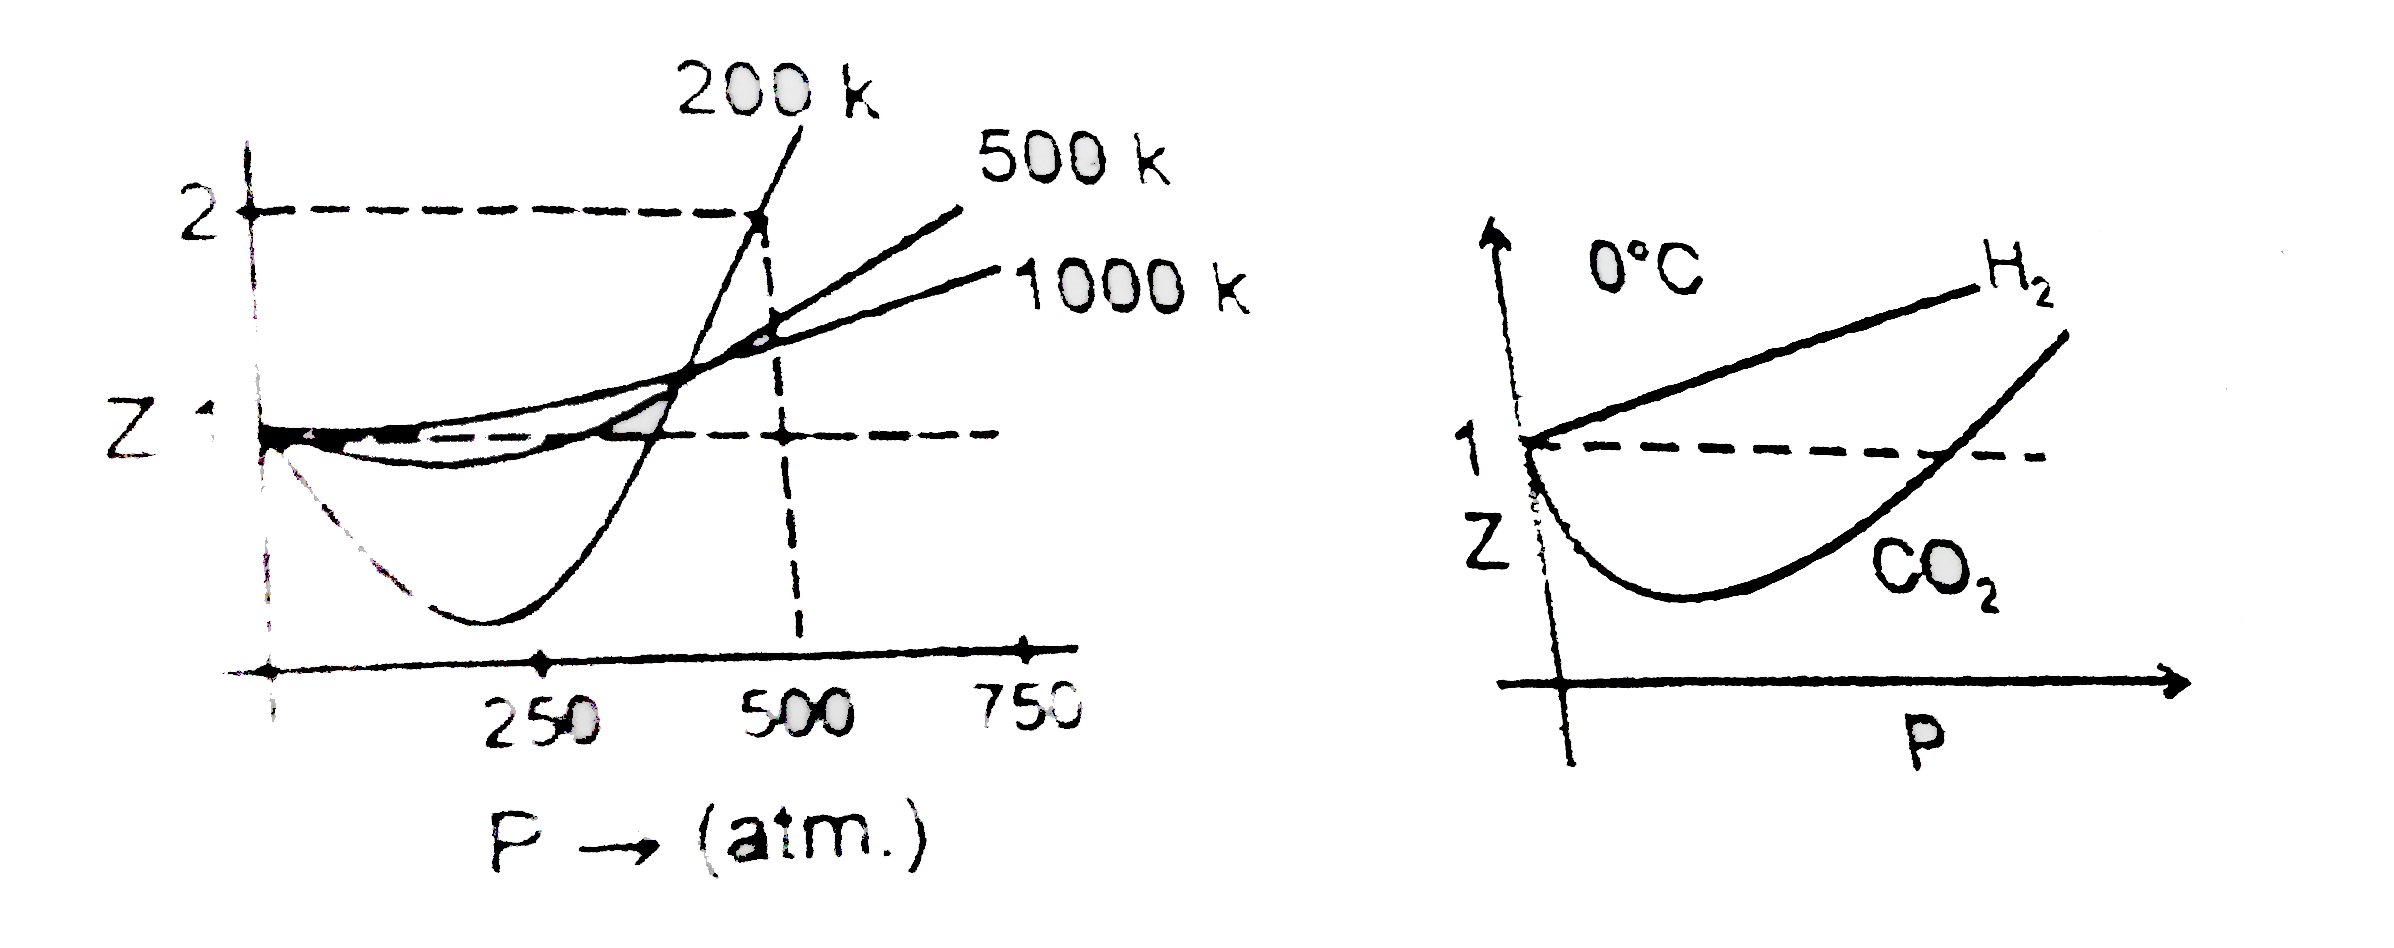
Boyle's temperature is the temperature at which gas shows ideal behaviour over a pressure range in the low pressure region.Boyle's temperature (Tb)=aRb.If a plot is obtained at temperature well below Boyle's temperature then the curve will show negative deviation, in low pressure region and positive deviation in the high pressure region. Near critical temperature the curve is more likely as CO2 and the temperature well above critical temperature curve is more like H2 at 0∘C as shown above.At high pressure suppose all the constant temperature curve varies linearly with pressure according to the following equation : Z=1+PbRT (R=2calmol−1K−1)
Which of the following is correct :
View SolutionSketch shows the plot of Z v/s P for a hypothetical gas for one mole at three distint temperature.
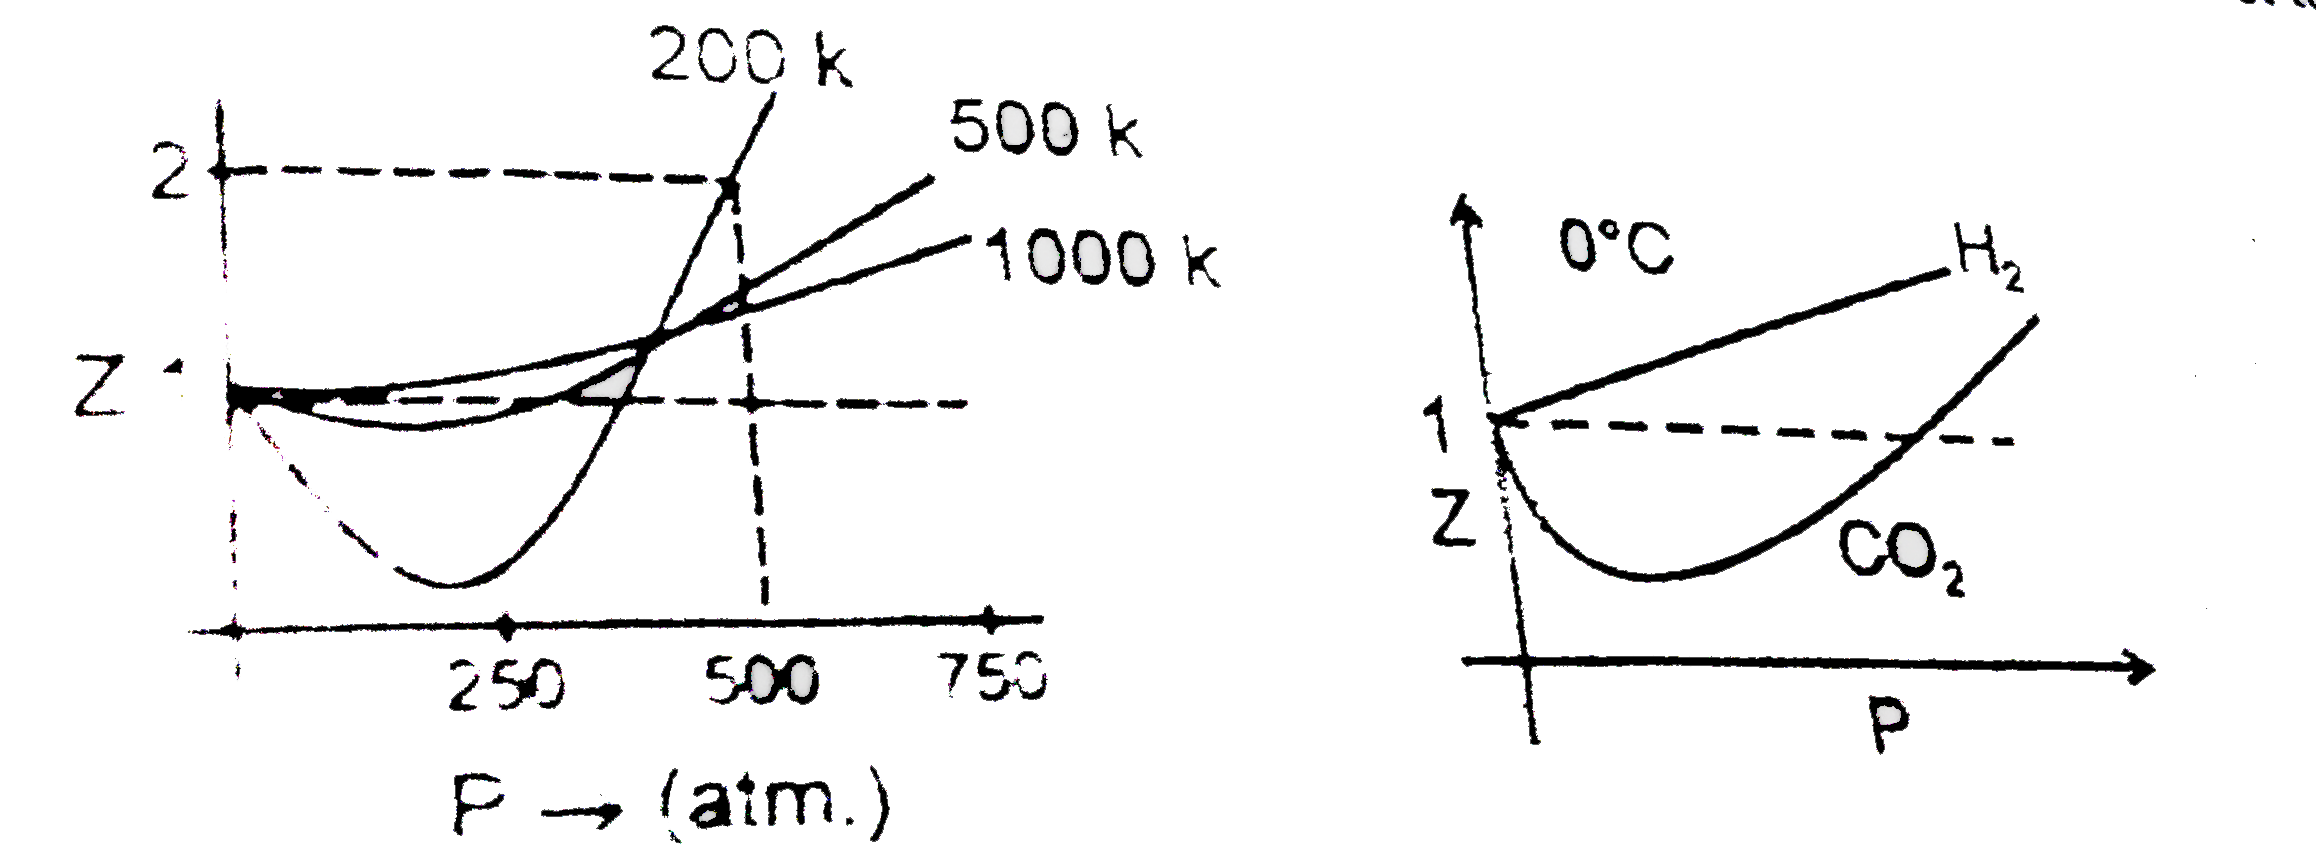
Boyle's temperature is the temperature at which gas shows ideal behaviour over a pressure range in the low pressure region.Boyle's temperature (Tb)=aRb.If a plot is obtained at temperature well below Boyle's temperature then the curve will show negative deviation, in low pressure region and positive deviation in the high pressure region. Near critical temperature the curve is more likely as CO2 and the temperature well above critical temperature curve is more like H2 at 0∘C as shown above.At high pressure suppose all the constant temperature curve varies linearly with pressure according to the following equation : Z=1+PbRT (R=2calmol−1K−1)
For 500 K plot value of Z changes from 2 to 2.2 if pressure is varied from 1000 atm to 1200 atm (high pressure ) then the value of bRT will be
View Solution
Knowledge Check
Sketch shows the plot of Z v/s P for a hypothetical gas for one mole at three distint temperature.

Boyle's temperature is the temperature at which gas shows ideal behaviour over a pressure range in the low pressure region.Boyle's temperature (Tb)=aRb.If a plot is obtained at temperature well below Boyle's temperature then the curve will show negative deviation, in low pressure region and positive deviation in the high pressure region. Near critical temperature the curve is more likely as CO2 and the temperature well above critical temperature curve is more like H2 at 0∘C as shown above.At high pressure suppose all the constant temperature curve varies linearly with pressure according to the following equation : Z=1+PbRT (R=2calmol−1K−1)
Which of the following is correct :Aab<0.4kcalmol−1B0.4 k cal mol−1<ab<2 k cal mol−1Cab<0.4kcalmol−1Dab=1KCalmol−1Sketch shows the plot of Z v/s P for a hypothetical gas for one mole at three distint temperature.
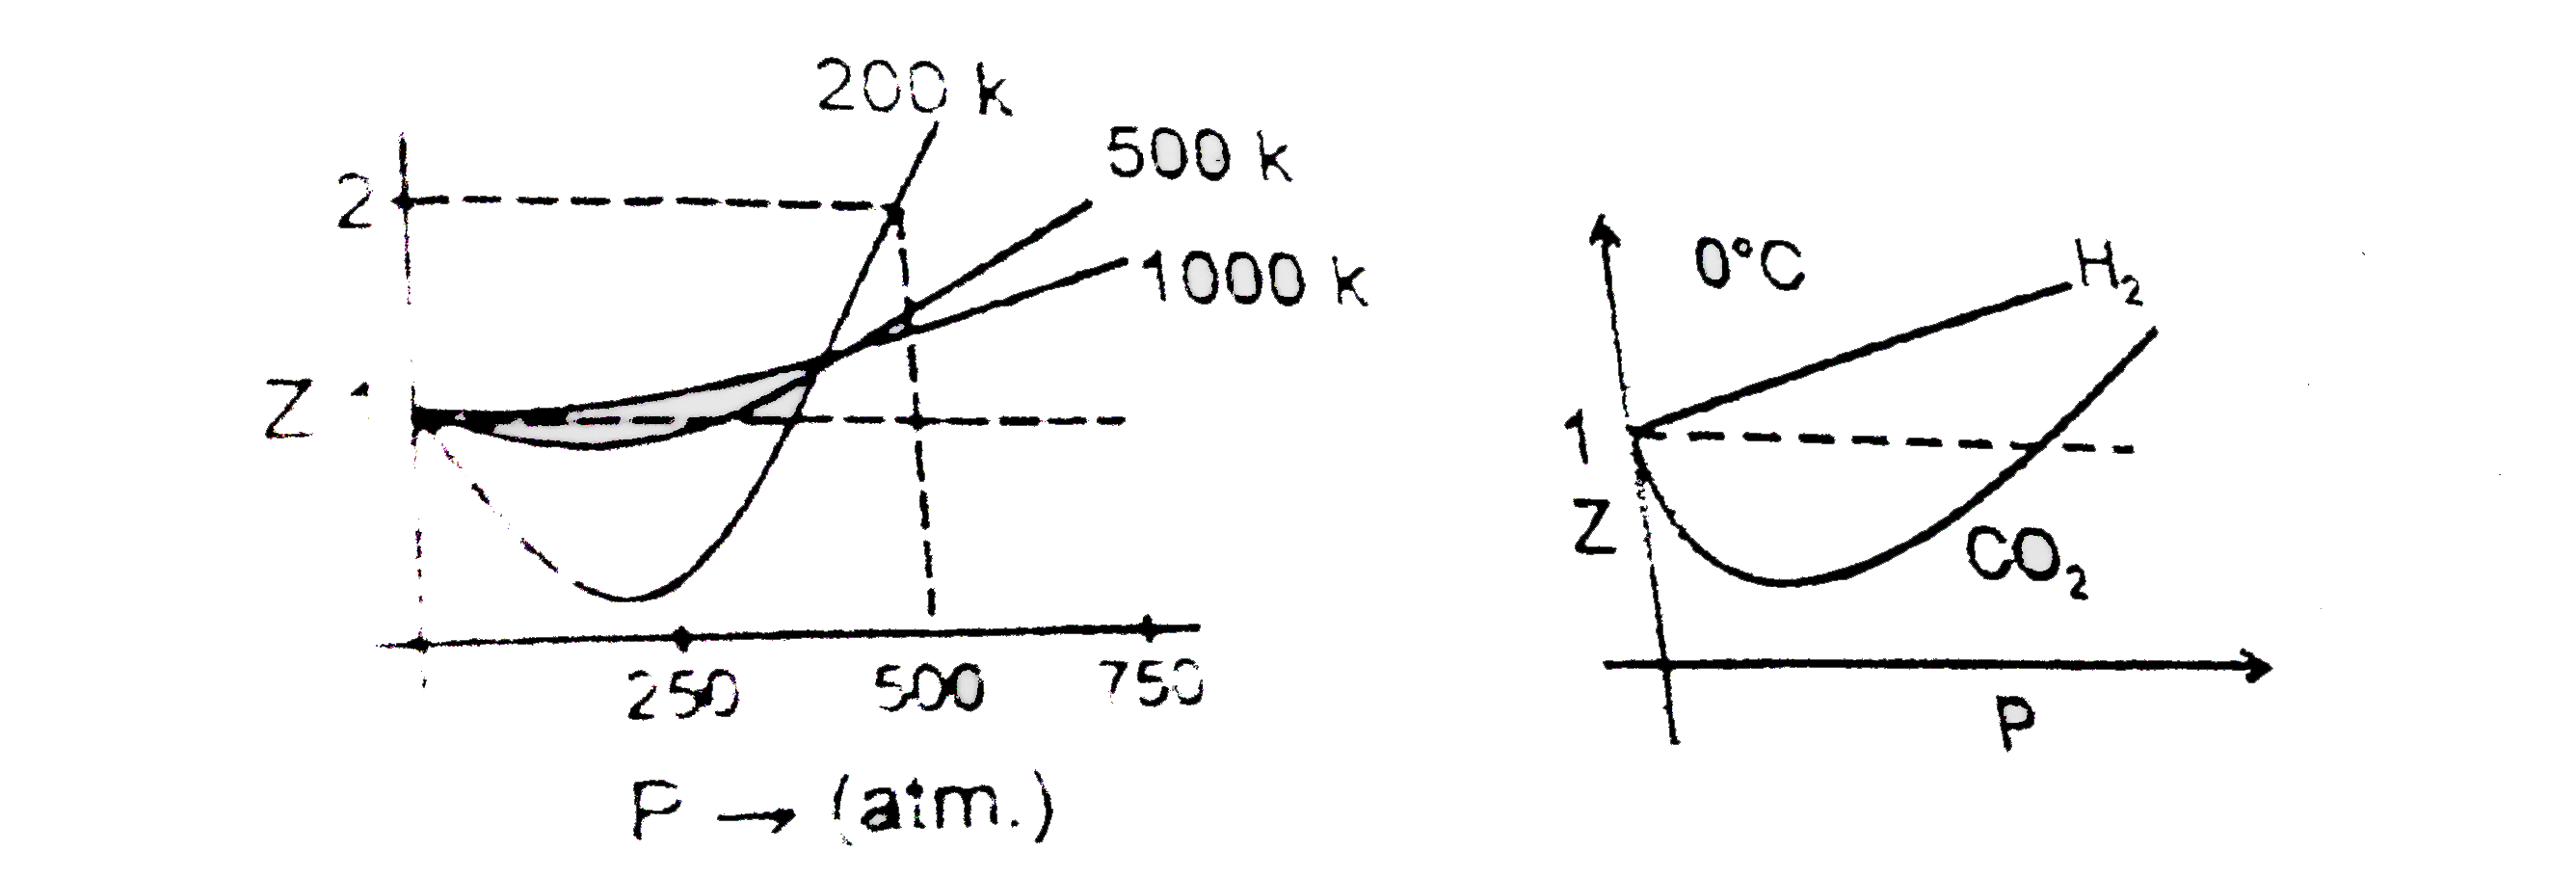
Boyle's temperature is the temperature at which gas shows ideal behaviour over a pressure range in the low pressure region.Boyle's temperature (Tb)=aRb.If a plot is obtained at temperature well below Boyle's temperature then the curve will show negative deviation, in low pressure region and positive deviation in the high pressure region. Near critical temperature the curve is more likely as CO2 and the temperature well above critical temperature curve is more like H2 at 0∘C as shown above.At high pressure suppose all the constant temperature curve varies linearly with pressure according to the following equation : Z=1+PbRT (R=2calmol−1K−1)
As shown in the figure at 200 K and 500 atm value of compressibility factor is 2 (approx).Then volume of the gas at the point will beA0.01 LB0.09LC0.065 LD0.657 LSketch shows the plot of Z v/s P for a hypothetical gas for one mole at three distint temperature.

Boyle's temperature is the temperature at which gas shows ideal behaviour over a pressure range in the low pressure region.Boyle's temperature (Tb)=aRb.If a plot is obtained at temperature well below Boyle's temperature then the curve will show negative deviation, in low pressure region and positive deviation in the high pressure region. Near critical temperature the curve is more likely as CO2 and the temperature well above critical temperature curve is more like H2 at 0∘C as shown above.At high pressure suppose all the constant temperature curve varies linearly with pressure according to the following equation : Z=1+PbRT (R=2calmol−1K−1)
For 500 K plot value of Z changes from 2 to 2.2 if pressure is varied from 1000 atm to 1200 atm (high pressure ) then the value of bRT will beA10−3atm−1B2×10−3atm−1C5×10−4atm−1D10−4atm−1
Sketch shows the plot of Z v/s P for a hypothetical gas for one mole at three distint temperature.
Boyle's temperature is the temperature at which gas shows ideal behaviour over a pressure range in the low pressure region.Boyle's temperature (Tb)=aRb.If a plot is obtained at temperature well below Boyle's temperature then the curve will show negative deviation, in low pressure region and positive deviation in the high pressure region. Near critical temperature the curve is more likely as CO2 and the temperature well above critical temperature curve is more like H2 at 0∘C as shown above.At high pressure suppose all the constant temperature curve varies linearly with pressure according to the following equation : Z=1+PbRT (R=2calmol−1K−1)
In very high pressure region if Z v/s P is plotted at 1200 K for the above gas then it will have greatest slope.
View SolutionSketch shows the plot of Z vs P for 1 mol of a hypothetical gas at three distinct temperature.
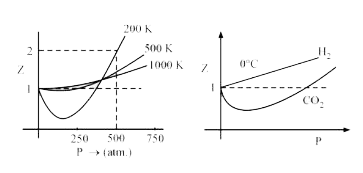
Boyle’s temperature is the temperature at which a gas shows ideal behaviour over a pressure range in the low pressure region. Boyle’s temperature (Tb)=aRb. If a plot is obtained at temperatures well below Boyle’s temperature then the curve will show negative deviation, in low pressure region and positive deviation in the high pressure region. Near critical temperature the curve is more like CO2 and the temperature well above critical temperature curve is more like H2 as shown above. At high pressure suppose all the constant temperature curve varies linearly with pressure according to the following equation: Z=1+PbRT(R=2calmol−1K−1)
For 500 K plot the value of Z changes from 2 to 2.2 if pressure is varied from 1000 atm to 1200 atm (high pressure) then the value of bRT will be :
View SolutionBoyle's temperature Tb is equal to
View SolutionBoyle's temperature Tb is equal to
View SolutionSketch shows the plot of Z v/s P for a hypothetical gas for one mole at three distint temperature.

Boyle's temperature is the temperature at which gas shows ideal behaviour over a pressure range in the low pressure region.Boyle's temperature (Tb)=aRb.If a plot is obtained at temperature well below Boyle's temperature then the curve will show negative deviation, in low pressure region and positive deviation in the high pressure region. Near critical temperature the curve is more likely as CO2 and the temperature well above critical temperature curve is more like H2 at 0∘C as shown above.At high pressure suppose all the constant temperature curve varies linearly with pressure according to the following equation : Z=1+PbRT (R=2calmol−1K−1)
In very high pressure region if Z v/s P is plotted at 1200 K for the above gas then it will have greatest slope.
View Solution
