In a study of the cases of diabetes the following data was obtained.

Draw a less than ogive for above data .
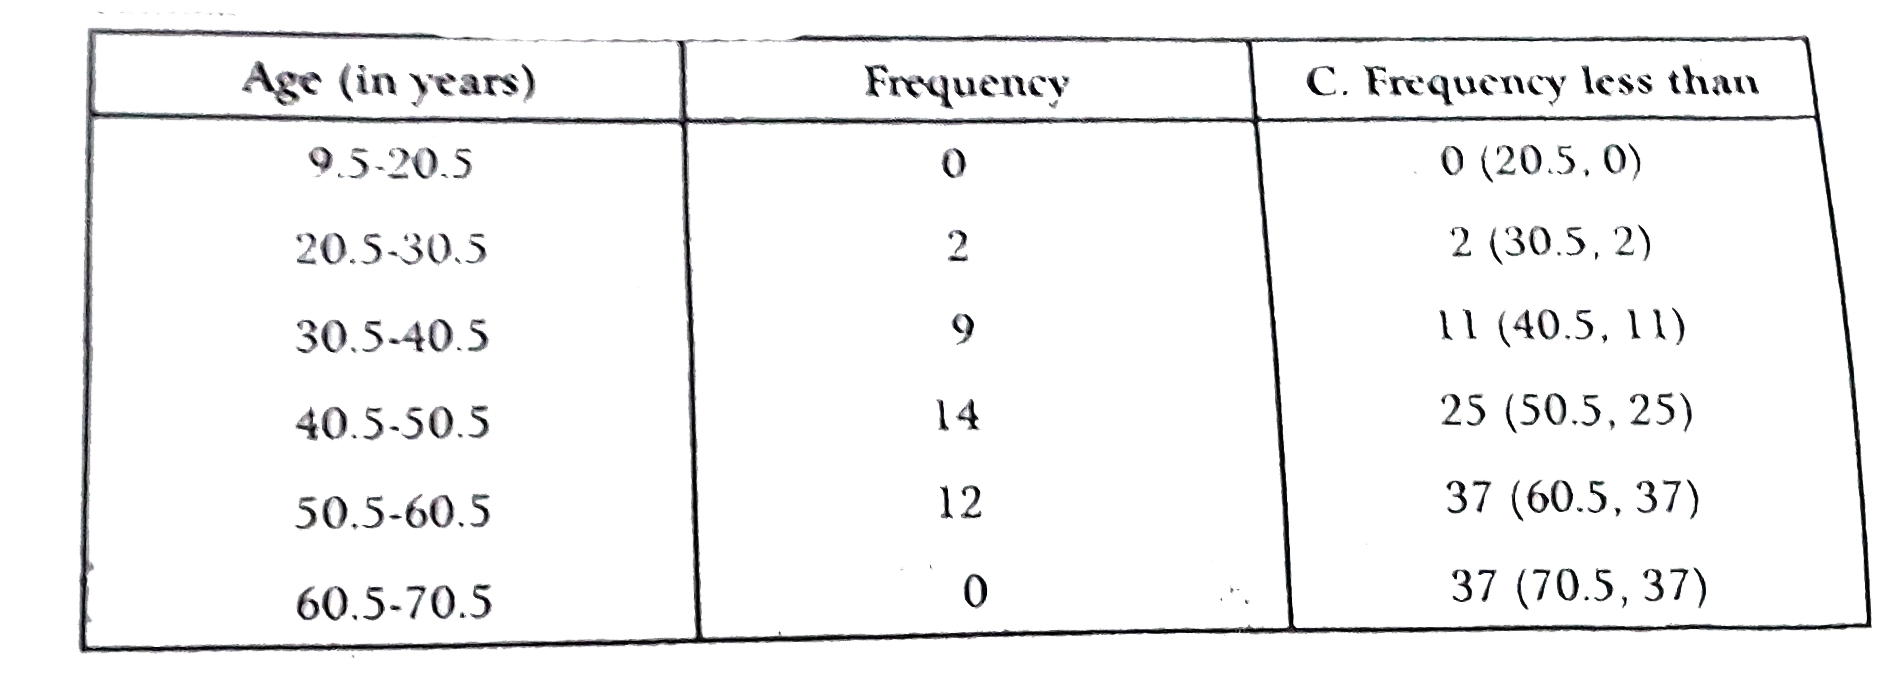
The given frequency distributions is discontinuous, to convert it into contiunuous distribution, we subtract 0.5 from lower limit and addd 0.5 to upper limit respectively. So, continuous comulative frequency distribution table is as below :
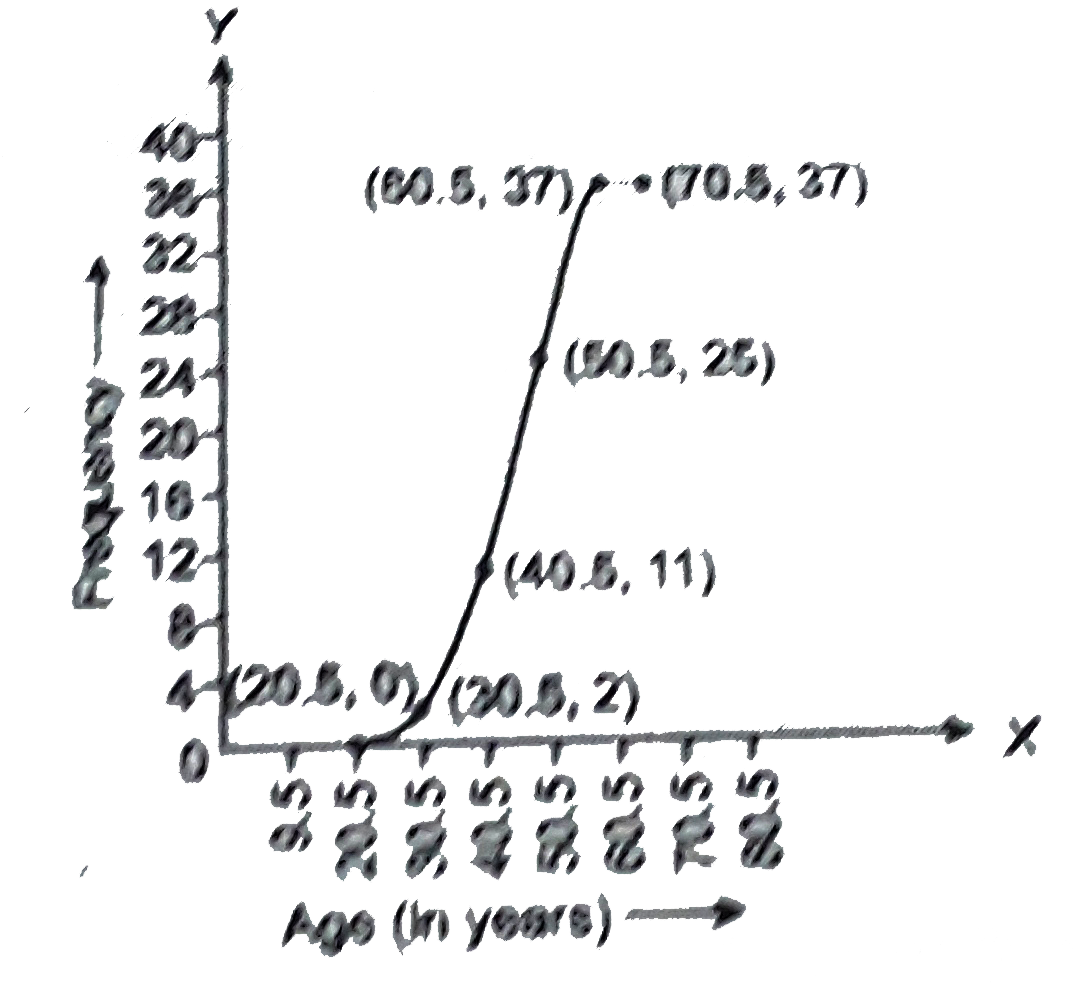
Required ogive is given below :
Topper's Solved these Questions
- STATISTICS BOOK - NAGEEN PRAKASHANCHAPTER - STATISTICS EXERCISE - Problems From NCERT/exemplar
4 Videos
- STATISTICS BOOK - NAGEEN PRAKASHANCHAPTER - STATISTICS EXERCISE - Exercise 14 A
17 Videos
- SOME APPLICATIONS OF TRIGONOMETRYBOOK - NAGEEN PRAKASHANCHAPTER - SOME APPLICATIONS OF TRIGONOMETRYEXERCISE - Long Answer Questions
5 Videos
- TRIANGLES BOOK - NAGEEN PRAKASHANCHAPTER - TRIANGLES EXERCISE - Revision Exercise Long Questions
4 Videos
Similar Questions
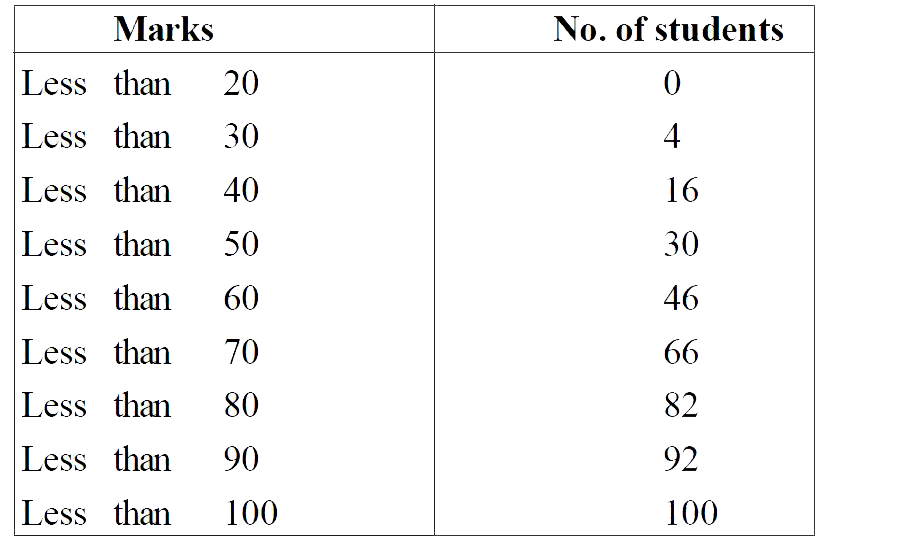
Draw a 'less than' ogive of the following data
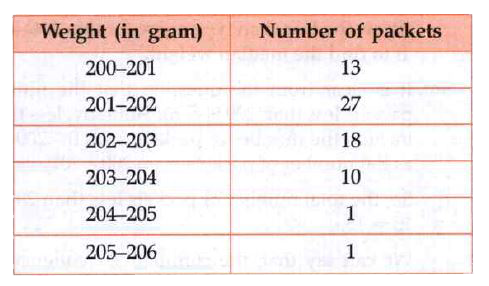
View SolutionThe weight of tea in 70 packets are shown in the following table
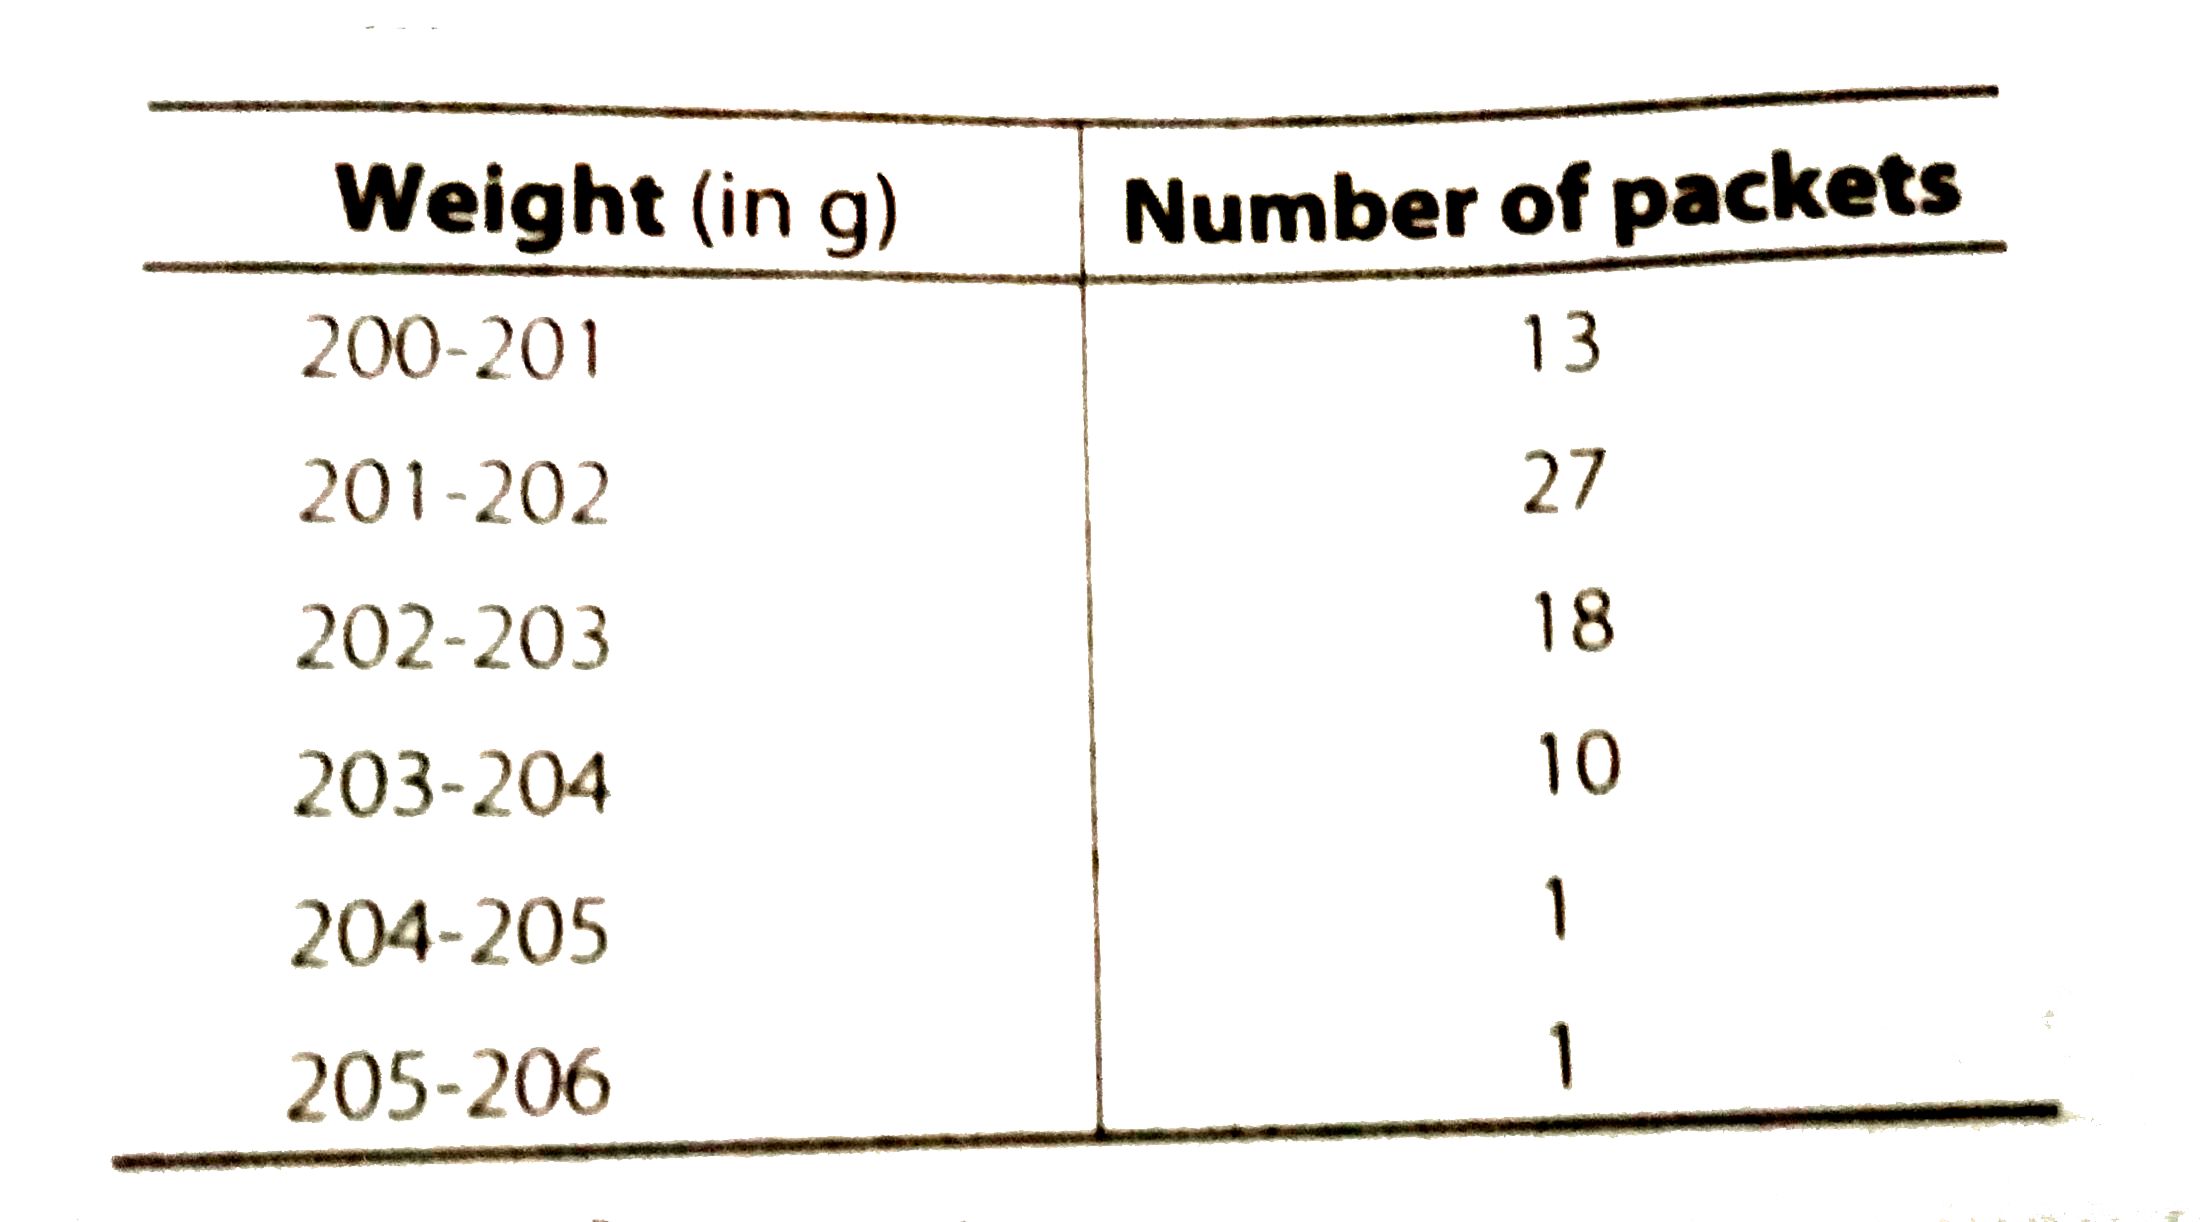
Find the mean weight of packets.
View SolutionDuring the medical check up of 35 students of a class, their weights were recorded as follows :
Draw a less then type ogive for the given data. Hence obtain the median weight from the graph and verify the result by using the formula.
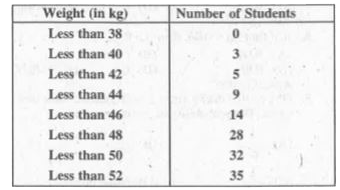
View SolutionDuring the medical check-up of 35 students of a class, their weights were recorded as follows:Draw a less than type ogive for the given data. Hence obtain the median weight from the graph and verify the result by using the formula.
View Solutionfor the following data, draw a less than ogive and hence find the median of the distribution.
View SolutionThe marks obtained by 200 students in an examination are given below. : Draw a less than ogive for the above distribution and use less than ogive to find median.
View SolutionThe weighs of tea in 70 packets are shown in the following table:
Draw the less than type and more than type ogives for the data and use them to find the median weight.
View SolutionFor the following data, draw a 'less than' ogive and hence find the median of the distribution.

View SolutionFor the following data, draw a 'less than' ogive and hence find the median of the distribution.

View SolutionThe annual profits earned by 30 shops of a shopping complex in a locality give rise to the following distribution:Draw both ogives for the data above. Hence obtain the median profit.
View Solution
