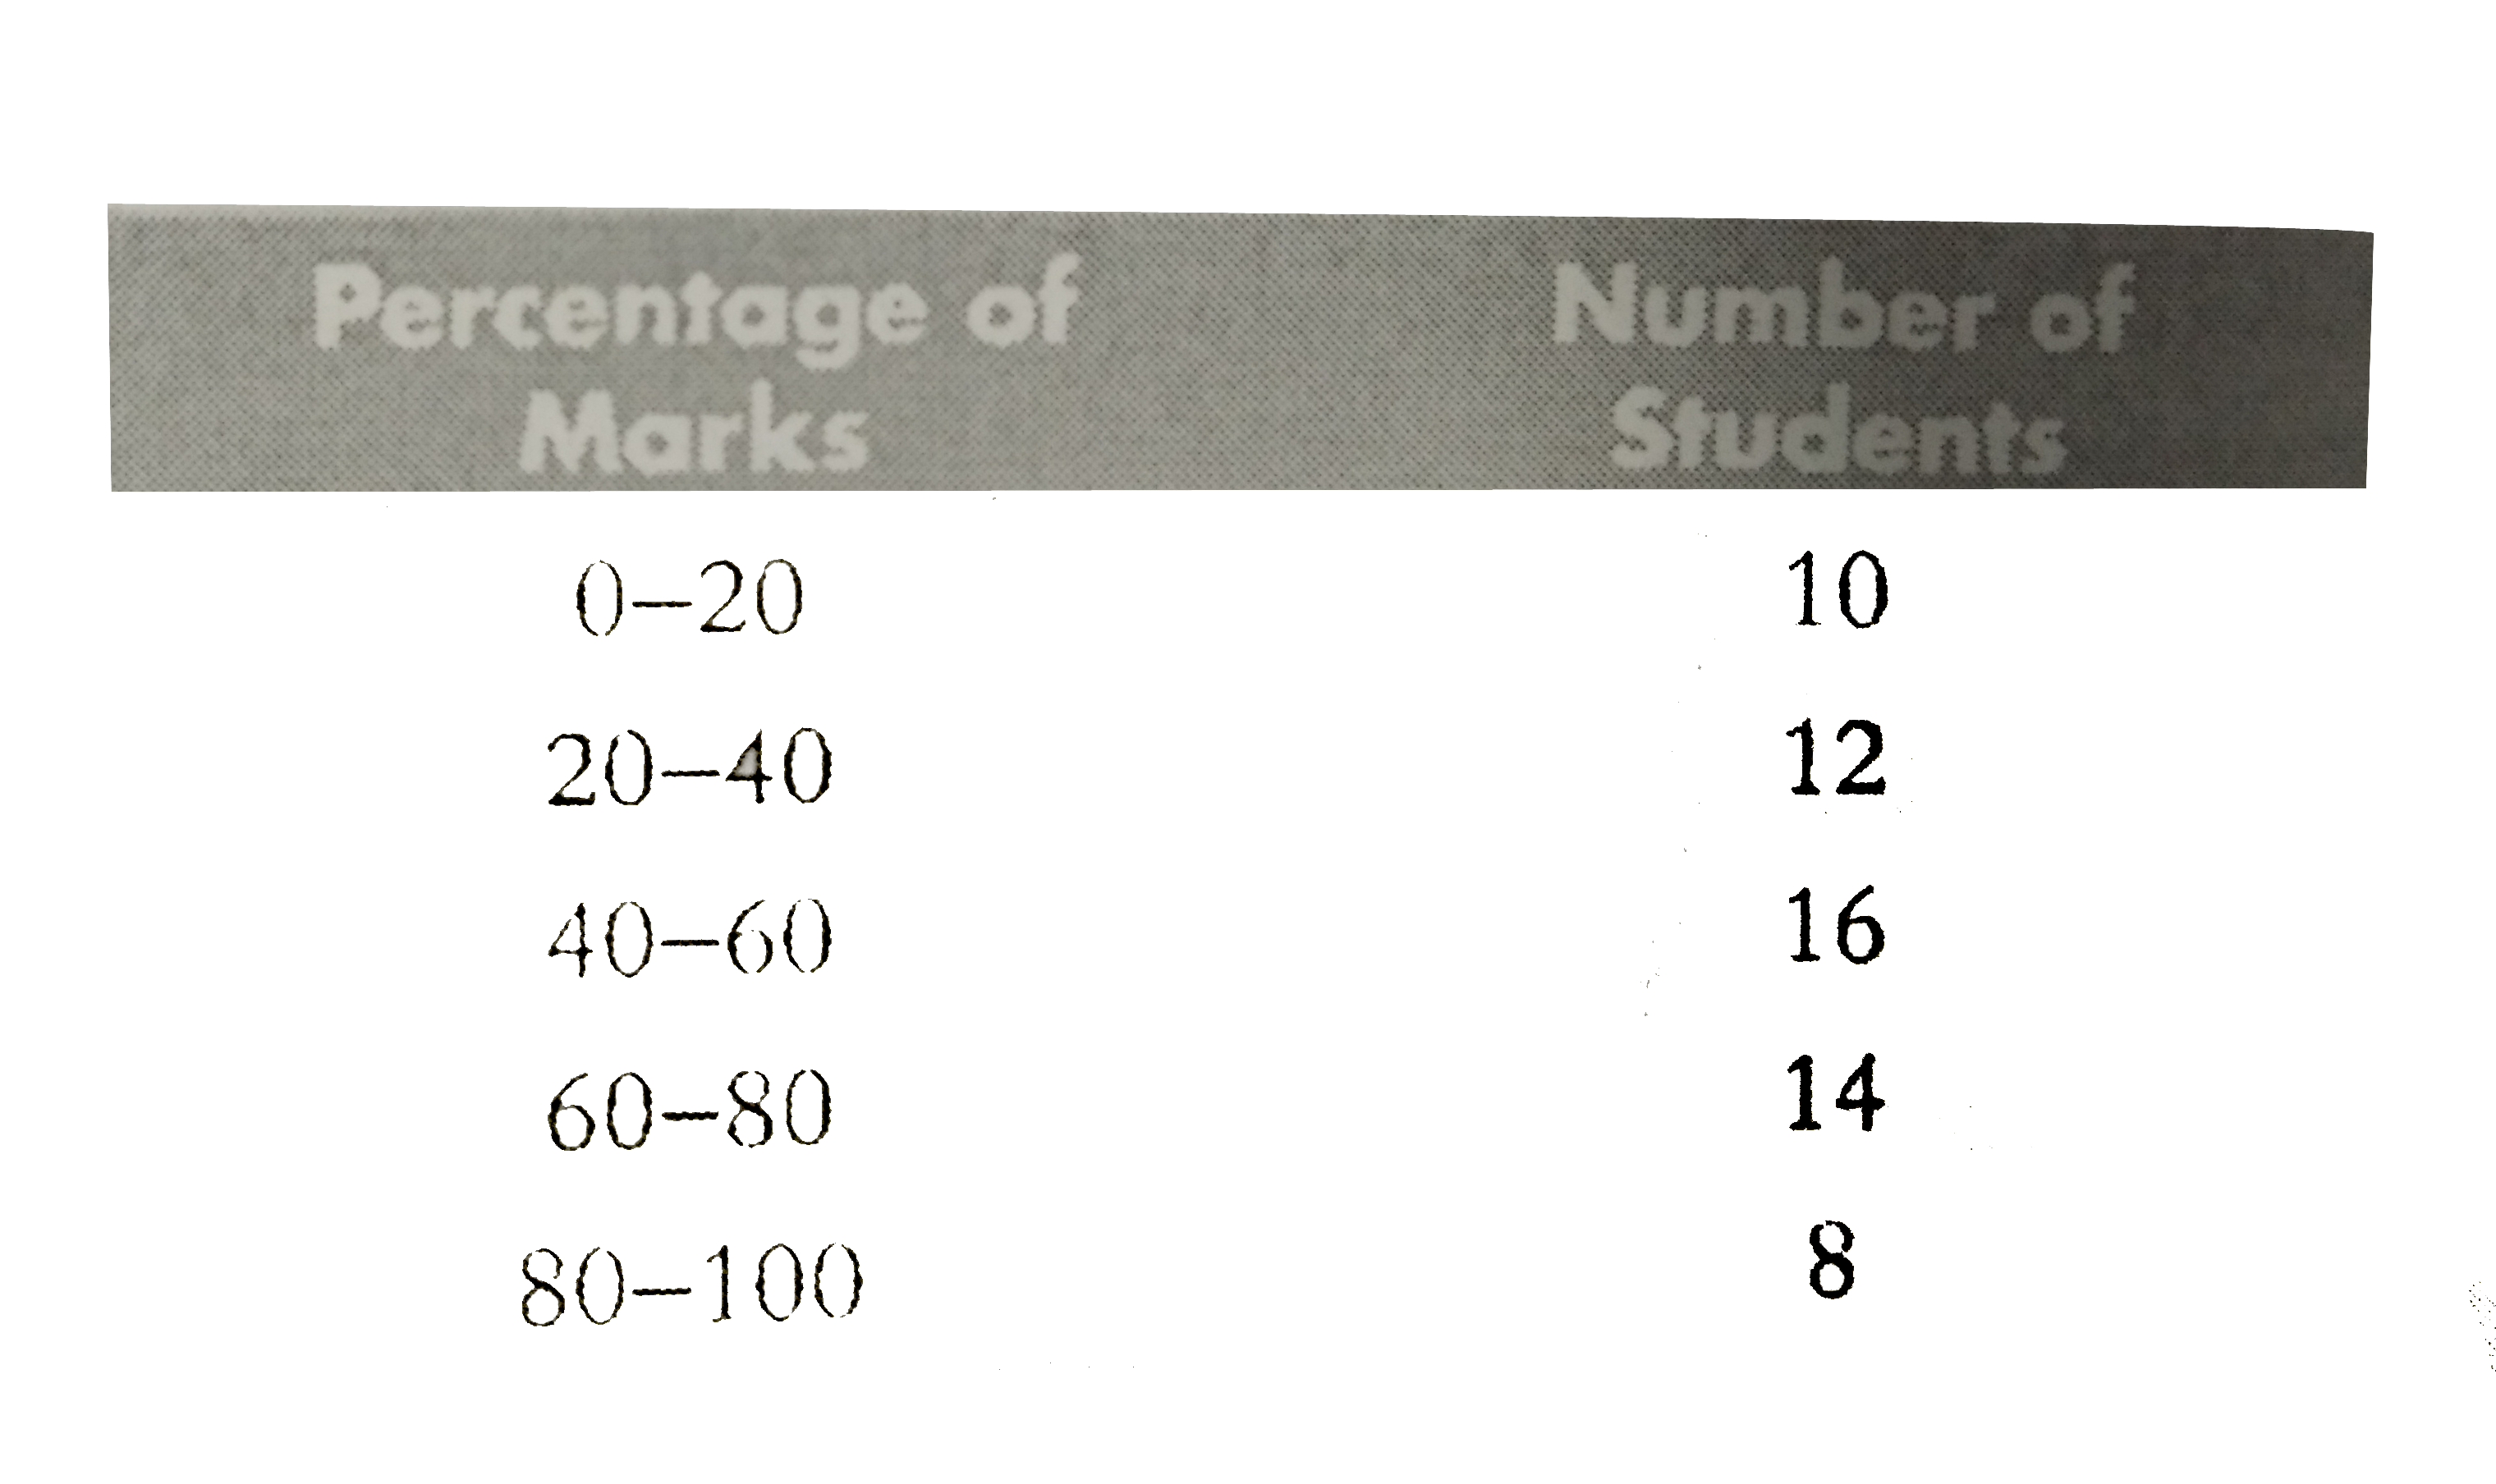
Draw a 'less than' ogive of the following data

Step by step video & image solution for Draw a 'less than' ogive of the following data by Maths experts to help you in doubts & scoring excellent marks in Class 10 exams.
Updated on:21/07/2023Topper's Solved these Questions
- STATISTICSBOOK - CBSE COMPLEMENTARY MATERIALCHAPTER - STATISTICSEXERCISE - Short Answer Type Question (II)
8 Videos
- STATISTICSBOOK - CBSE COMPLEMENTARY MATERIALCHAPTER - STATISTICSEXERCISE - Long Answer Type Questions
9 Videos
- STATISTICSBOOK - CBSE COMPLEMENTARY MATERIALCHAPTER - STATISTICSEXERCISE - Very Short Answer Types (I) Questions (Fill in the blank)
10 Videos
- SOME APPLICATIONS OF TRIGONOMETRYBOOK - CBSE COMPLEMENTARY MATERIALCHAPTER - SOME APPLICATIONS OF TRIGONOMETRYEXERCISE - PRACTICE-TEST (SECTION-D)
1 Videos
- SURFACE AREA AND VOLUME BOOK - CBSE COMPLEMENTARY MATERIALCHAPTER - SURFACE AREA AND VOLUME EXERCISE - PRACTICE TEST ( SECTION-D)
1 Videos
Similar Questions
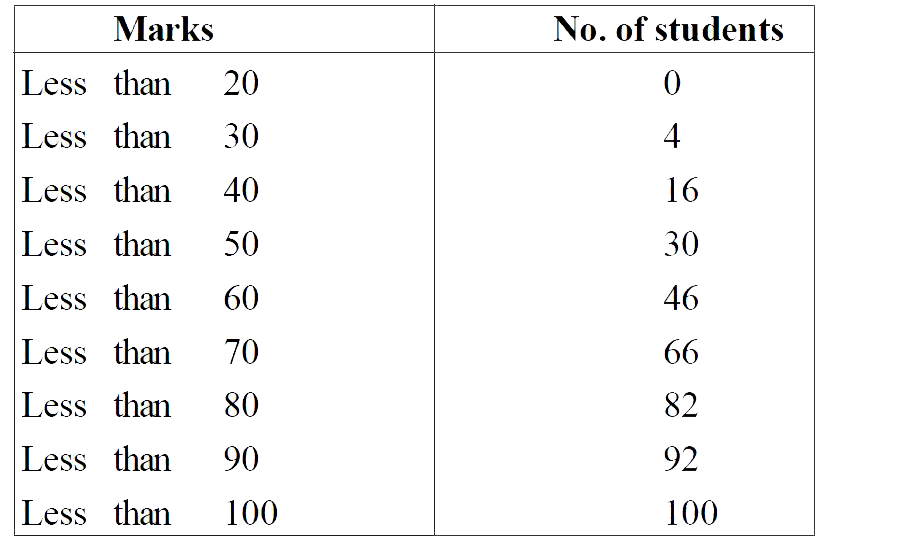
Draw a 'less than' ogive for the following frequency distribution:
View SolutionDraw 'less than' as well as 'more than' ogives for the following data :

View SolutionDraw a less than ogive for the following frequency distribution.
View SolutionConstruct a less than ogive and a more than ogive from the following data :

View SolutionDraw 'less than' and 'more than' ogive curves from the following data :

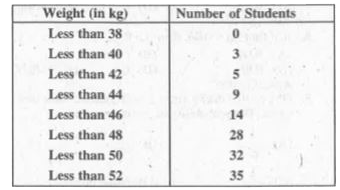
View SolutionDuring the medical check-up of 35 students of a class, their weights were recorded as follows:Draw a less than type ogive for the given data. Hence obtain the median weight from the graph and verify the result by using the formula.
View SolutionDuring the medical check up of 35 students of a class, their weights were recorded as follows :
Draw a less then type ogive for the given data. Hence obtain the median weight from the graph and verify the result by using the formula.

View SolutionDraw an ogive by less than method for the following data: No. of rooms: 1 2 3 4 5 6 7 8 9 10 No. of houses: 4 9 22 28 24 12 8 6 5 2
View SolutionDraw a histogram of the following data on a graph paper and estimate the mode .

View SolutionFor the following data, draw a 'less than' ogive and hence find the median of the distribution.

View Solution
