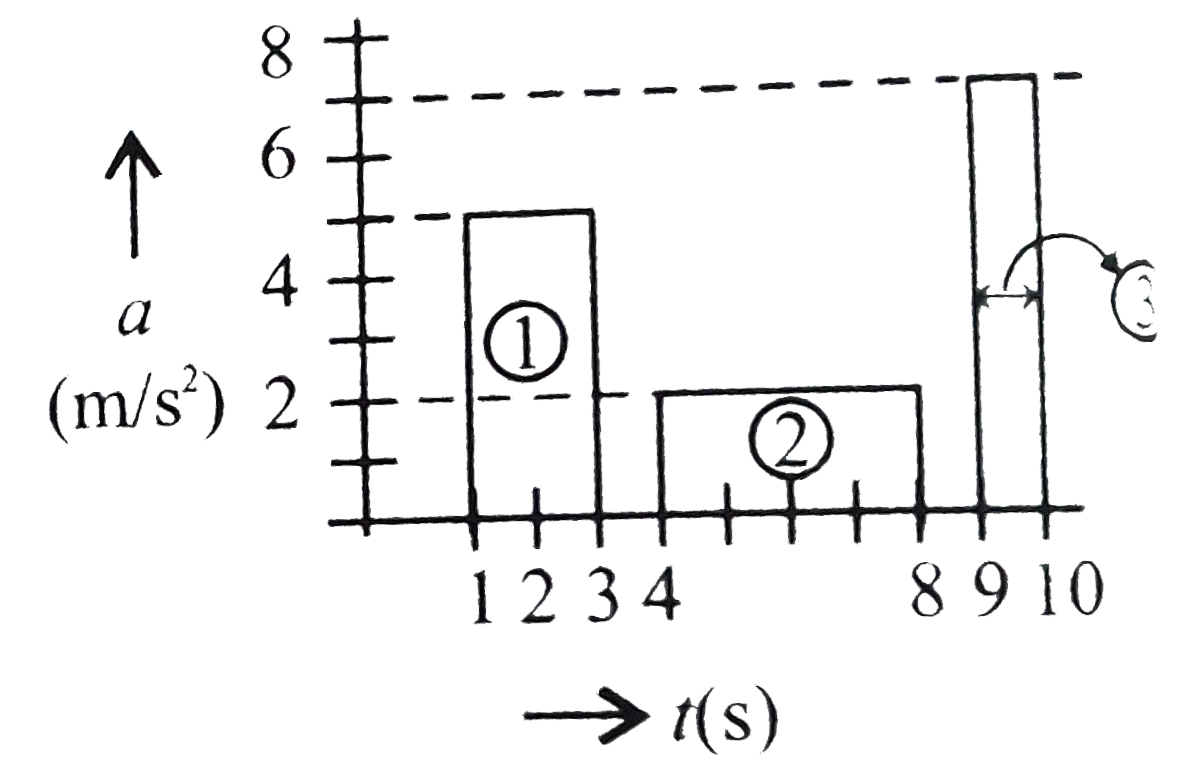
The figure shows a particle moving along x - axis subjected to three particles of acceleration (a). Rank the periods according to the increase they produce in the particle velocity, greatest first.
A

B

C

D

Video Solution
Text Solution
The correct Answer is:D
Area of acceleration-time graph gives velocity. Area of region gives velocity of particles ms−1
v1=2s×5ms2=10ms−1
Similarly, v2=4s×(2)m/s2=8m/s
and v3=1s×7m/s2 = 7m/s
∴v1>v2>v3
|
Updated on:21/07/2023
Topper's Solved these Questions
- BOOK - NCERT FINGERTIPSCHAPTER - MOTION IN A STRAIGHT LINEEXERCISE - Kinematic Equations For Uniformly Accelerated Motion32videos
MOTION IN A STRAIGHT LINE
- BOOK - NCERT FINGERTIPSCHAPTER - MOTION IN A STRAIGHT LINEEXERCISE - Relative Velocity18videos
MOTION IN A STRAIGHT LINE
- BOOK - NCERT FINGERTIPSCHAPTER - MOTION IN A STRAIGHT LINEEXERCISE - Instantaneous Velocity And Speed16videos
MOTION IN A STRAIGHT LINE
- BOOK - NCERT FINGERTIPSCHAPTER - MOTION IN A PLANE EXERCISE - Assertion And Reason15videos
MOTION IN A PLANE
- BOOK - NCERT FINGERTIPSCHAPTER - OSCILLATIONS EXERCISE - Assertion And Reason15videos
OSCILLATIONS
Similar Questions
Knowledge Check
- Question 1 - Select One
For a particle moving along x−axis, speed must be increasing for the following graph :
A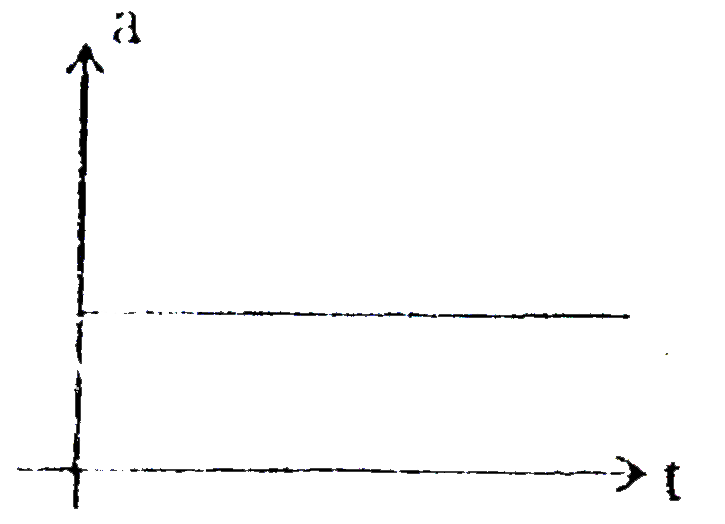 B
B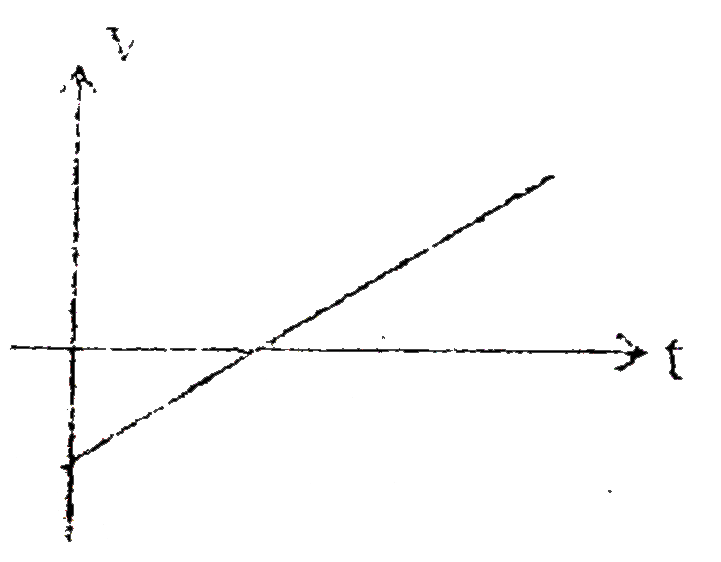 C
C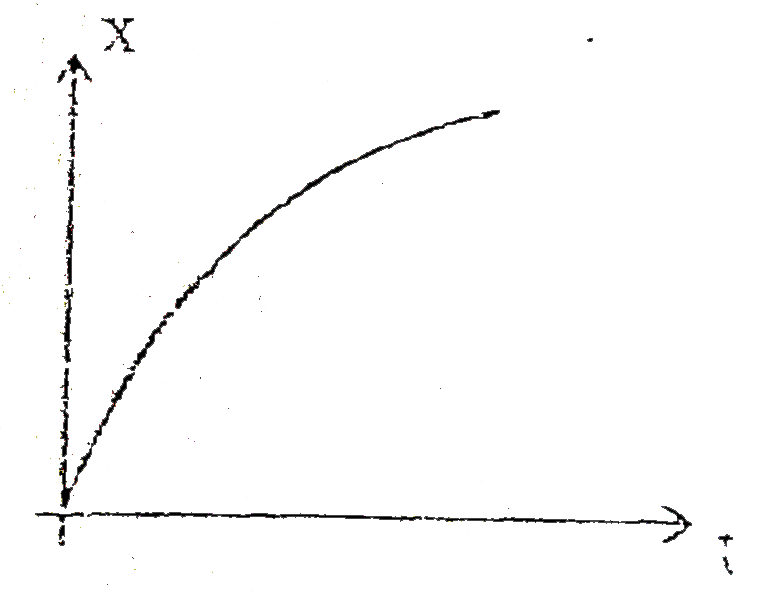 D
D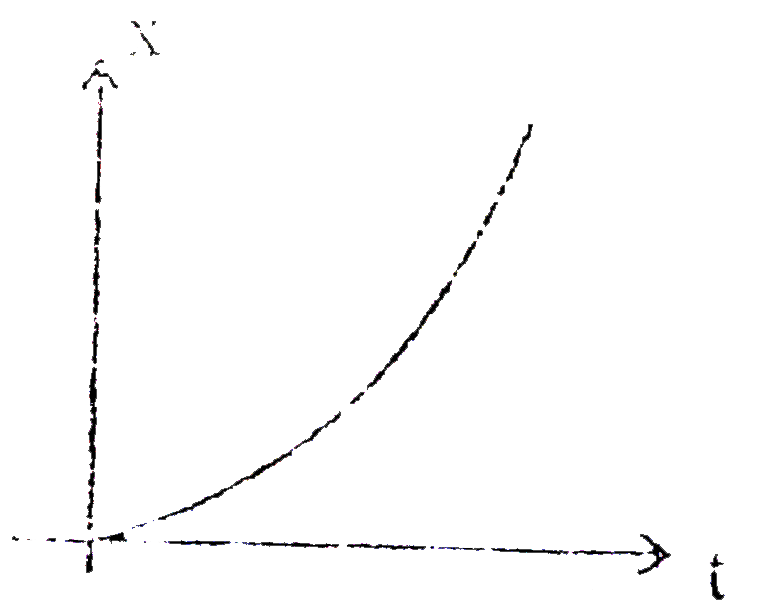
- Question 2 - Select One
The figure shows four arrangement of three particles of equal masses. Rank the arrangement according to the magnitude of the net gravitational force on the particle m, greatest first.
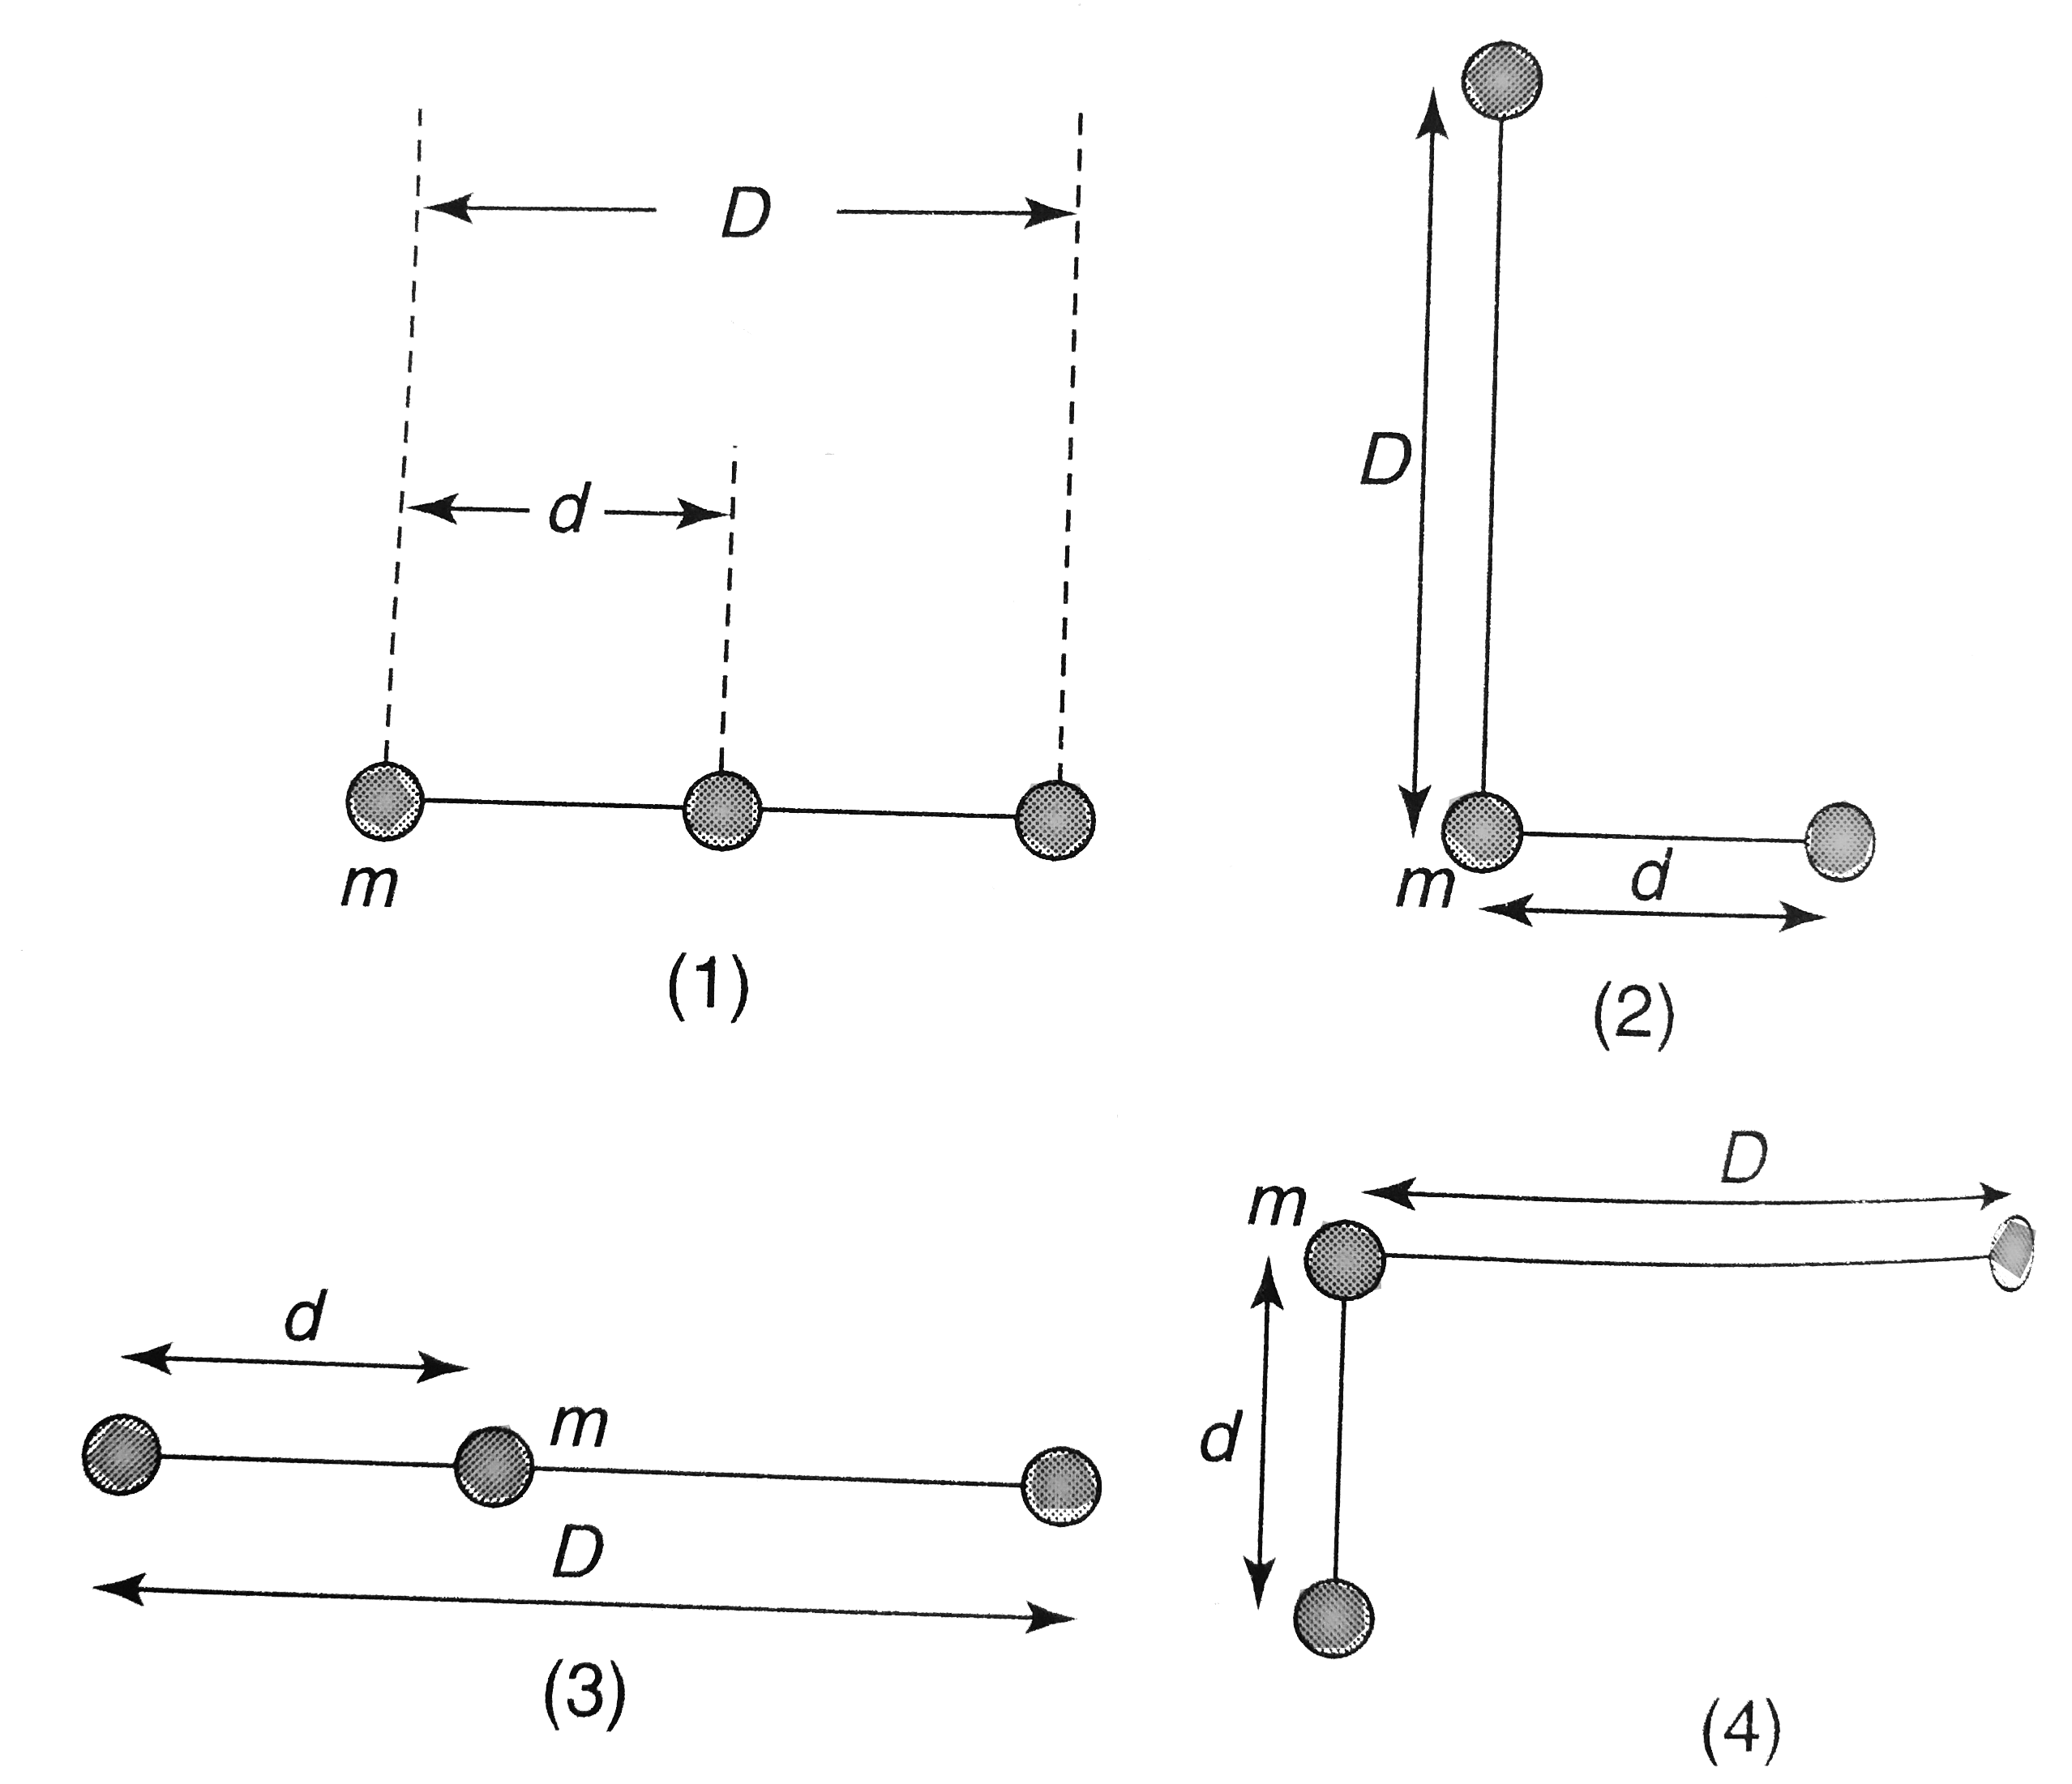 A1, tie of 2 and 4, then 3B1,4,3,2C2,3,4,1D4,3,1,2
 - Question 3 - Select One
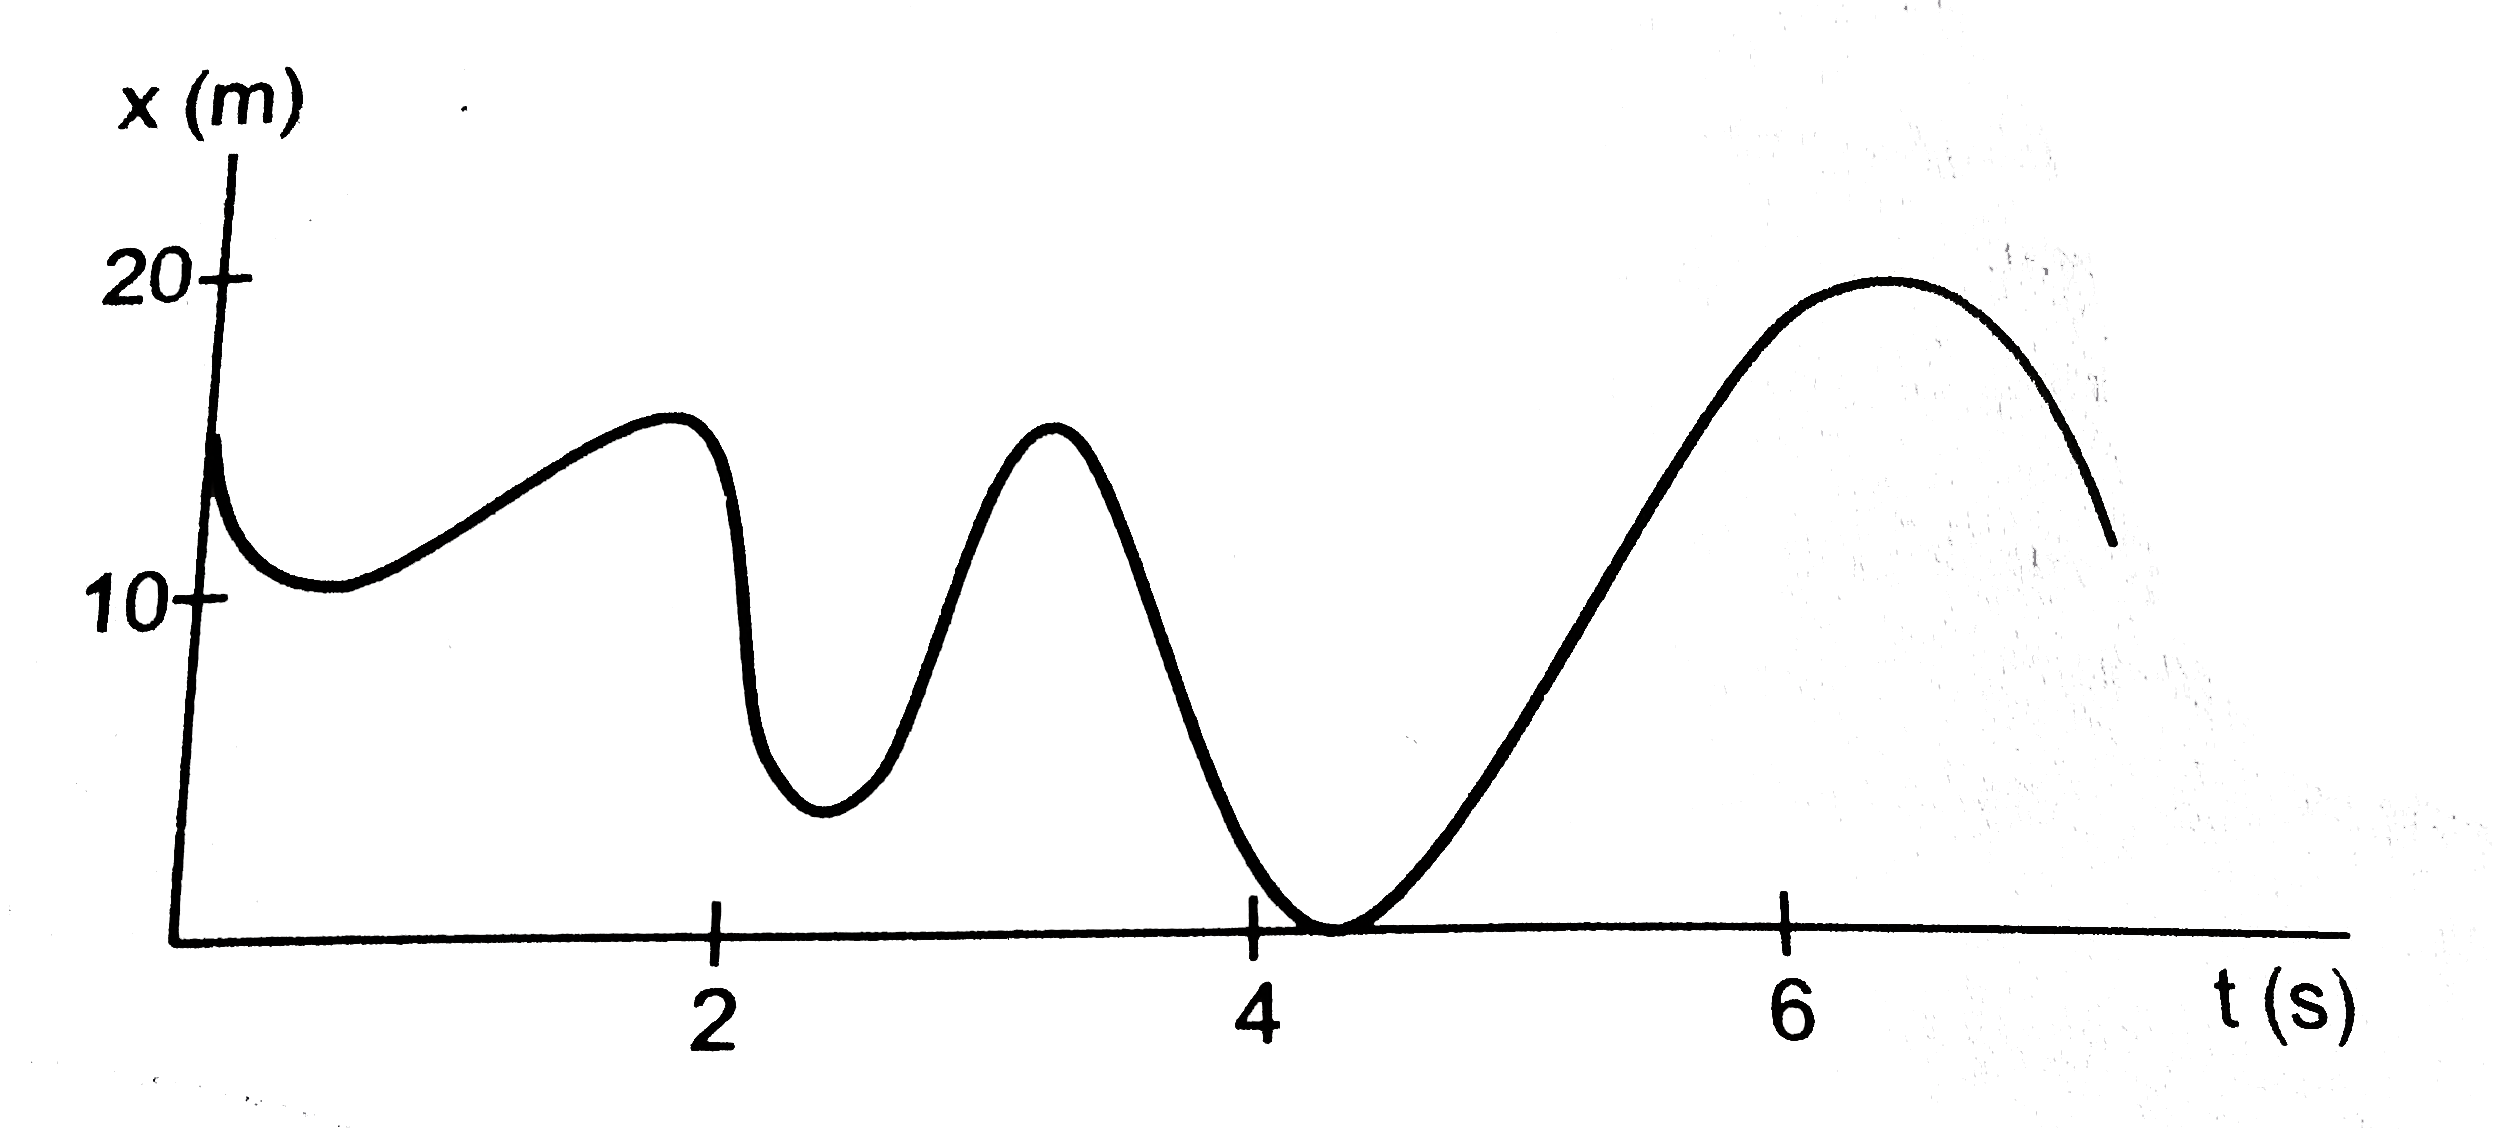
Figure shows the position of a particle moving on the x - axis as a function of time
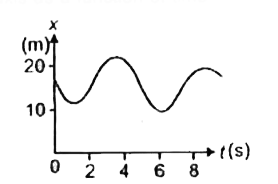 AThe particle has come to rest 4 timesBThe velocity at t = 8 s is negativeCThe velocity remains positive for t = 2 s to t = 6 sDThe particle moves with constant velocity.
Figure shows the position of a particle moving on the X-axis as a function of time.
 View Solution
The speed of a particle moving in a circle is increasing. The dot product of its acceleration and velocity is
View SolutionFigure shows the displacement of a particle going along the X-axis as a function of time. The force acting on the particle is zero in the region
 View Solution
A particle move along y-axis according to equation y+3+4cosωt. The motion of the particle is
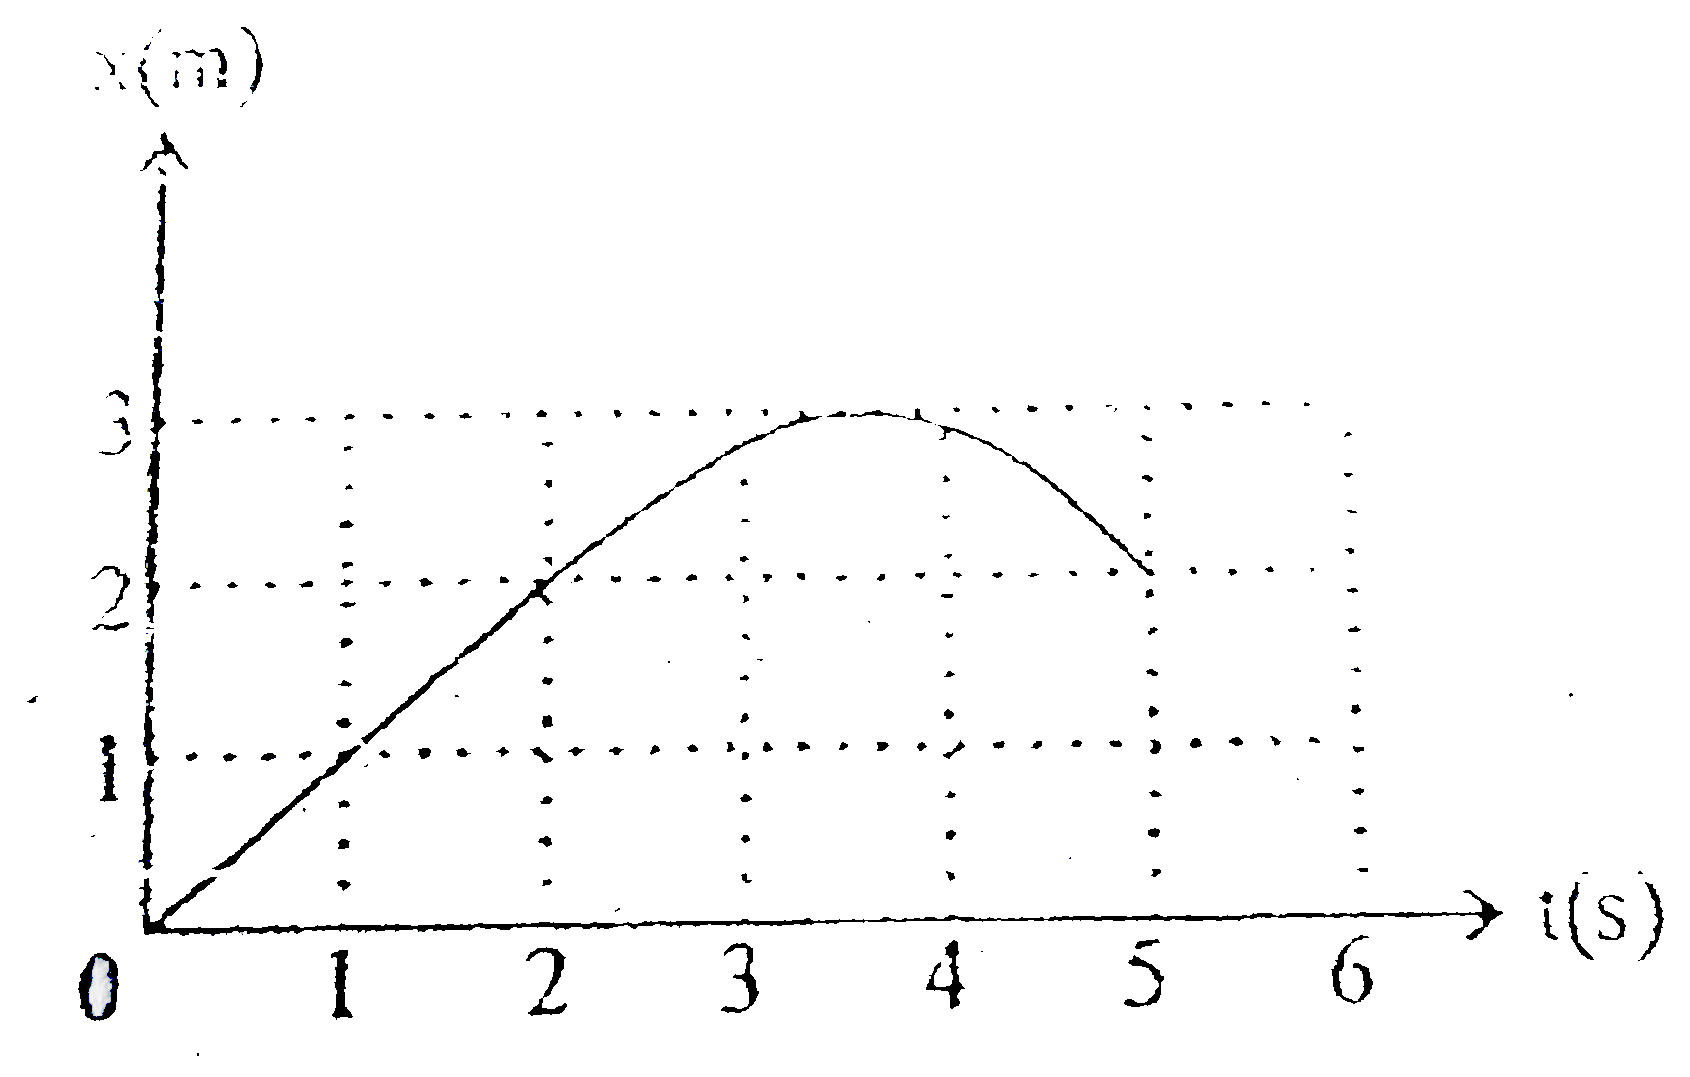
View SolutionA particle moved along the X−axis according to the graph shown in Figure. Choose the incorrct options.
 View Solution


