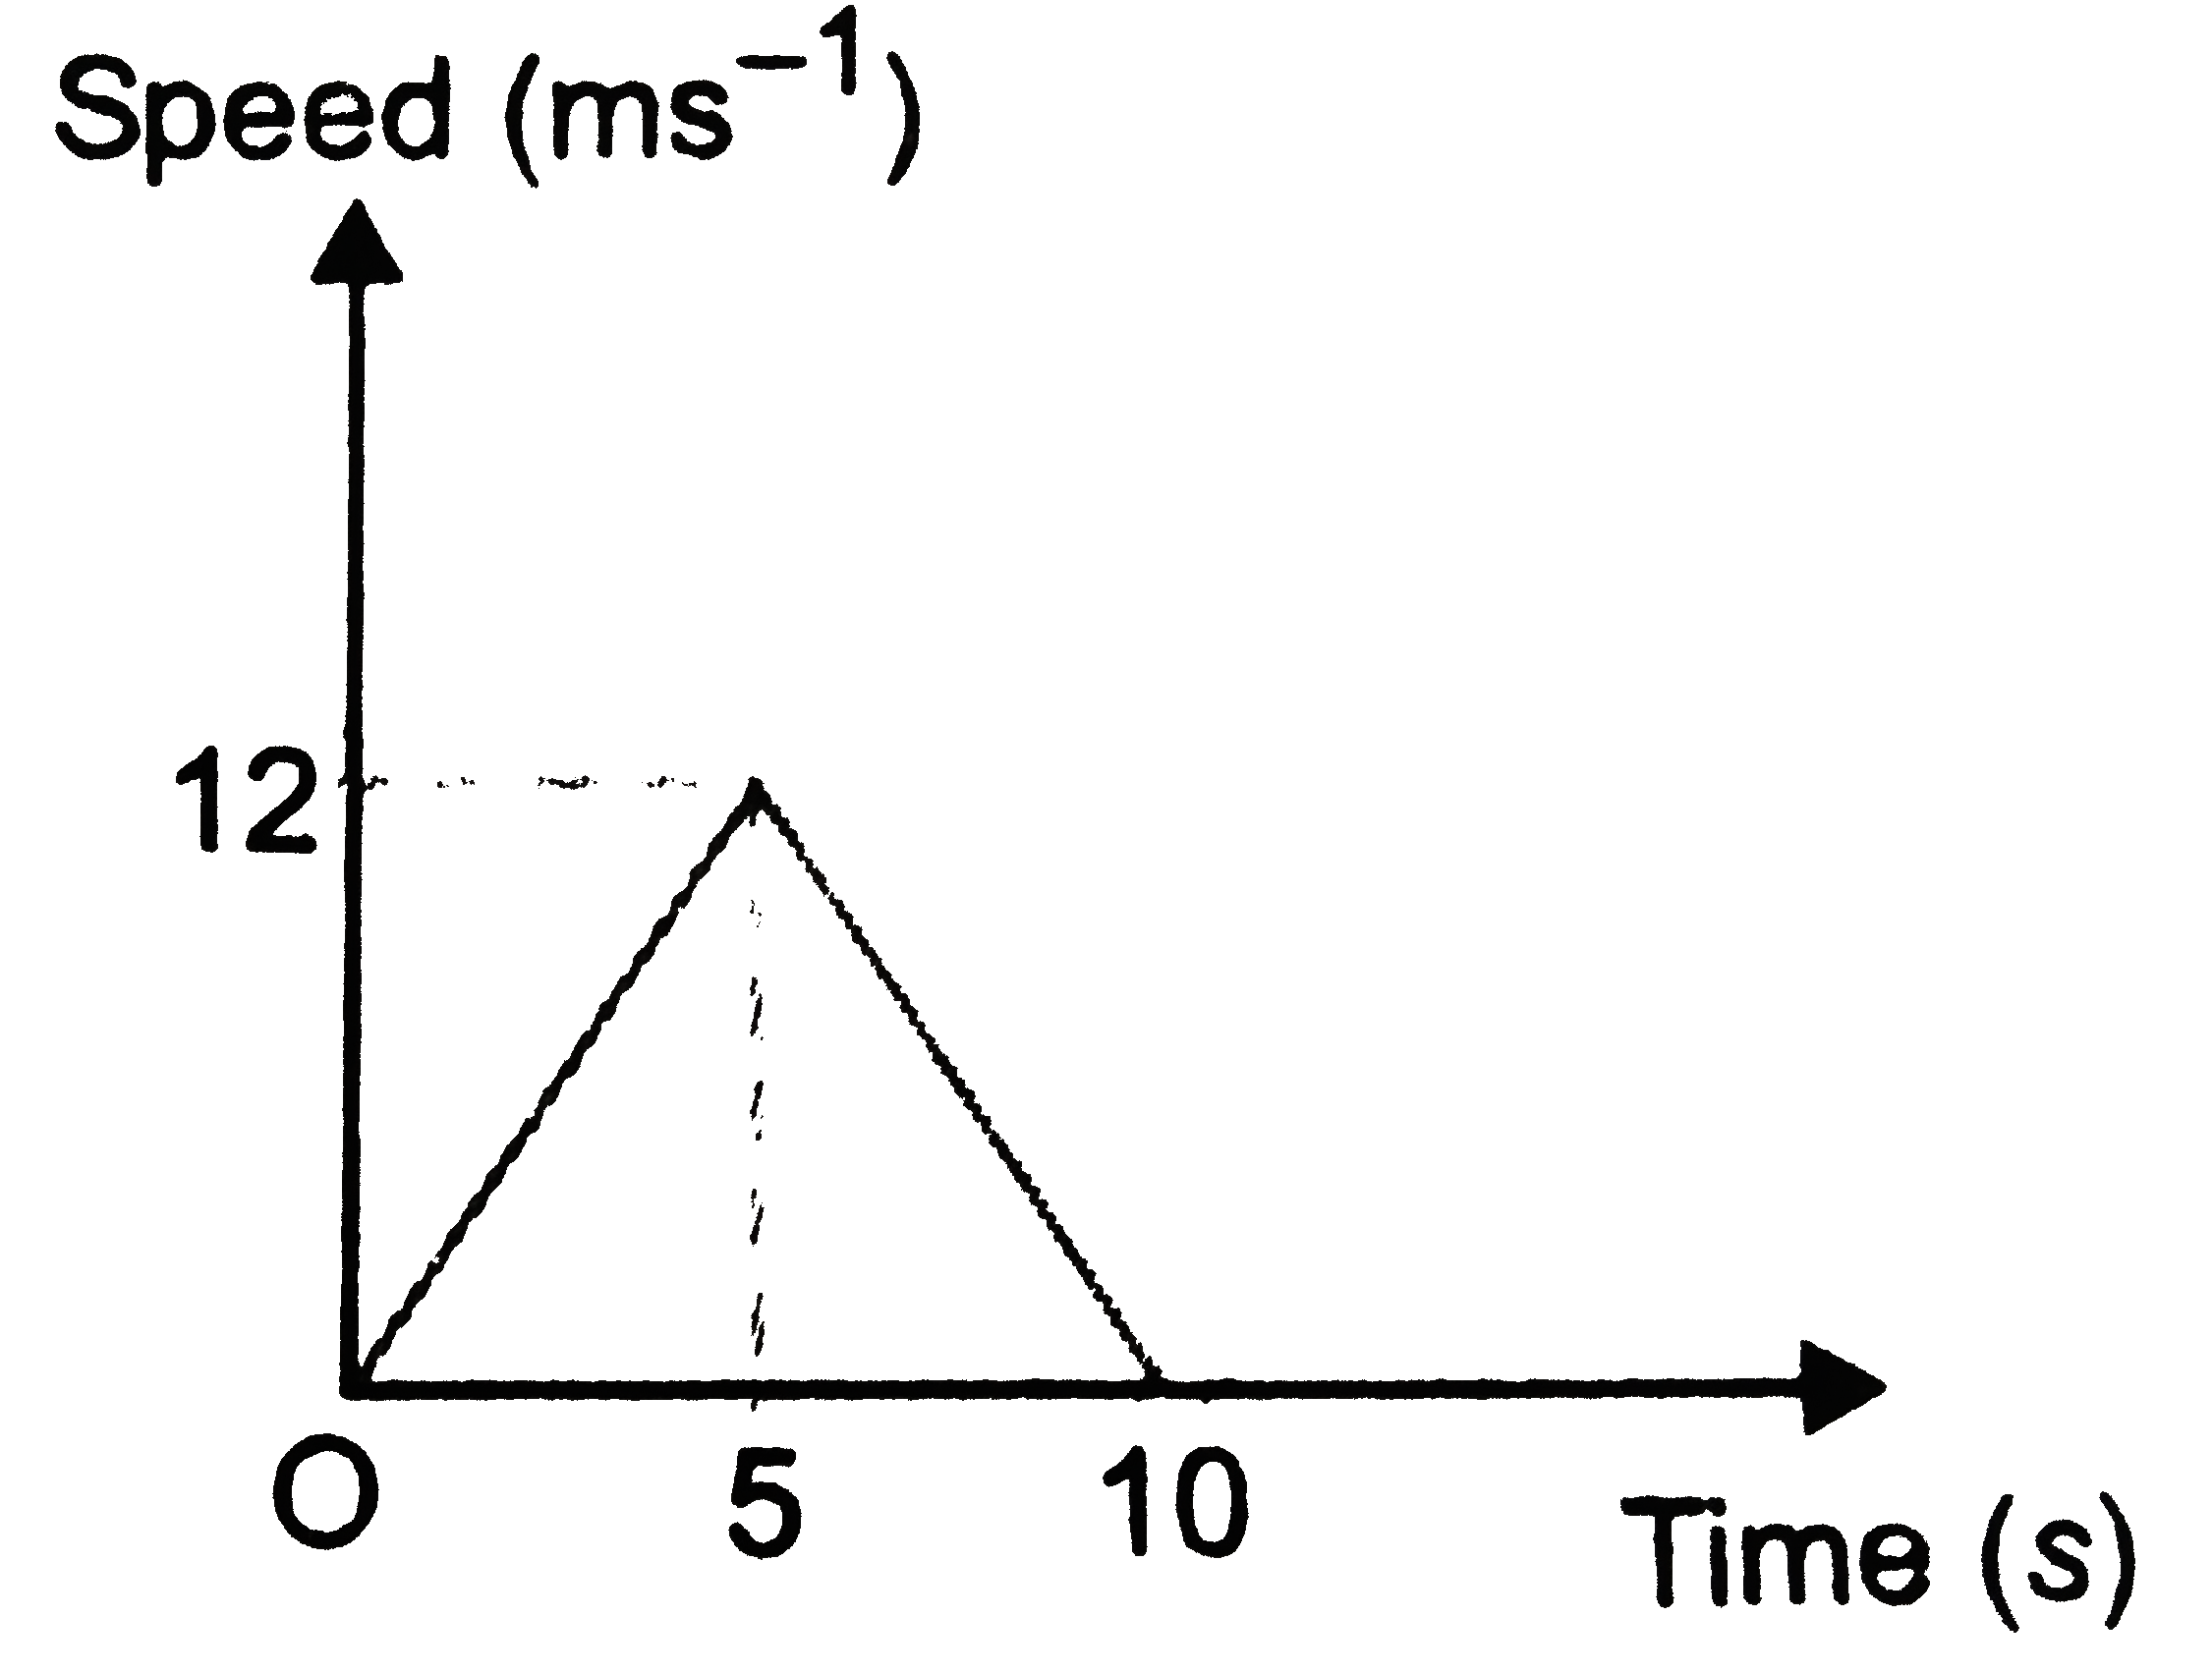
The speed-time graph of a particle moving along a fixed direction is shown in the Fig. (CF) . 15. The distance traversed by the particle between t=2s and 6s is .
 .
.
26 m
36 m
46 m
56 m
The correct Answer is:B
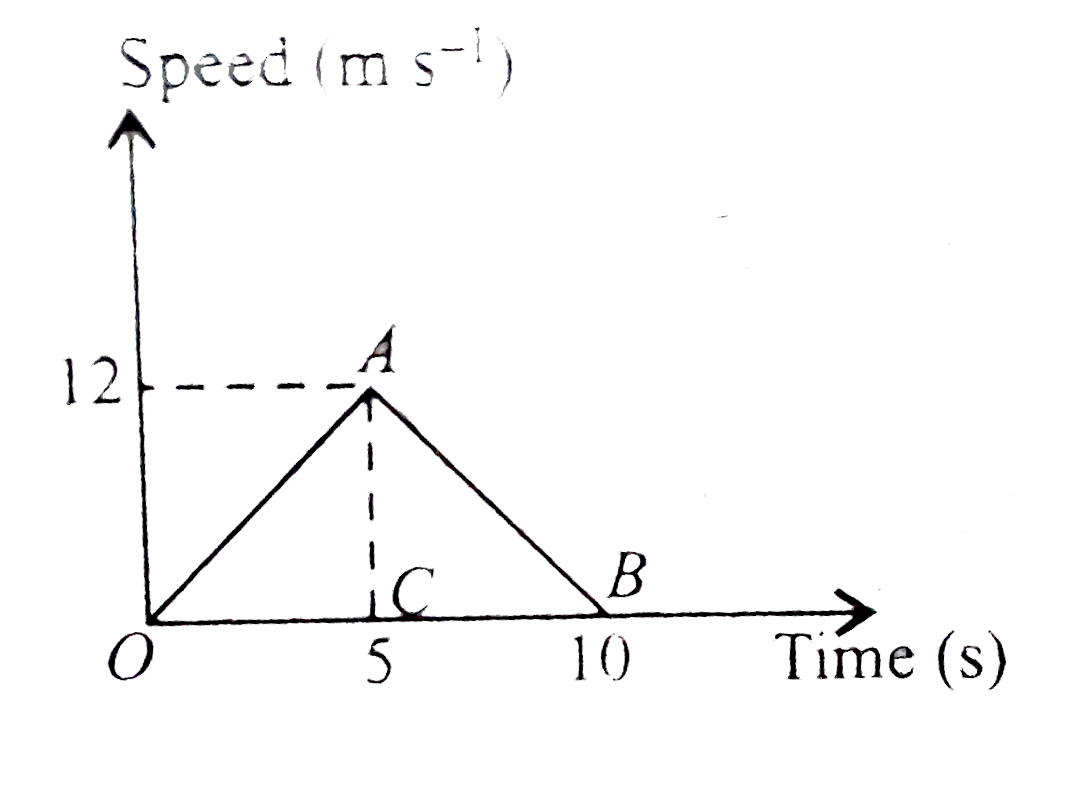
Let S1 be the distance travelled by particle in time 2 to 5 s and S2 be the distance travelled by particle in time 5 to 6 s.
Time distance travelled,
S=S1+S2.
During the time interval 9 to 5 s, the acceleration of particle is equal to the slope of line OA
i.e. a=125=2.4ms−2
Velocity at the end of 2 s will be,
v=0+2.4×2=4.8ms−1
Taking motion of particle for time interval 2 s to 5 s,
Here, u=4.8ms−1,a=2.4ms−2,S=S1,t=5−2=3s
Then, S1=4.8×3+12×2.4×32 = 25.2 m
Acceleration of the particle during the motion t = 5 s to t = 10 s is
a = Slope of line AB=−125=−2.4ms−2
Taking motion of the particle for the time 1 s (i.e 5 s to 6 s), Here, u = 12ms−2,t=1s,S=S2
∴ S2=12×1+12(−2.4)×12 = 10.8 m
∴ S = S1+S2=25.2+10.8=36m
Topper's Solved these Questions
- MOTION IN A STRAIGHT LINEBook:NCERT FINGERTIPSChapter:MOTION IN A STRAIGHT LINEExercise:Kinematic Equations For Uniformly Accelerated Motion
Explore 32 Videos
- MOTION IN A STRAIGHT LINEBook:NCERT FINGERTIPSChapter:MOTION IN A STRAIGHT LINEExercise:Relative Velocity
Explore 18 Videos
- MOTION IN A STRAIGHT LINEBook:NCERT FINGERTIPSChapter:MOTION IN A STRAIGHT LINEExercise:Instantaneous Velocity And Speed
Explore 16 Videos
- MOTION IN A PLANE Book:NCERT FINGERTIPSChapter:MOTION IN A PLANE Exercise:Assertion And Reason
Explore 15 Videos
- OSCILLATIONS Book:NCERT FINGERTIPSChapter:OSCILLATIONS Exercise:Assertion And Reason
Explore 15 Videos
Similar Questions
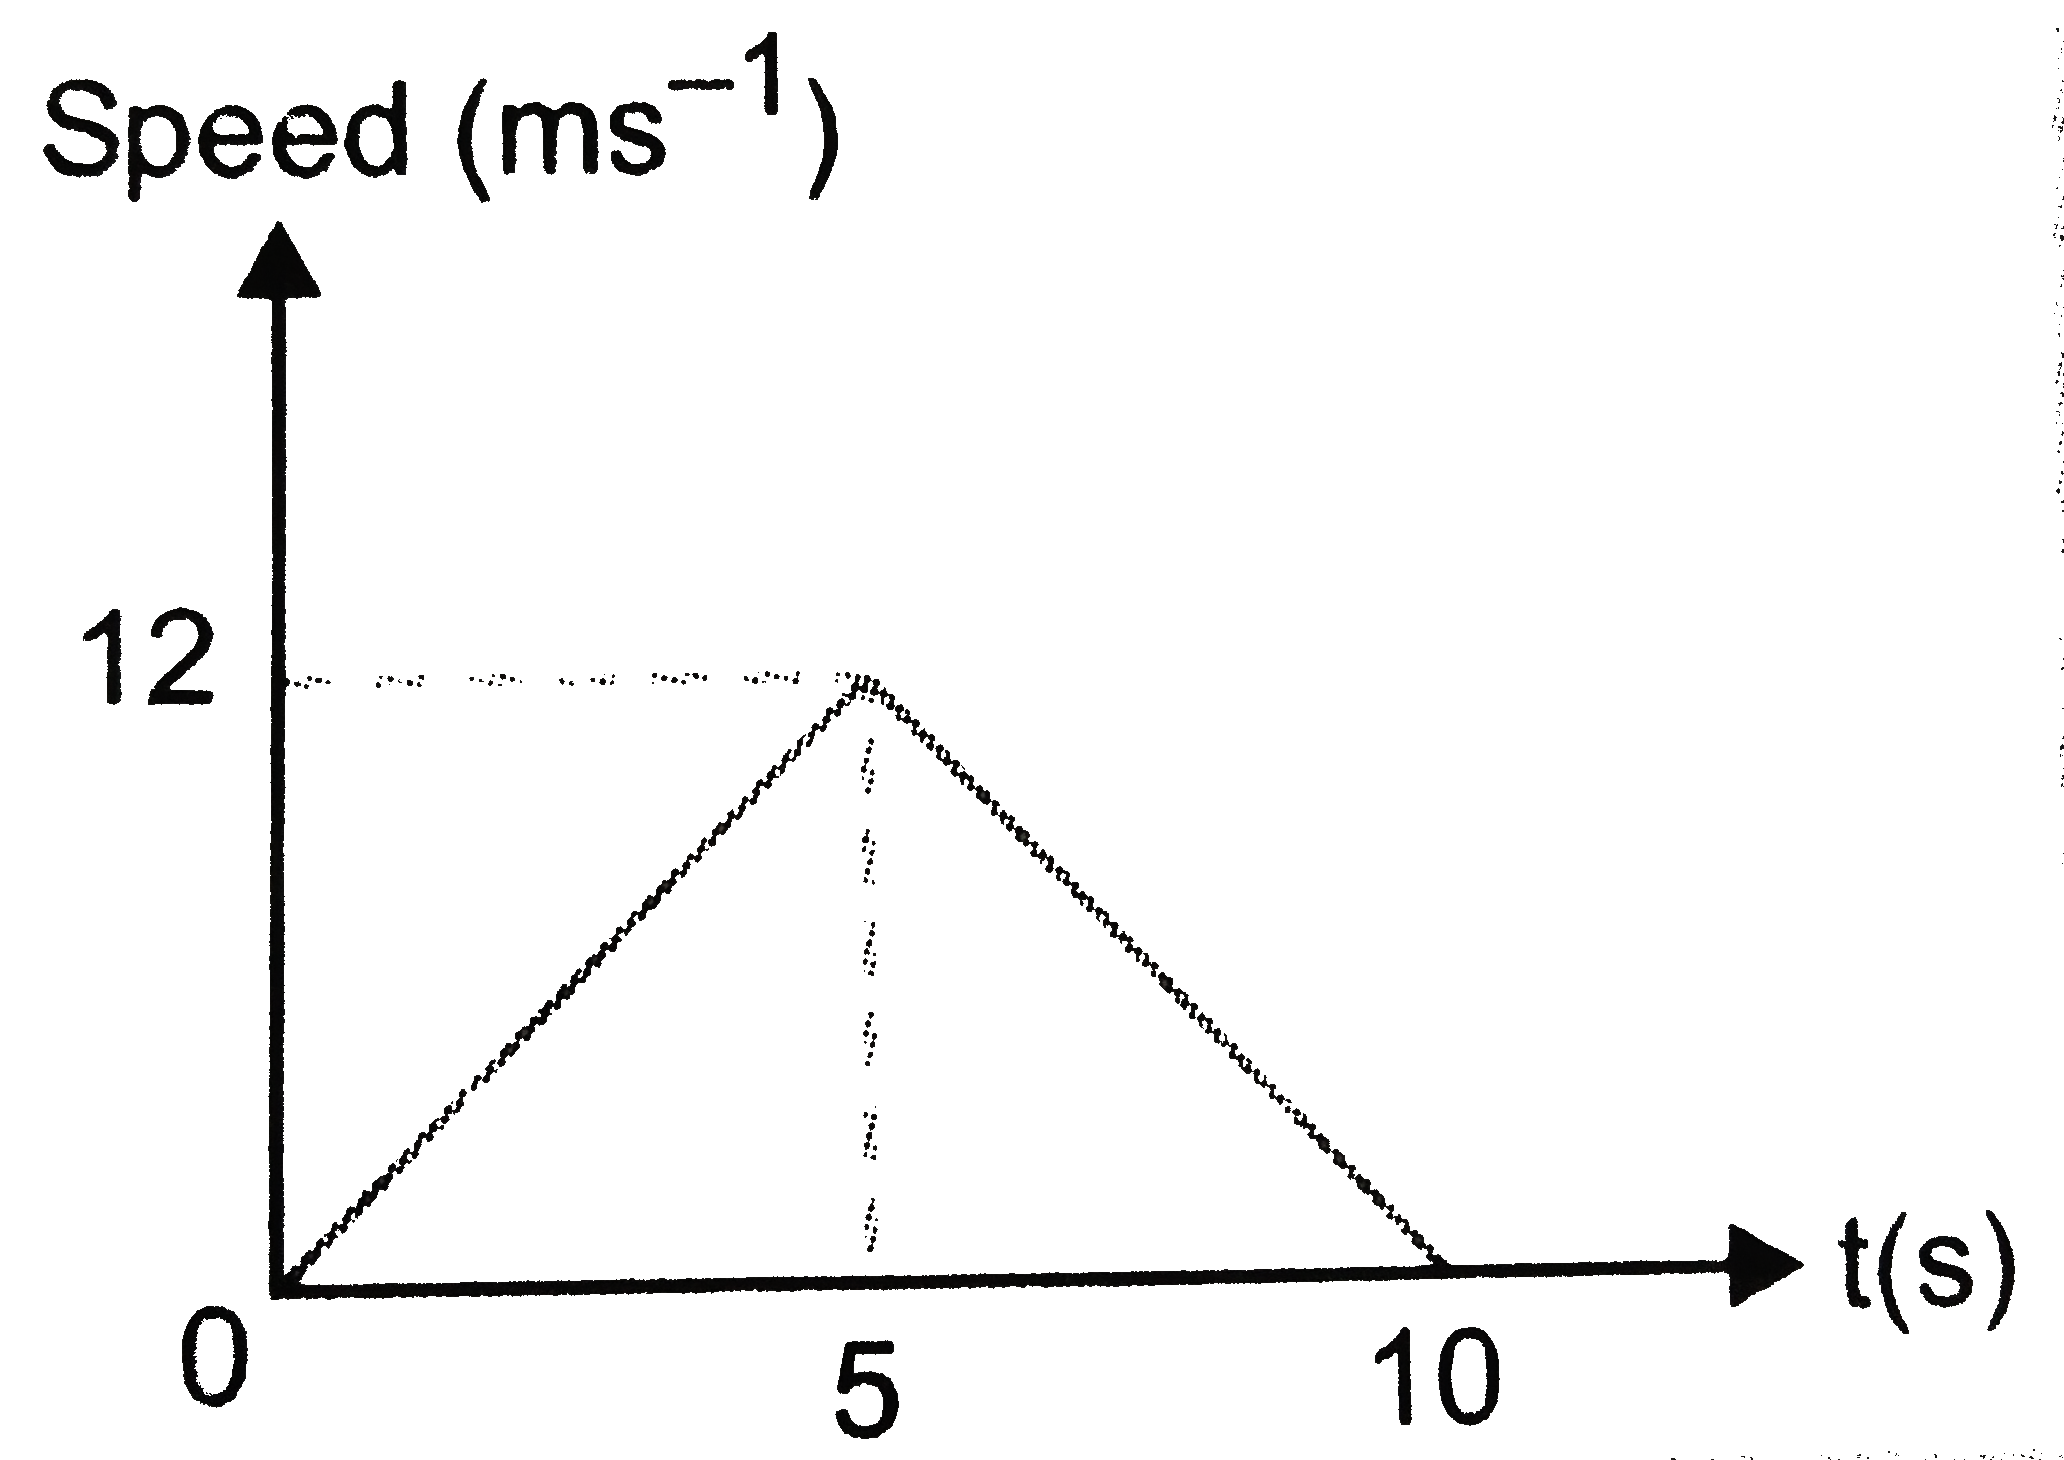
The speed -time graph of a particle moving along a fixed direction id shown ifn Fig. 2 (b) . 31. Fid (i) distance travelled by the particle between 0sec to 10sec (ii) average speed between thid interval (iii) the time when the speed was minimum (iv) the time when the speed was maximum.
 .
.
View SolutionThe speed-time graph of a particle moving along a fixed direction is shown in figure. Obtain the distance traversed by the particle between (a)t=0s to 10s(b)t=2s to 6s
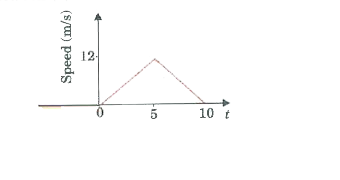
What is the average speed of the particle over the intervals in a and b?
View Solution
Knowledge Check
The speed-time graph of a particle moving along a fixed direction is shown in the Fig. 2 (CF) . 15. The distance traversed by the particle between t=2s 6s is .
 .A26mB36mC46mD56m
The speed-time graph of a particle moving along a fixed direction as shown in the figure. The distance travelled by the particle between t = 0 s to t = 10 s is
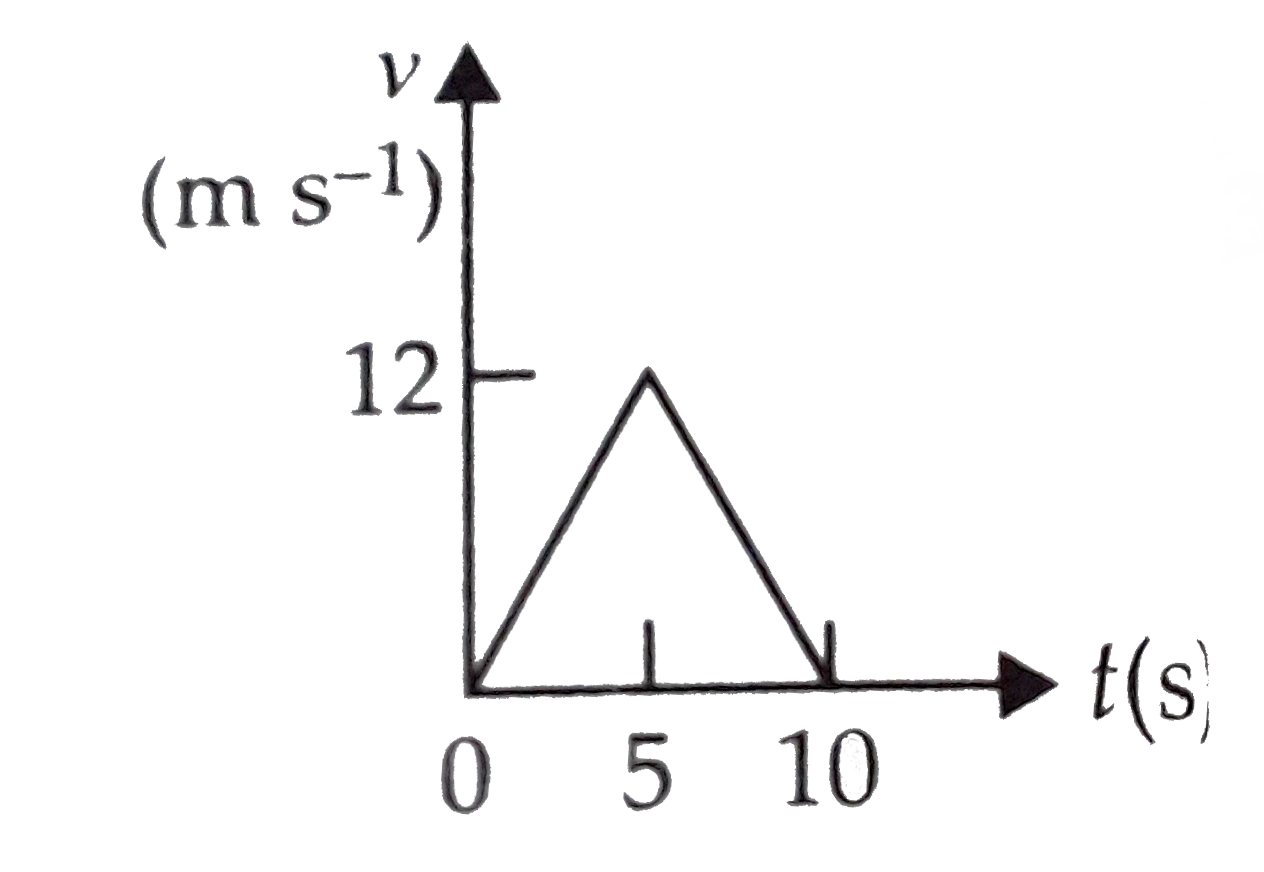 A20 mB40 mC60 mD80 m
The speed - time graph of a particle moving along a solid curve is shown below. The distance traversed by the particle from t = 0 to t = 3 is
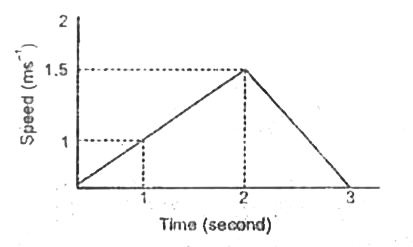 A92mB94mC103mD105m
The velocity-time graph of a particle moving in a staight line is shown in the . Find the displacement and the distance trav elled by the particle in 6s.
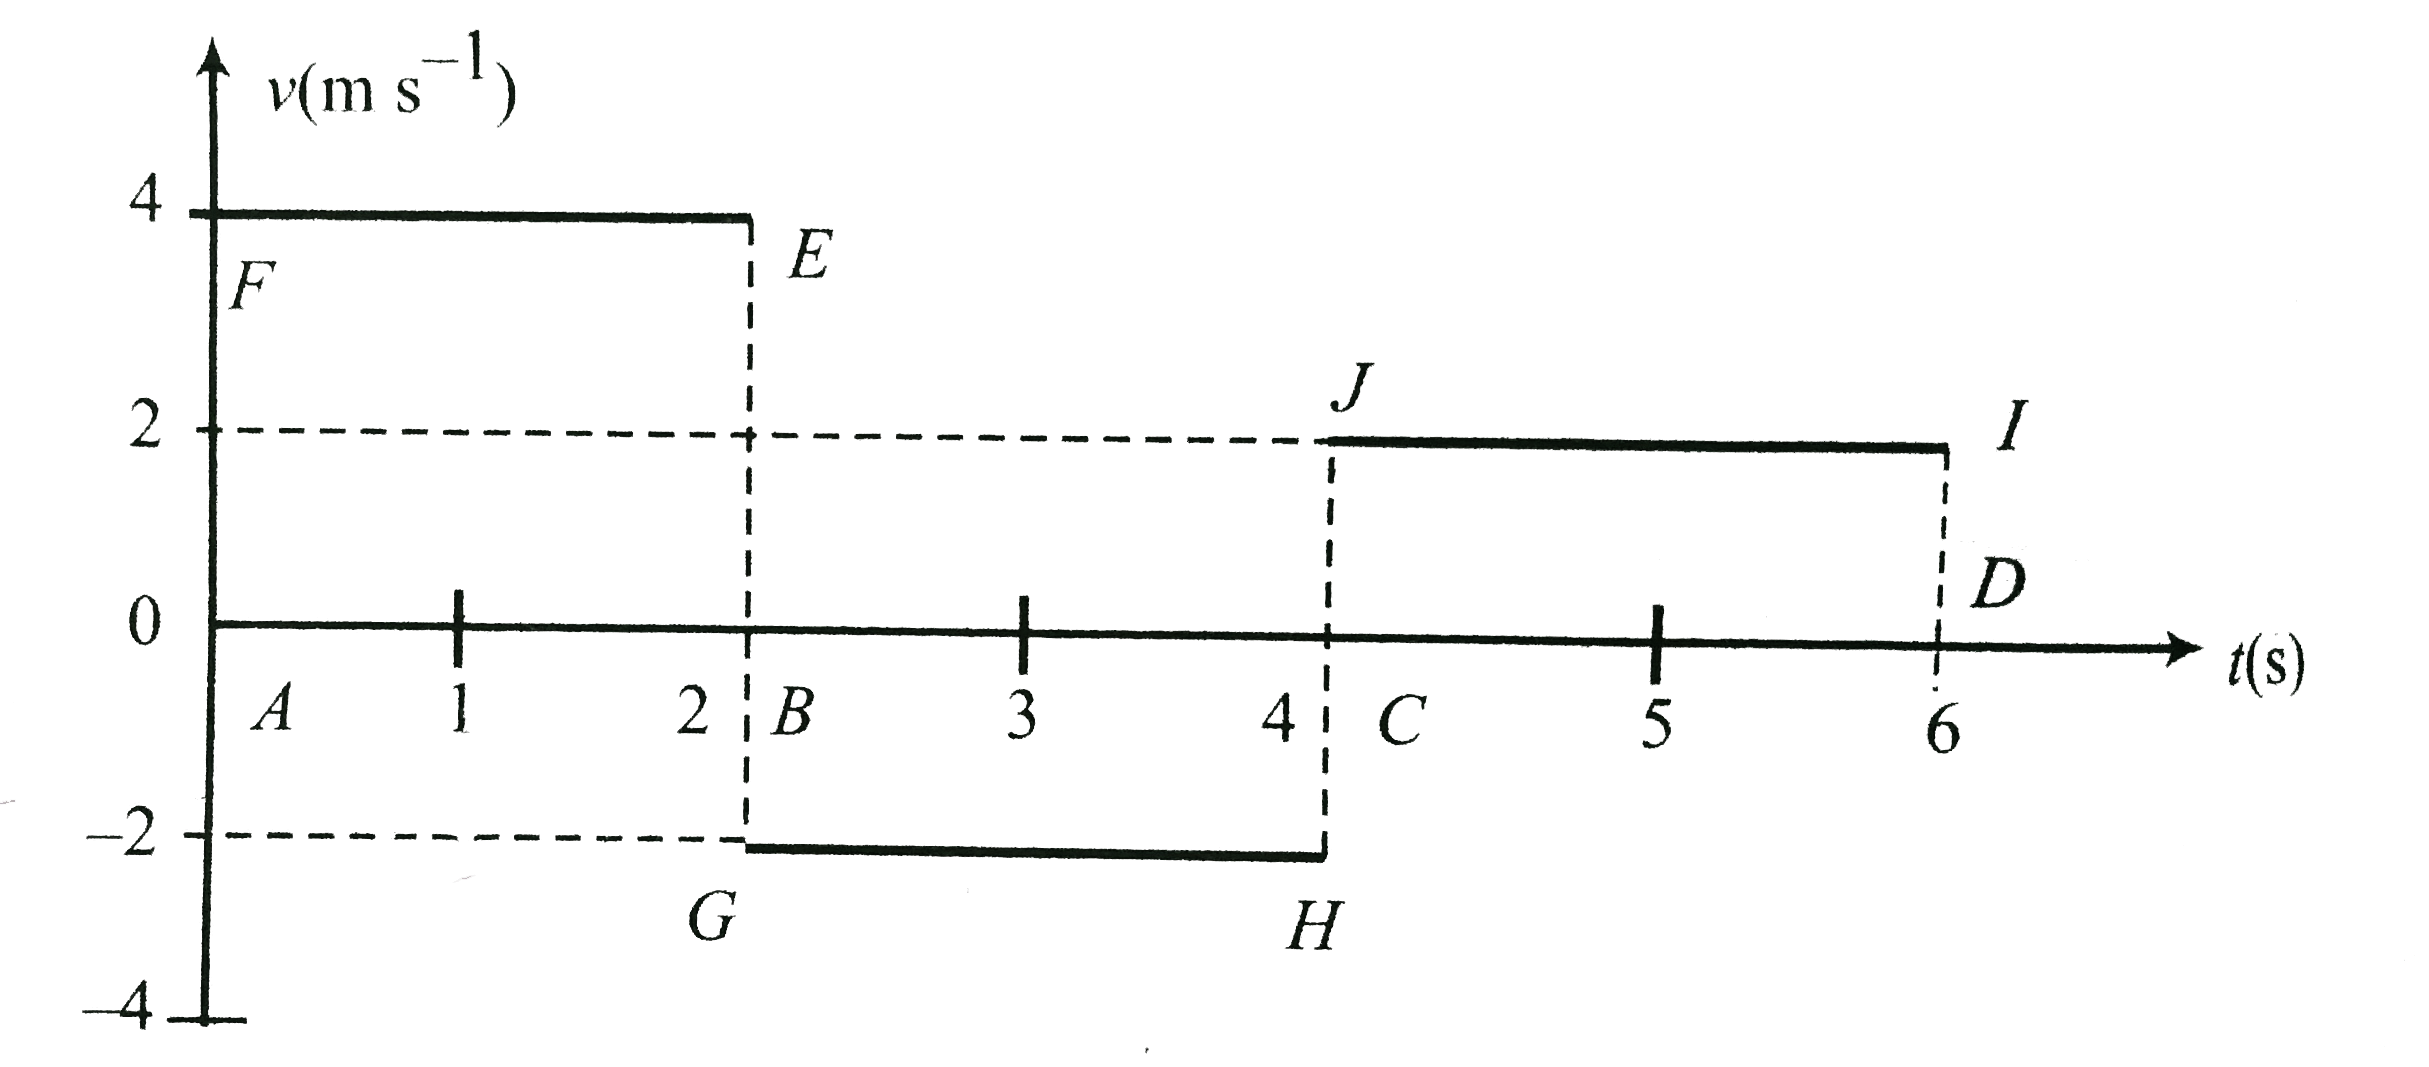 .
.
View SolutionThe velocity-tiem graph of a particle movitgn along a straight line is shown in the Fig. 2 ( b) . 34becurve OABCD.Calca––tethedistancecoveredbythepartic≤between(i) t =zero to t=18seconds(ii)t=2s→t=12s. And the maximum value of acceleration during this interval.
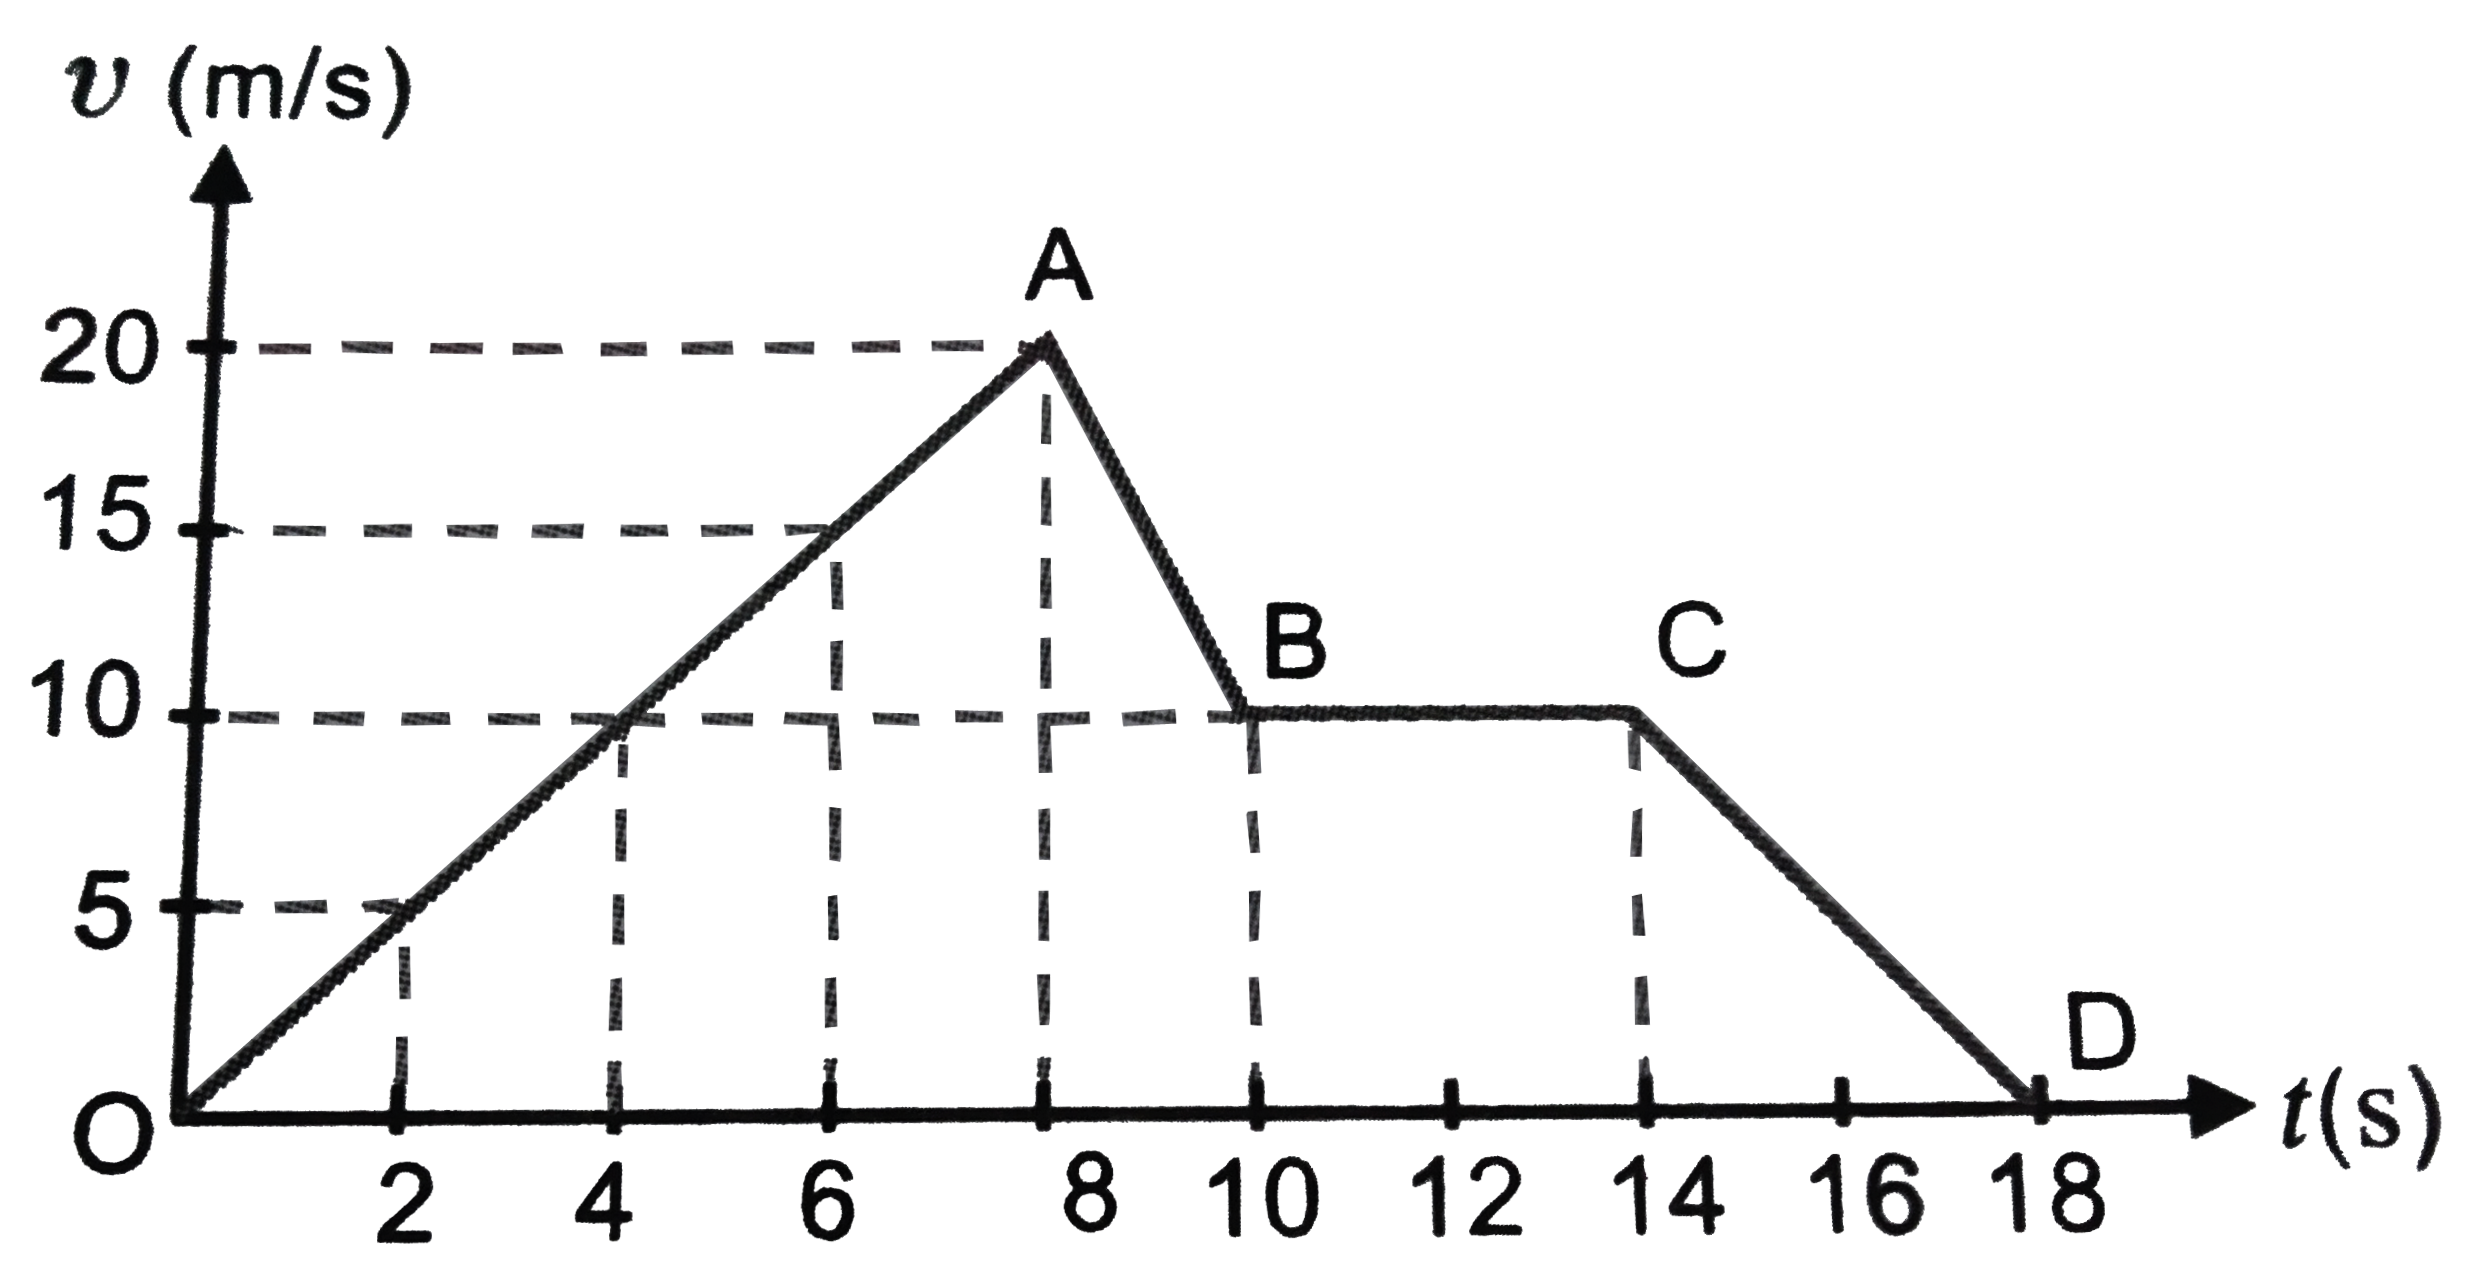 .
.
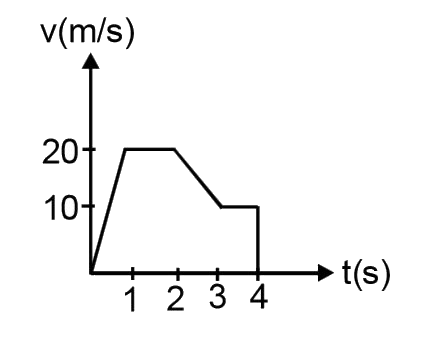
View SolutionThe variation of velocity of a particle moving along straight line is shown in the figure. The distance travelled by the particle in 4 s is
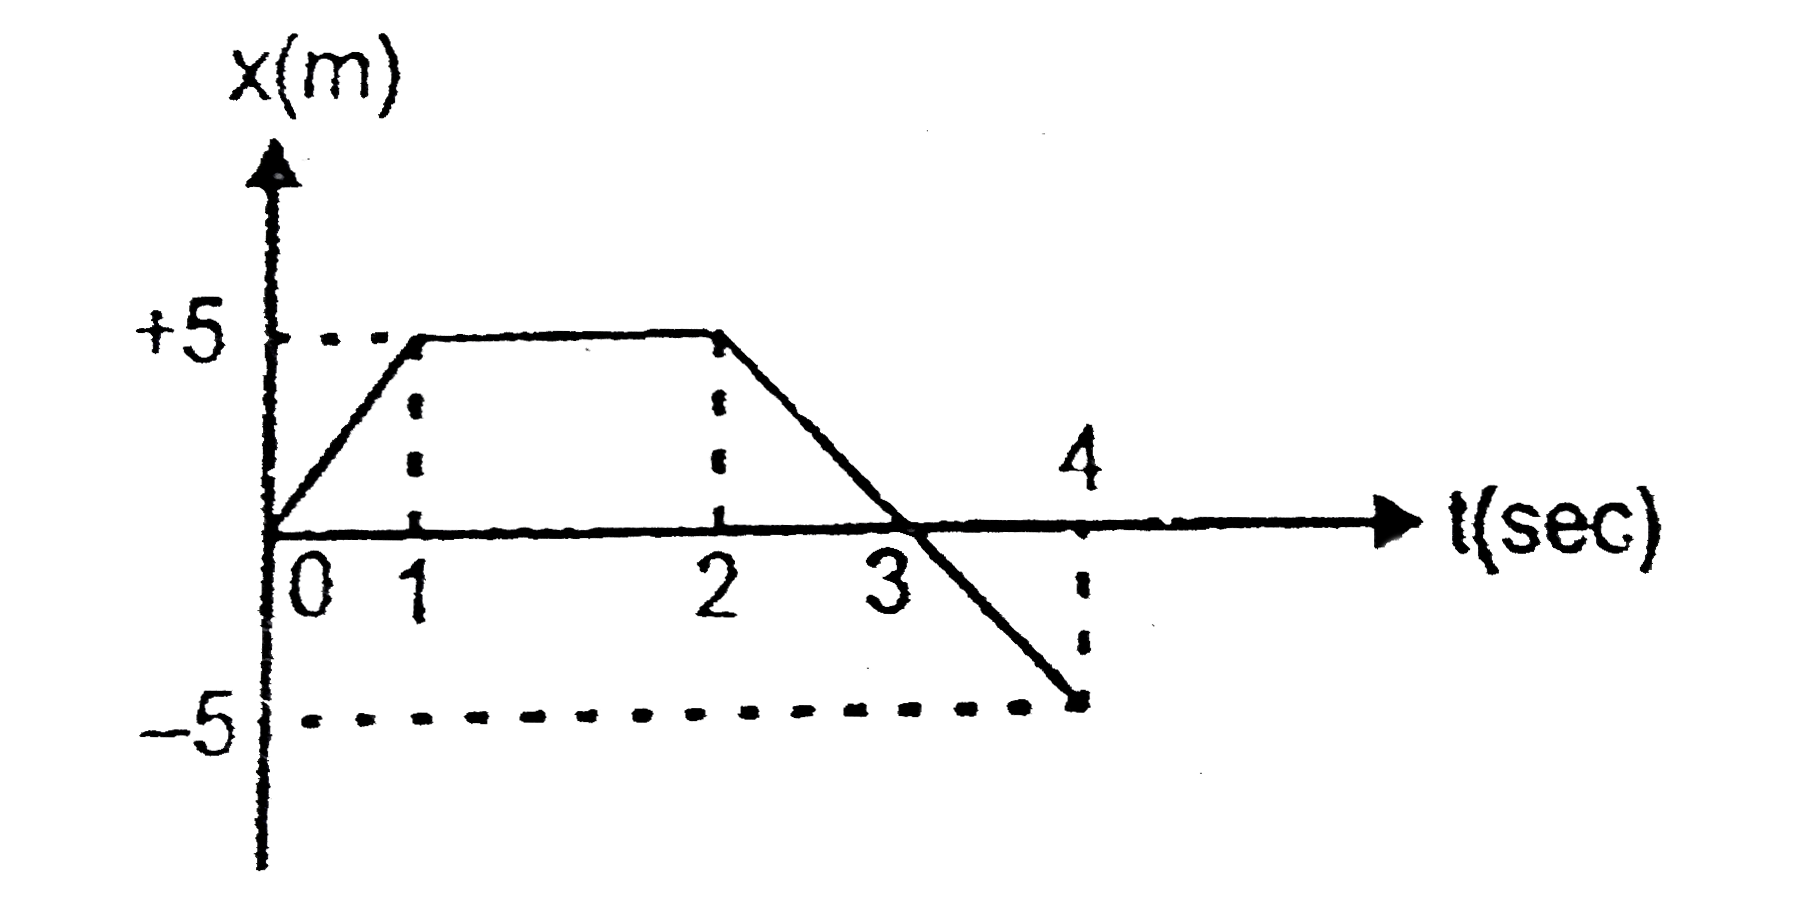
View SolutionPosition-time graph for a particle moving along x− direction is as shown in the figure. Average speed of the particle from t=0 to t=4 is :
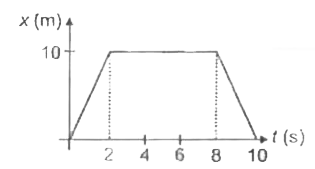
View SolutionThe position - time graph for a particle moving along a straight line is shown in figure. The total distance travelled by it in time t = 0 to t = 10 s is
View Solution