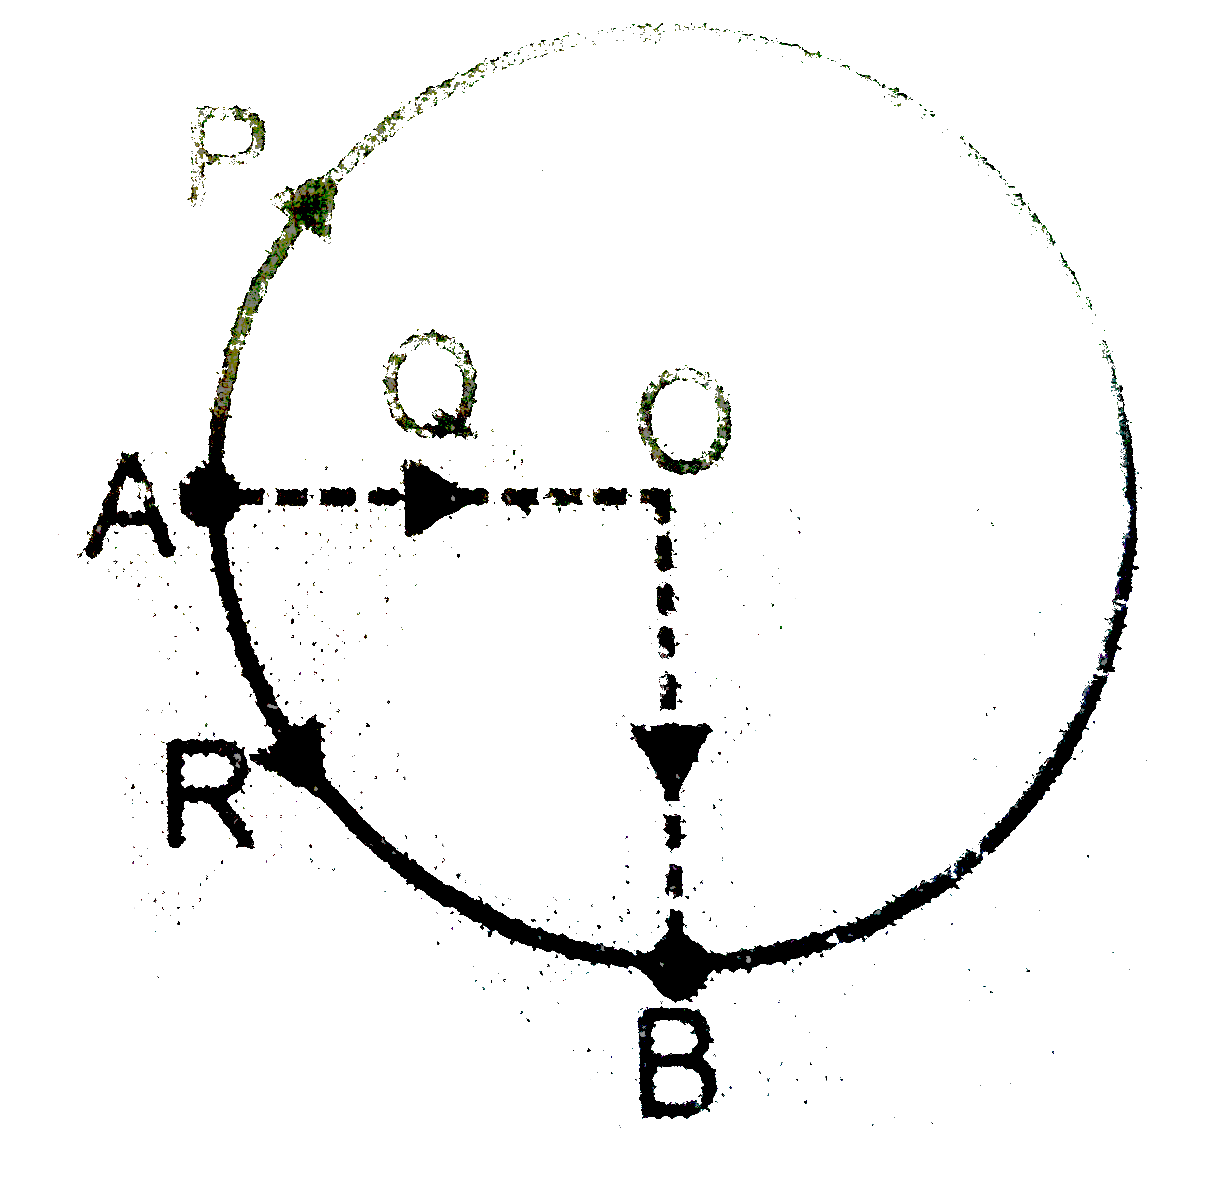
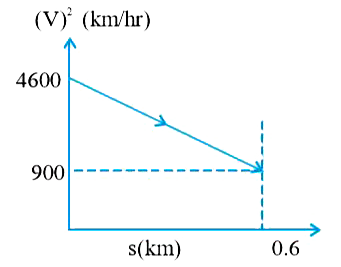
A graph between the square of the velocity of a particle and the distance 'S' moved by the particle is shown in the figure. The acceleration of the particle in kilometer per hour square is
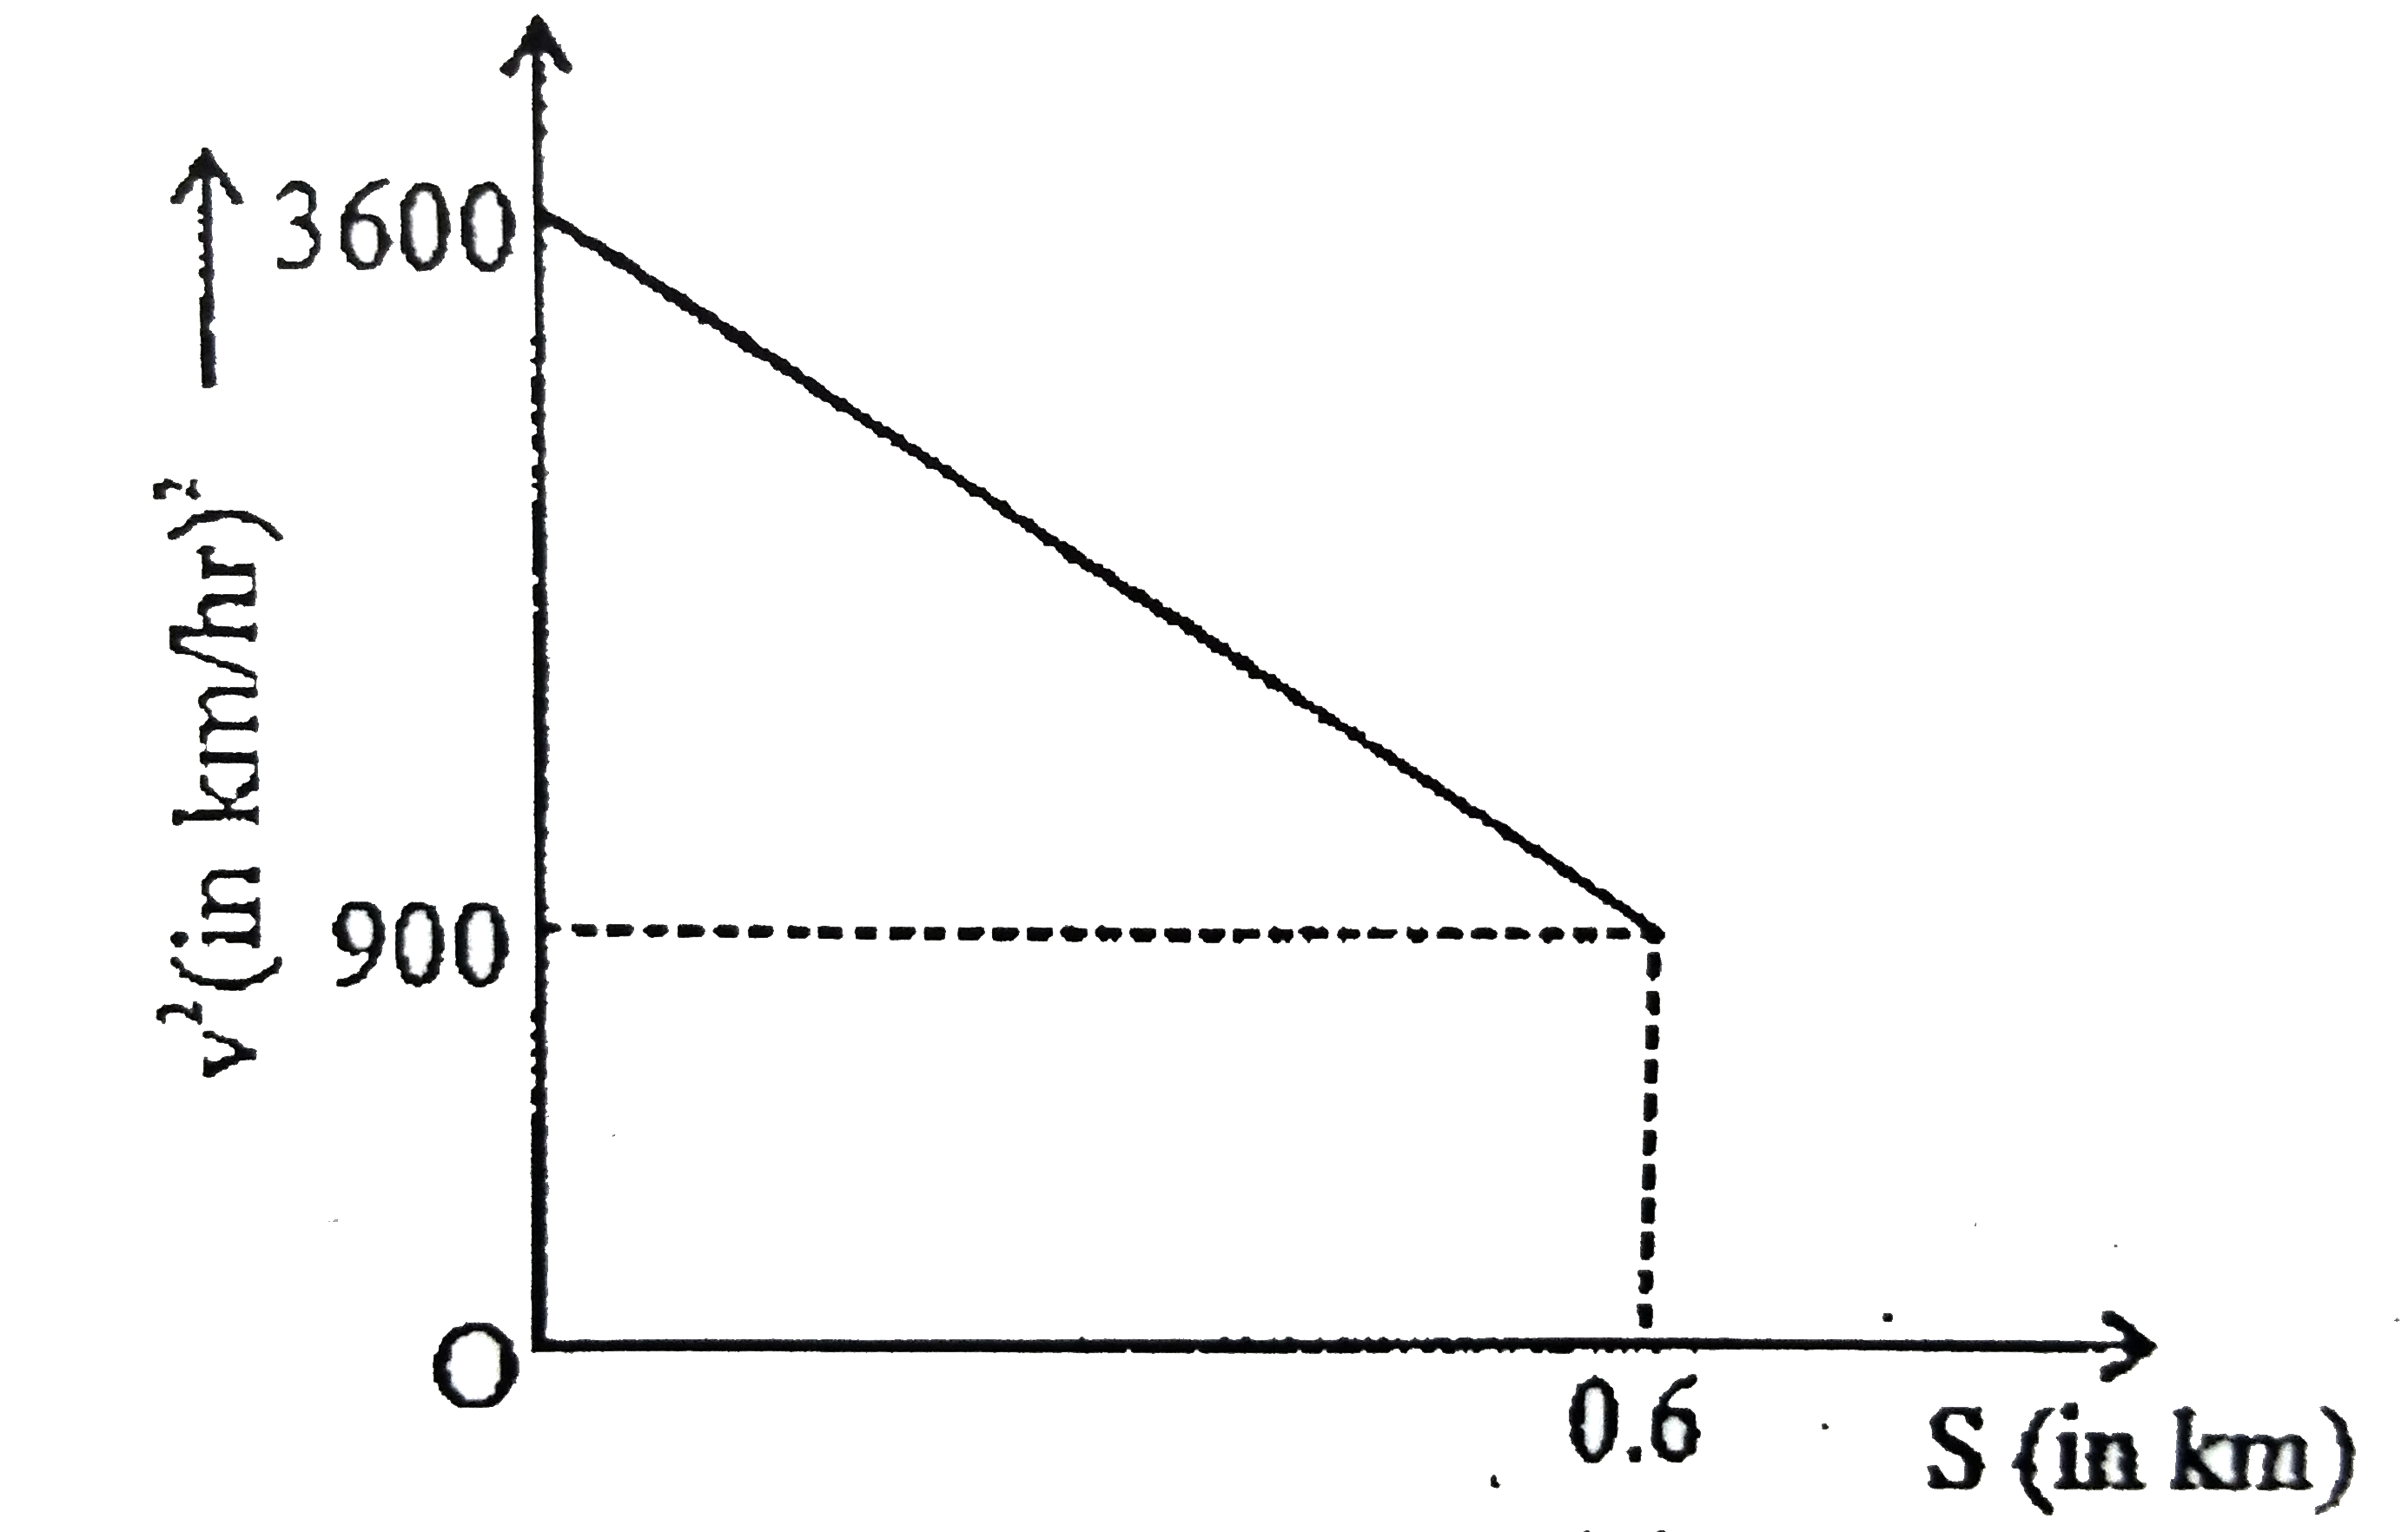
2250
225
−2250
−225
The correct Answer is:C
Step by step video & image solution for A graph between the square of the velocity of a particle and the distance 'S' moved by the particle is shown in the figure. The acceleration of the particle in kilometer per hour square is by Physics experts to help you in doubts & scoring excellent marks in Class 12 exams.
Updated on:21/07/2023Topper's Solved these Questions
Similar Questions
Knowledge Check
A graph between the square of the velocity of a particle and the distance s moved by the particle is shown in the figure. The acceleration of the particle is
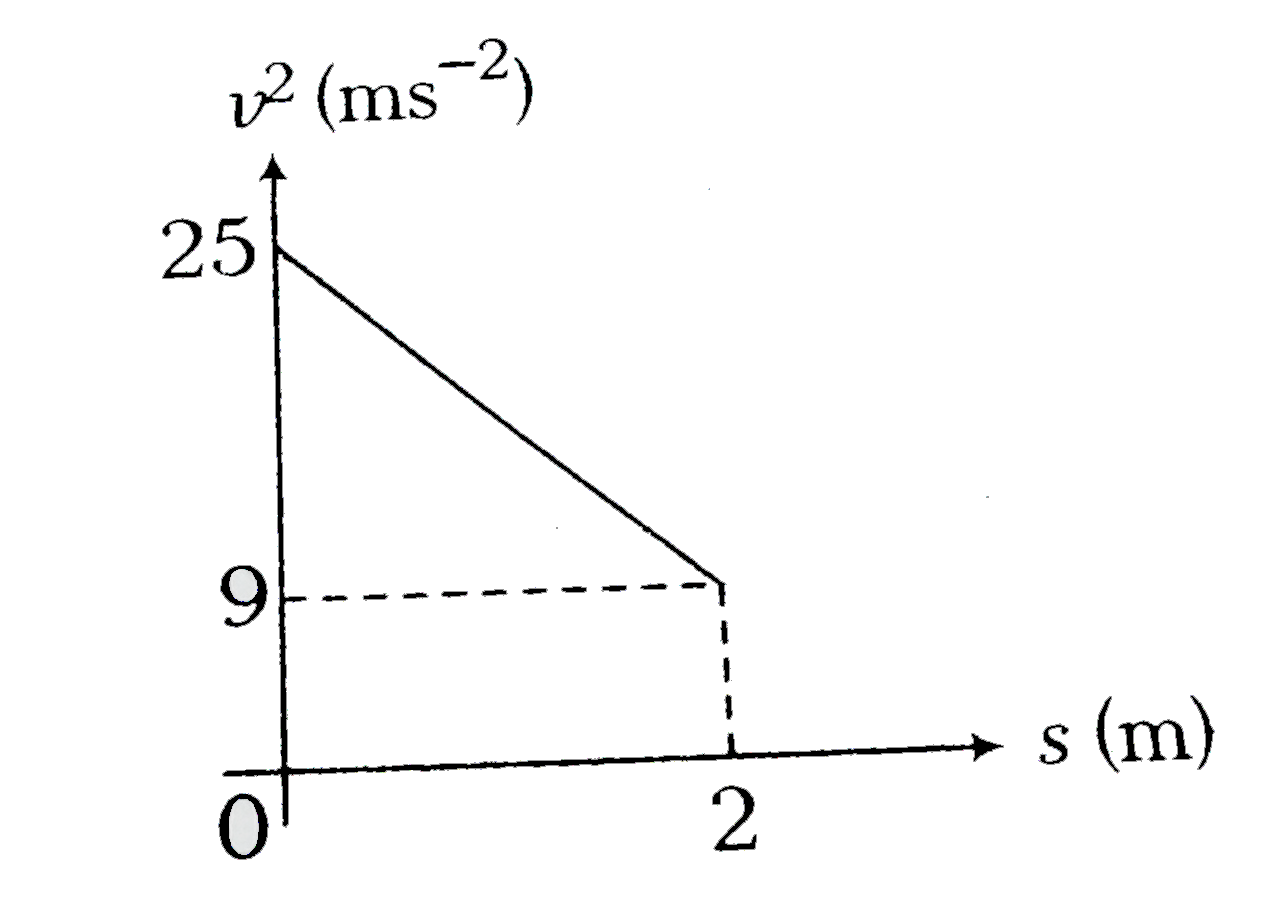 A−8ms−2B−4ms−2C−16ms−2DNone of these
A graph between the square of the velocity of a particle and the distance(s) moved is shown in figure. The acceleration of the particle in kilometers per hour square is:-
 A2250B3084C-2250D-3084
A graph between the square of the velocity of a particle and the distance(s) moved is shown in figure. The constant acceleration of the particle in kilometer per hour square is:
 A2250B3084C−2250D−3084
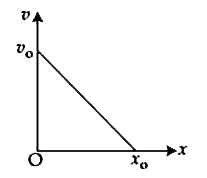
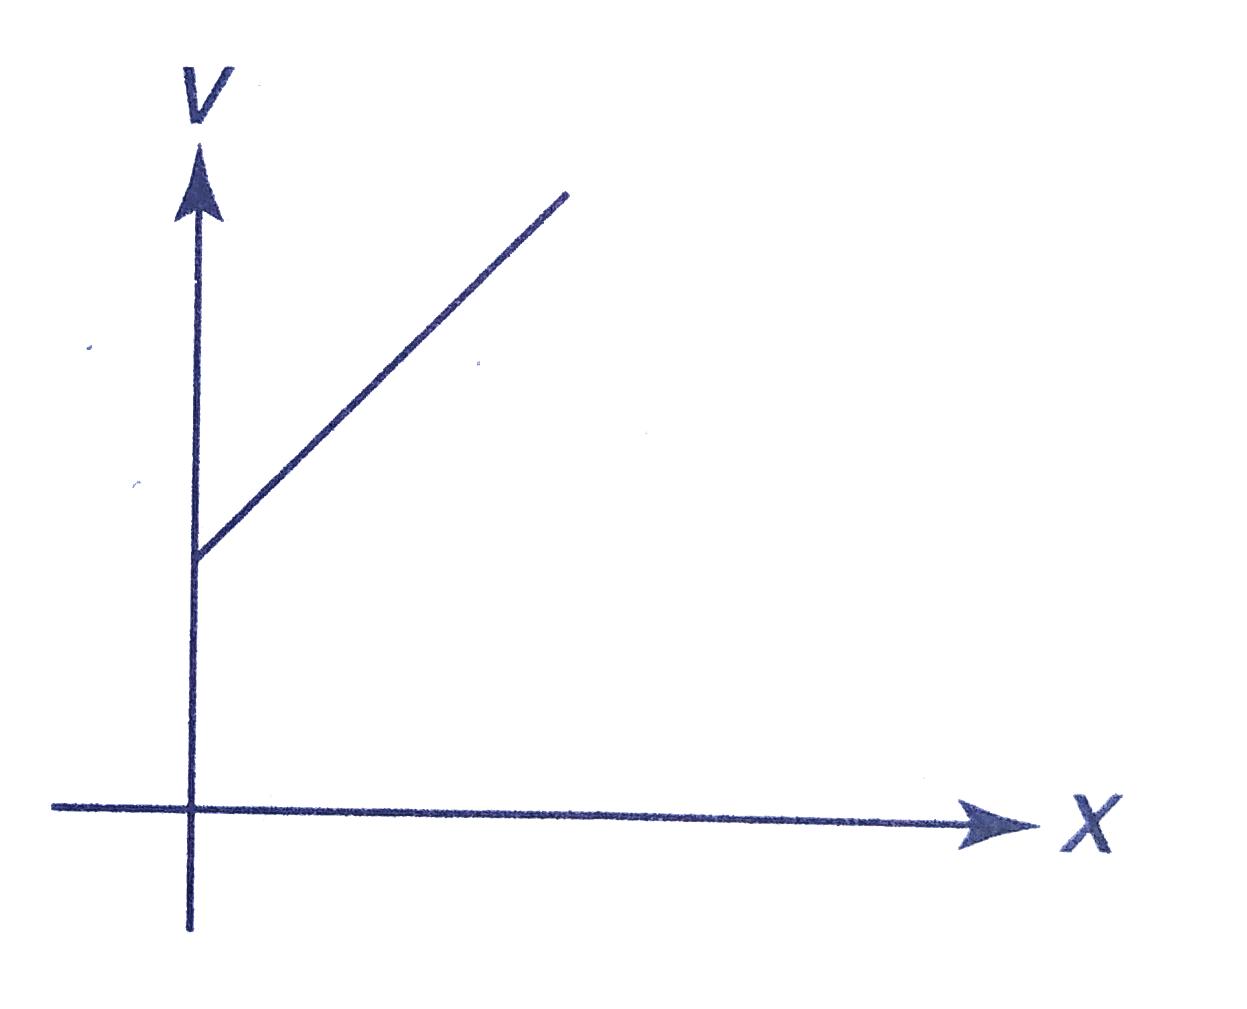
Graph of velocity versus displacement of a particle moving in a straight line is as shown in figure.
The acceleration of the particle is.
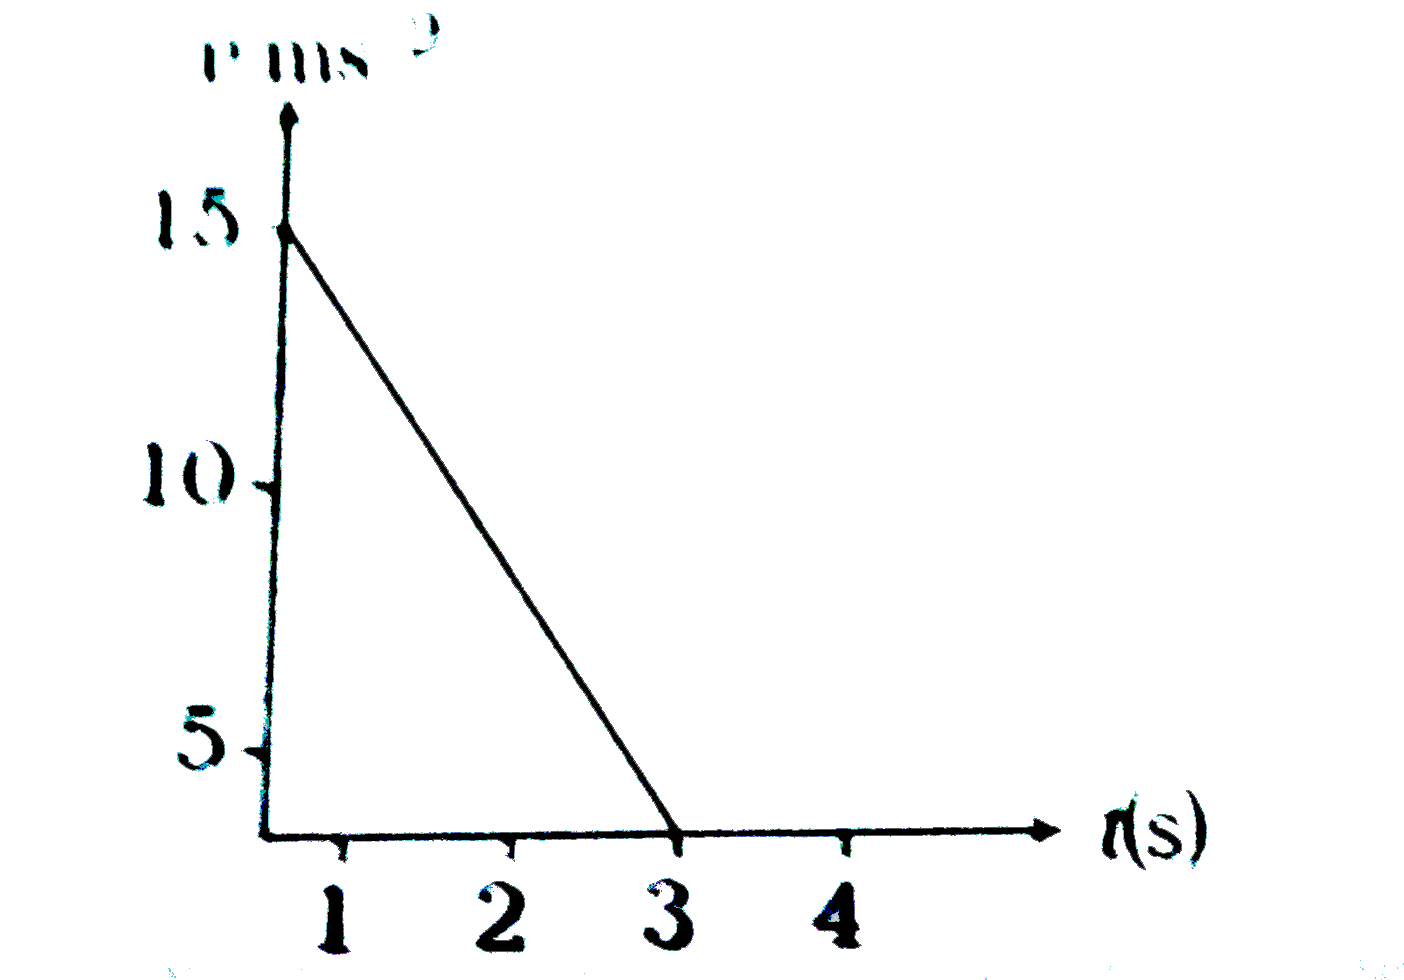
View SolutionThe velocity - time graph is shown in the figure, for a particle. The acceleration of particle is
View SolutionThe velocity -time (v−t) graph of a particle moving in a straight line is shown in figure. The acceleration of the particle at t=9 is:
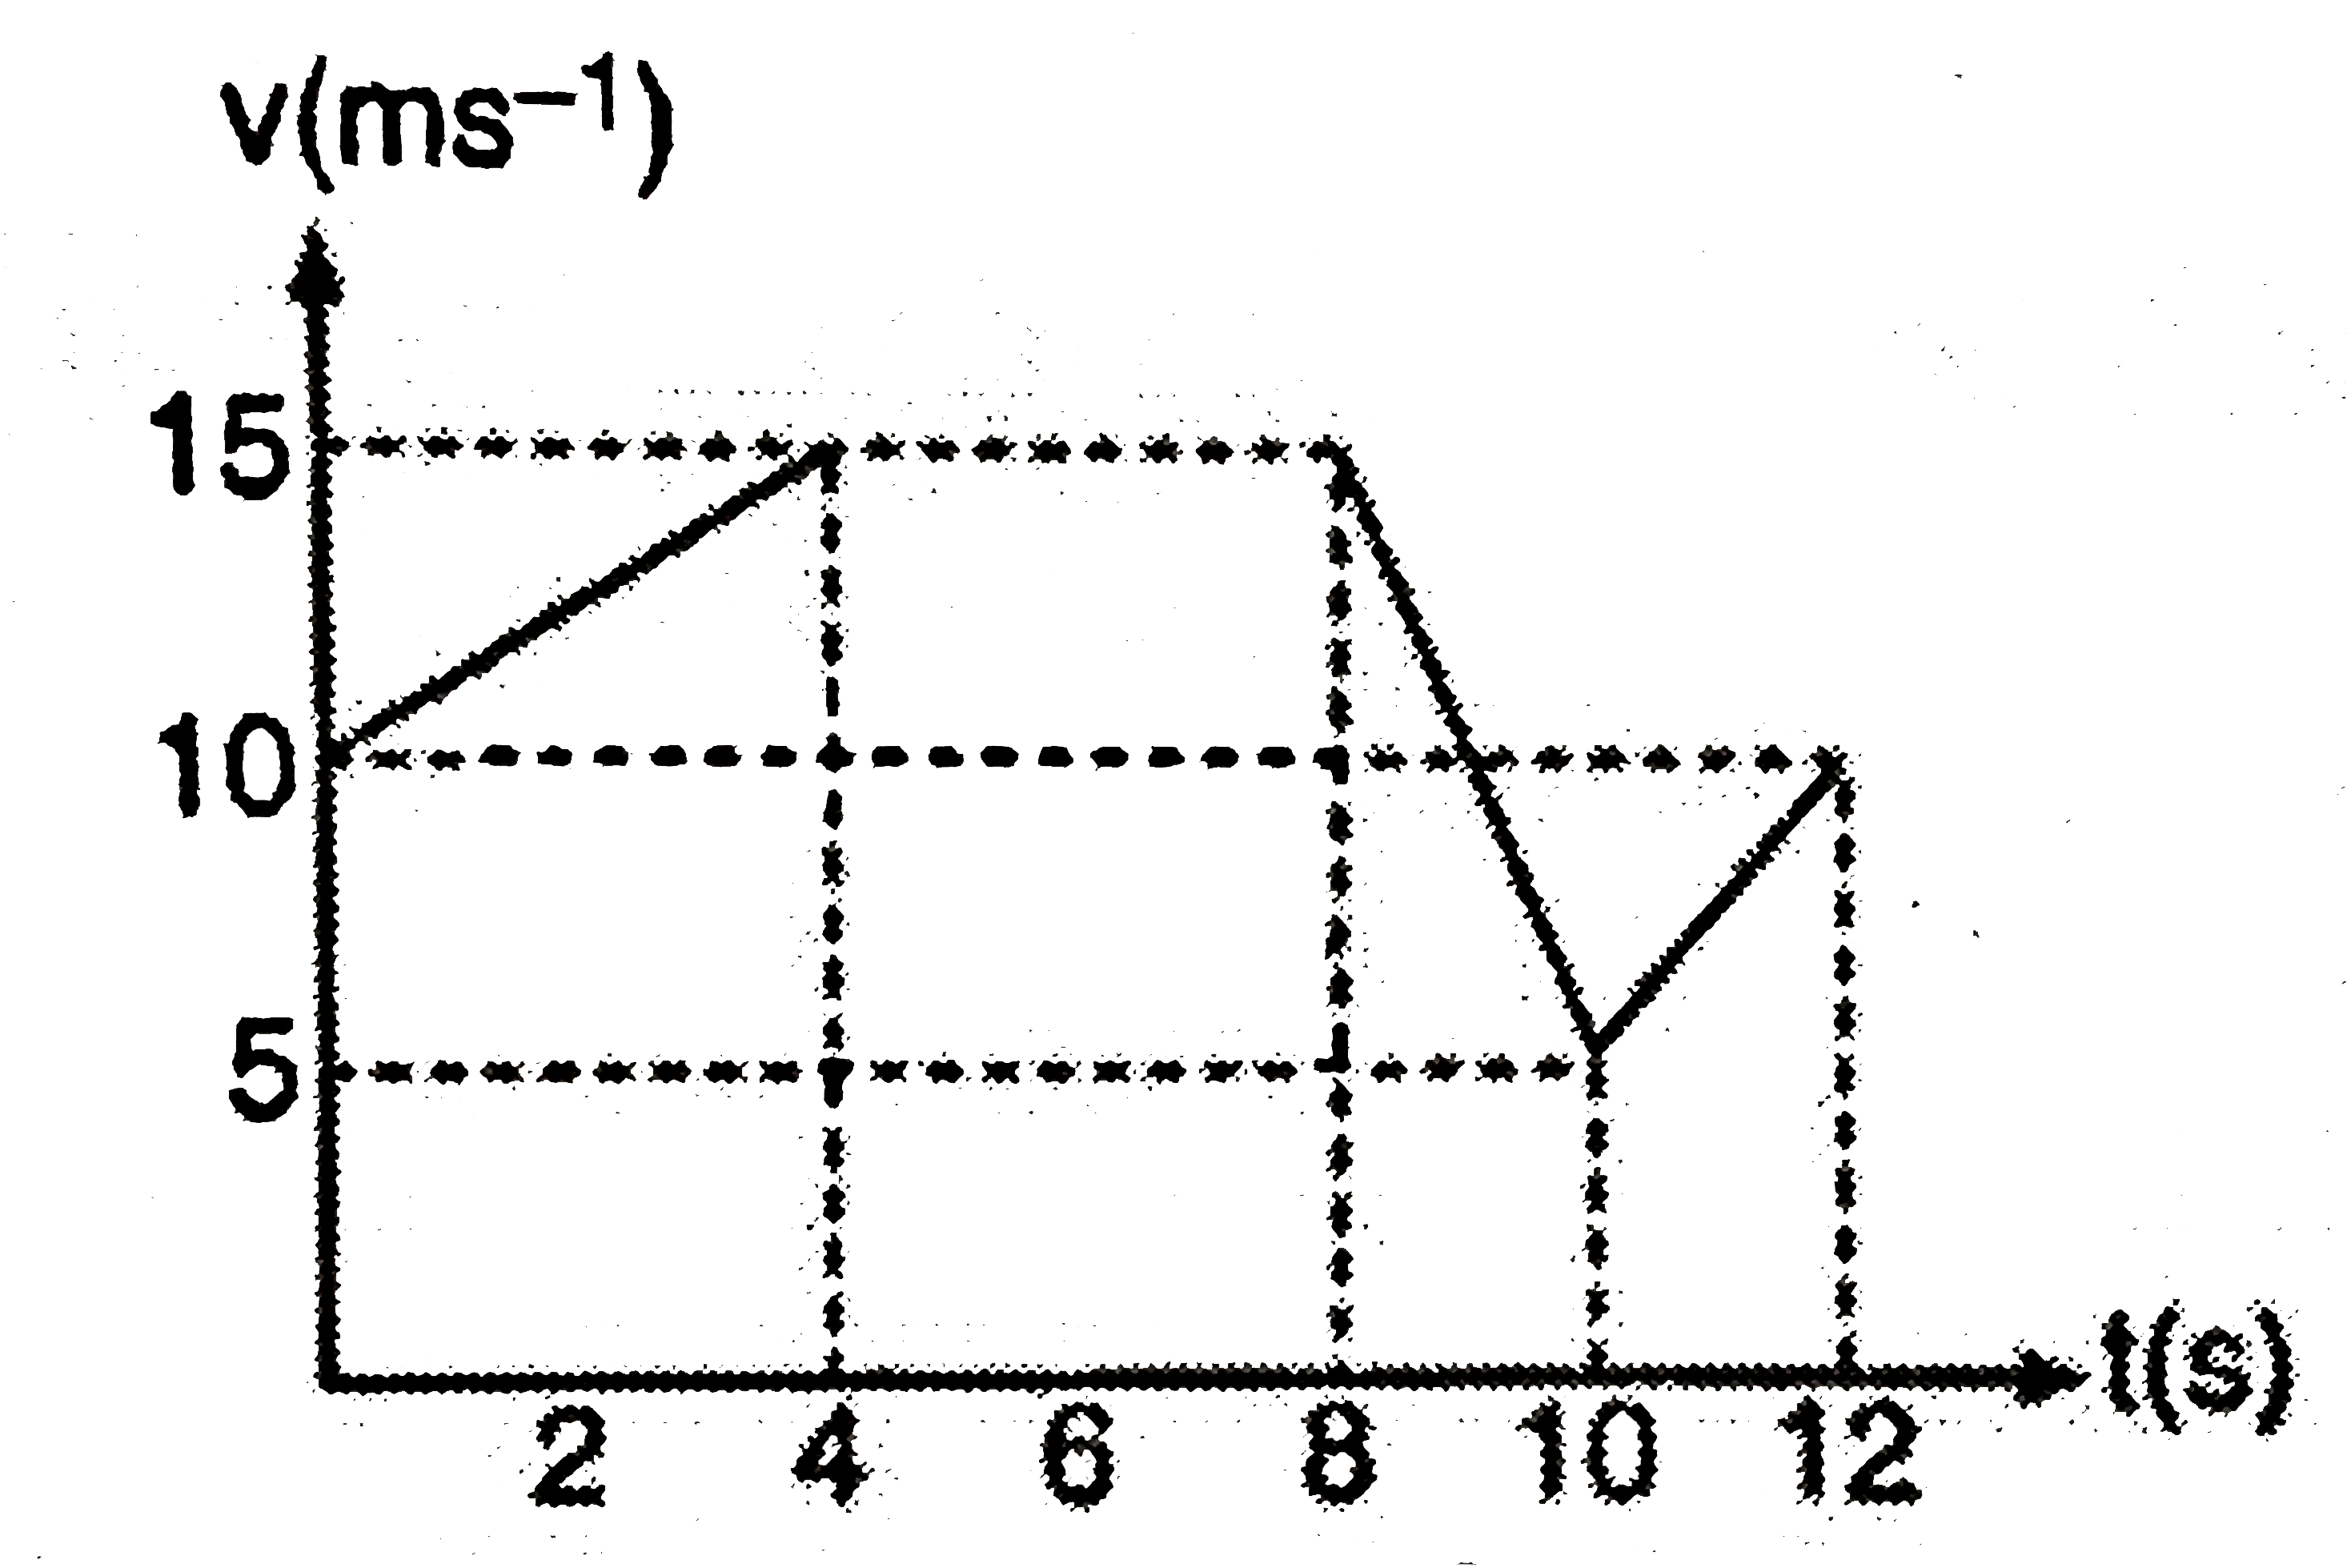
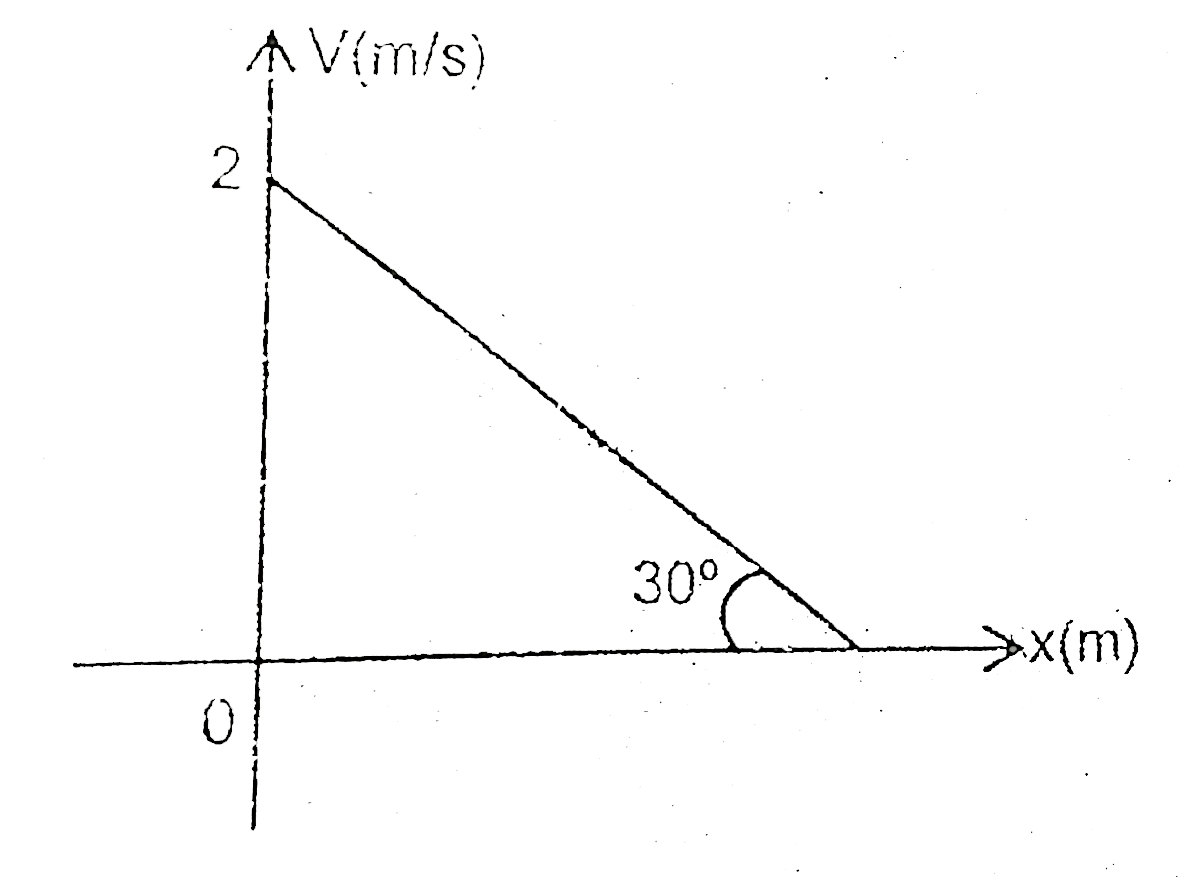
View SolutionVelocity versus displacement graph of a particle moving in a straight line as shown in figure.
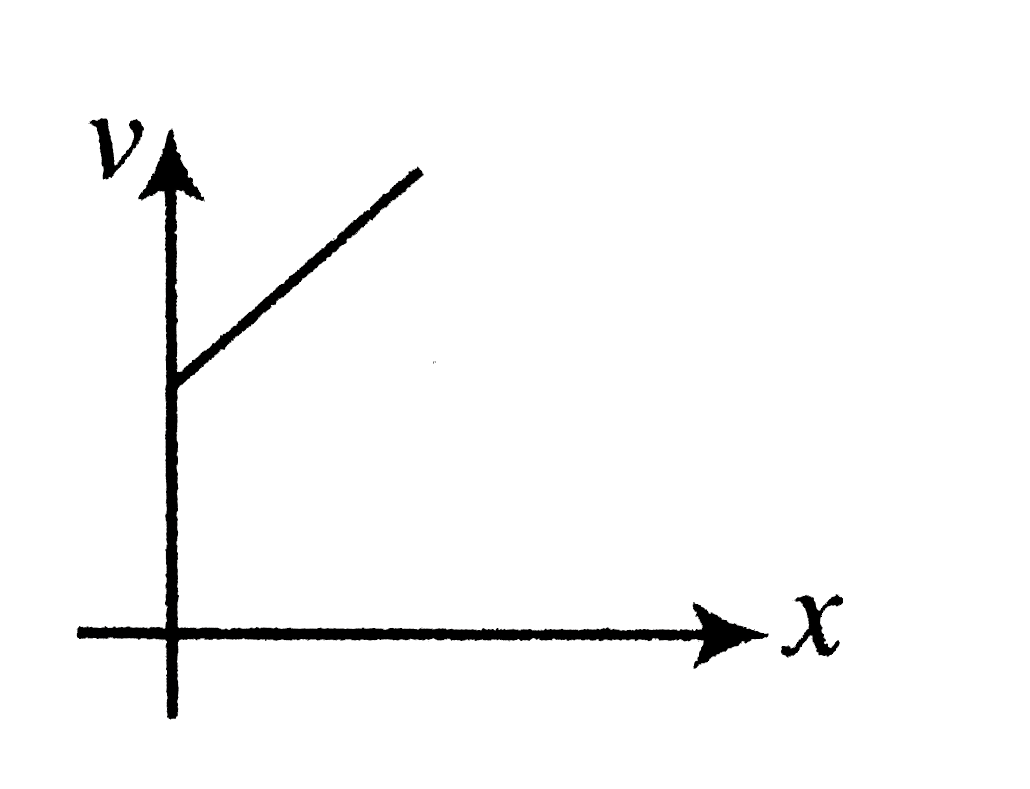
The acceleration of the particle.
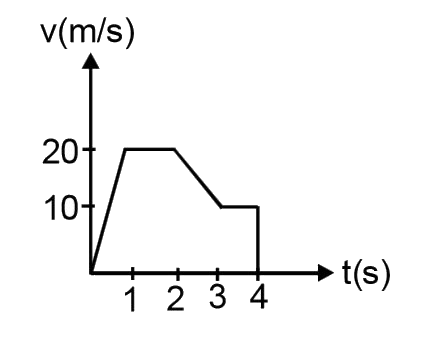
View SolutionThe variation of velocity of a particle moving along straight line is shown in the figure. The distance travelled by the particle in 4 s is
View Solution

