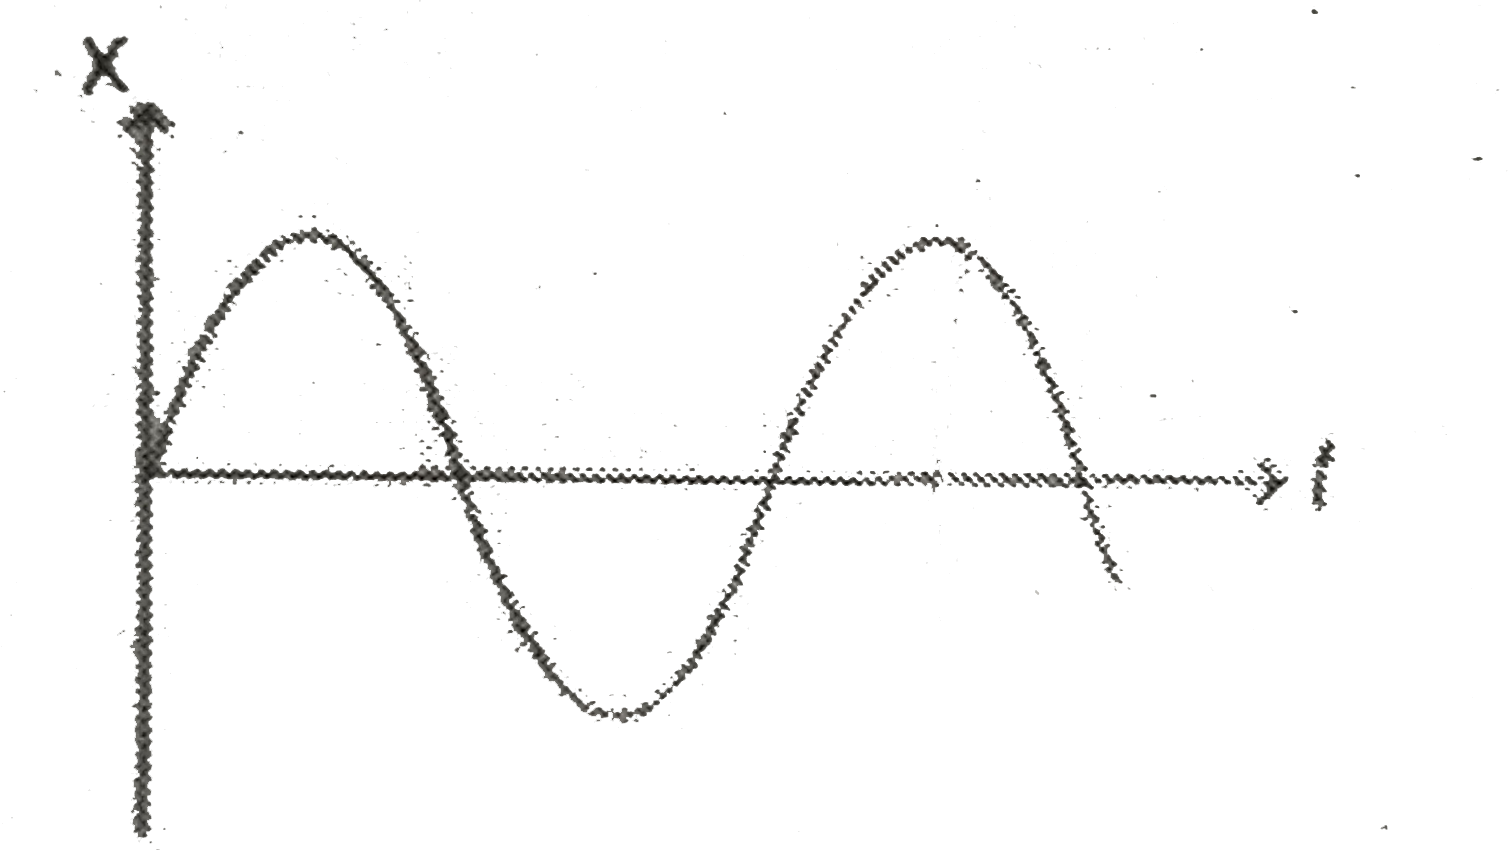
The displacement (x) is plotted with time (t) for a particle executing SHM as shown below. The correct equation of SHM is
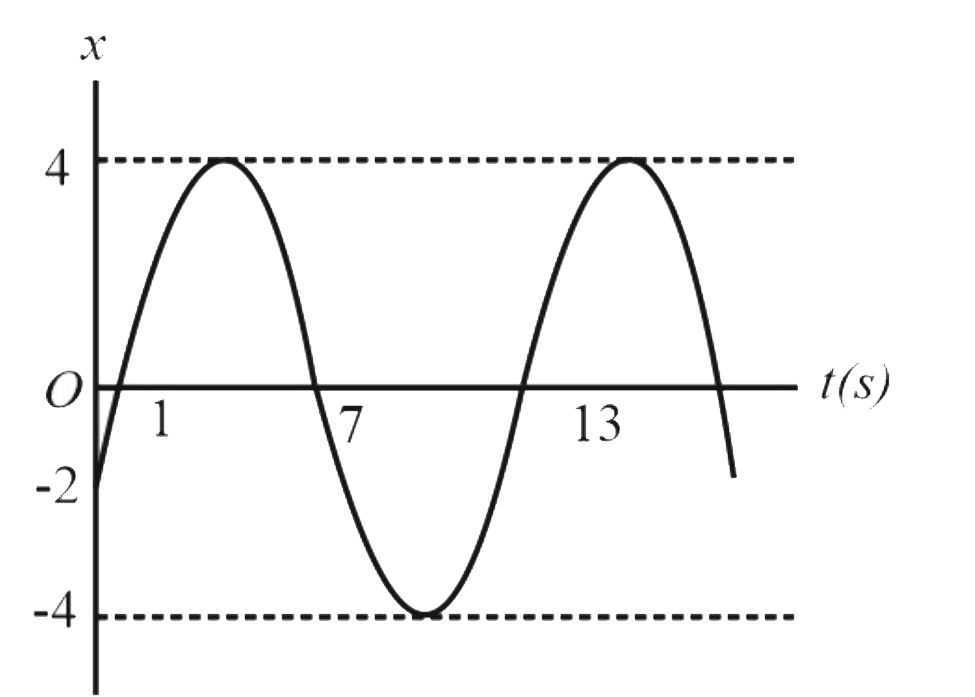
x=4sin(πt6+π6)
x=4sin(πt6−π6)
x=2sin(2π6+π6)
x=2sin(πt6−π6)
The correct Answer is:B
Step by step video, text & image solution for The displacement (x) is plotted with time (t) for a particle executing SHM as shown below. The correct equation of SHM is by Physics experts to help you in doubts & scoring excellent marks in Class 12 exams.
Updated on:21/07/2023Topper's Solved these Questions
Similar Questions
Knowledge Check
Displacement vs. time curve for a particle executing S.H.M. is shown in figure. Choose the correct statements
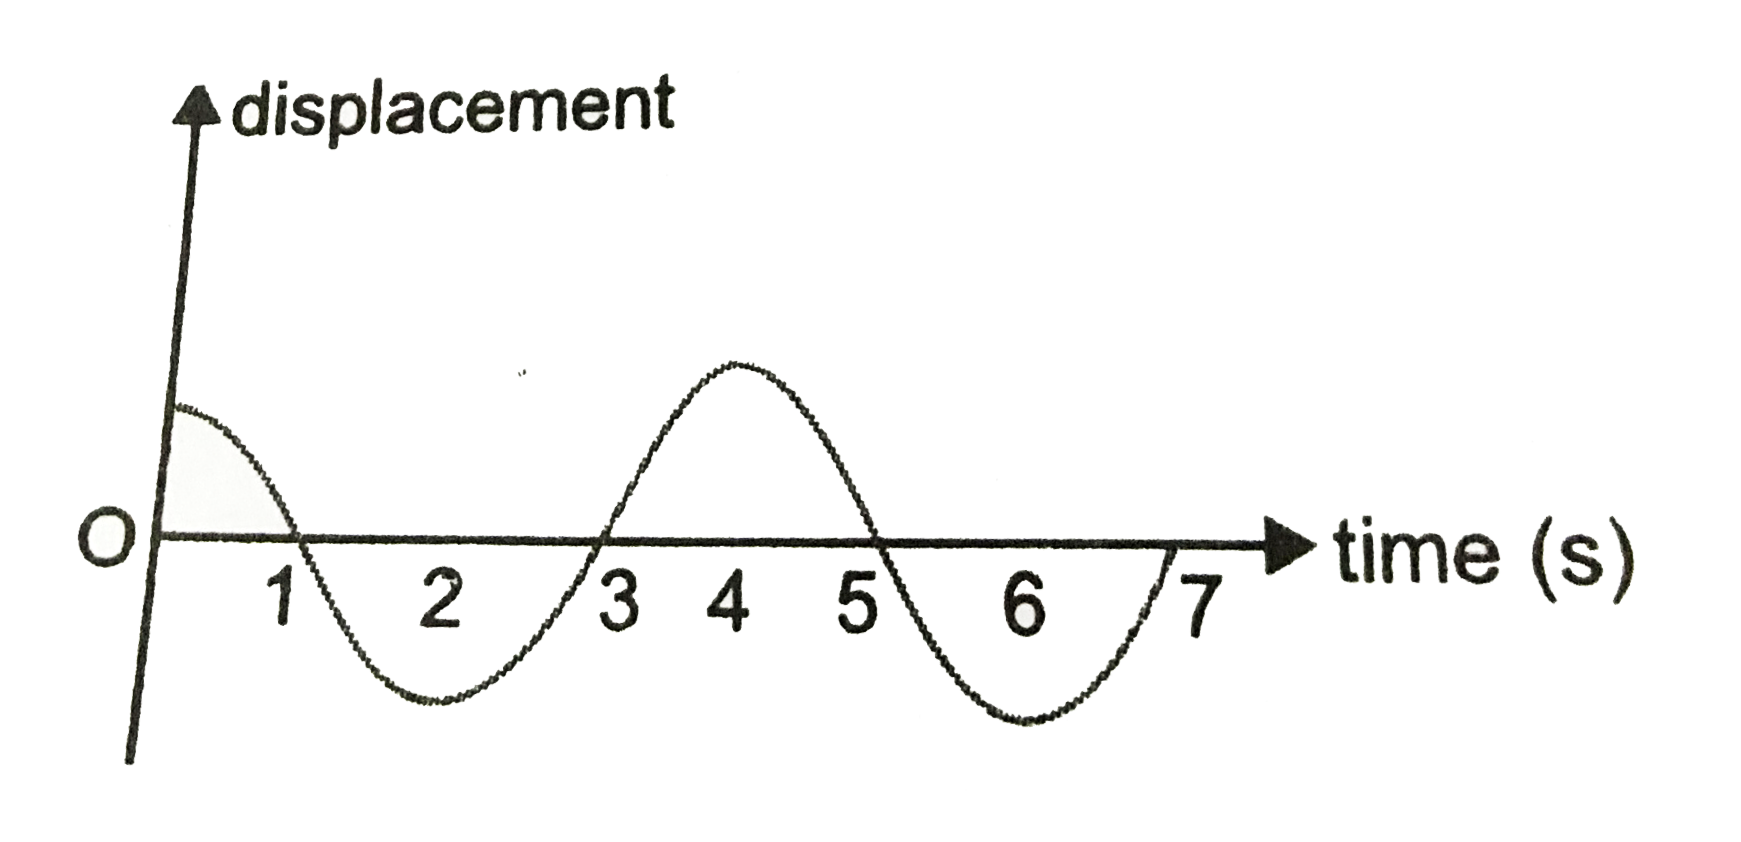 APhase of the oscillator is same at t=0s and t=2sBPhase of the oscillatore is same at t=2s and t=6sCPhase of the oscillator is same at t=1s and t=7sDPhase of the oscillatore is same at t=1s and t=5s
The displacment versus timecurves for a particle executing SHM is show in figure . Choose the correct statement (s)
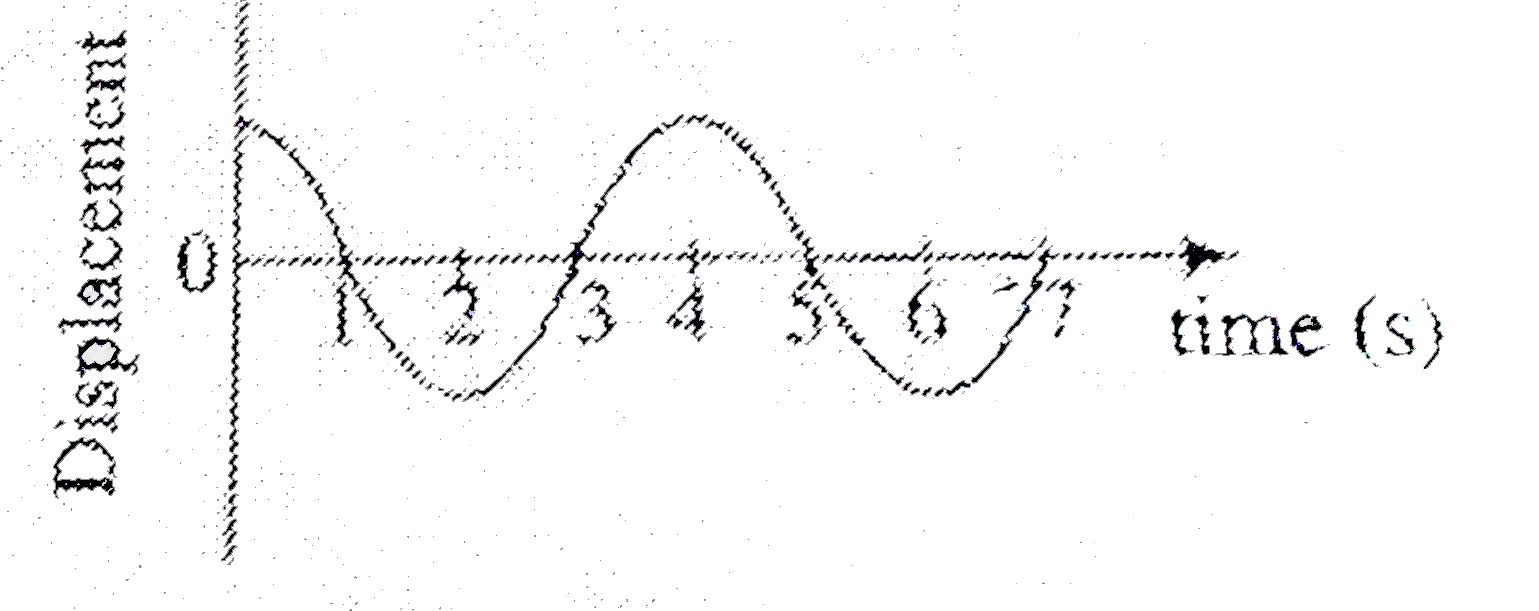 APhases of the oscillator is same at t=0s and t=2sBPhases of the oscillator is same at t=2s and t=6sCPhases of the oscillator is same at t=1s and t=7sDPhases of the oscillator is same at t=1s and t=5s
Displacement versus time curve for a particle executing SHM is shown in figure. Choose the correct statements.
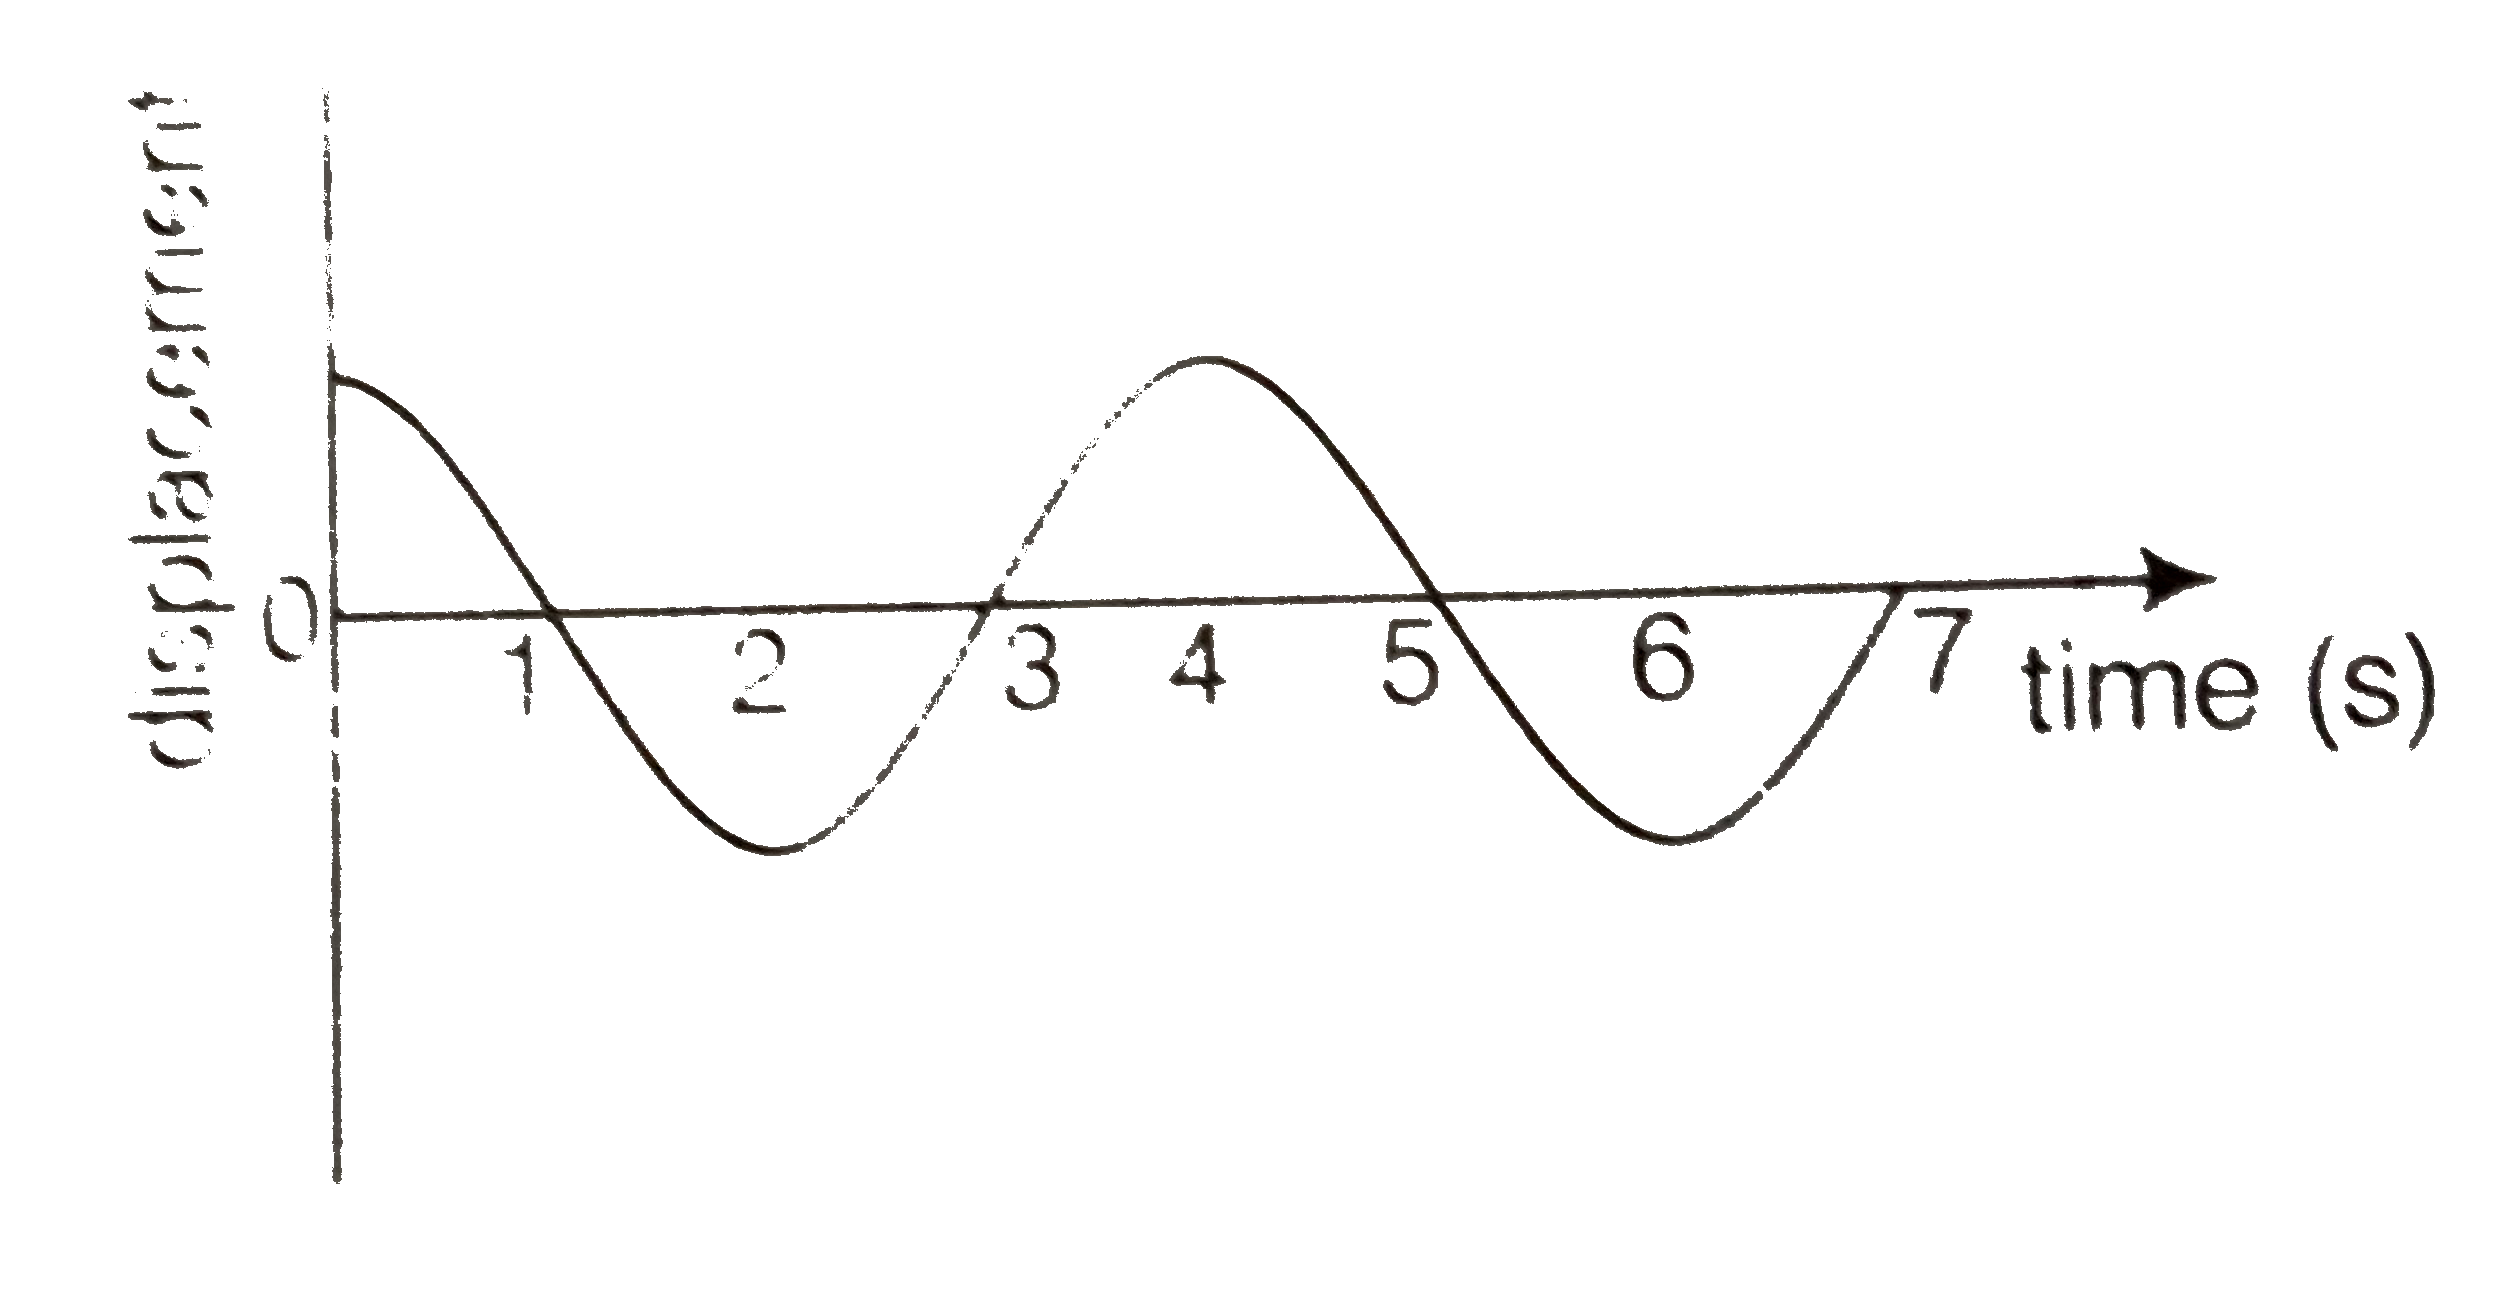 A(a) Phase of the oscillator is same at t=0s and t=2sBPhase of the oscillator is same at t=2s and t=6sCPhase of the oscillator is same at t=1sand t=7sDPhase of the oscillator is same at t=1sand t=5s
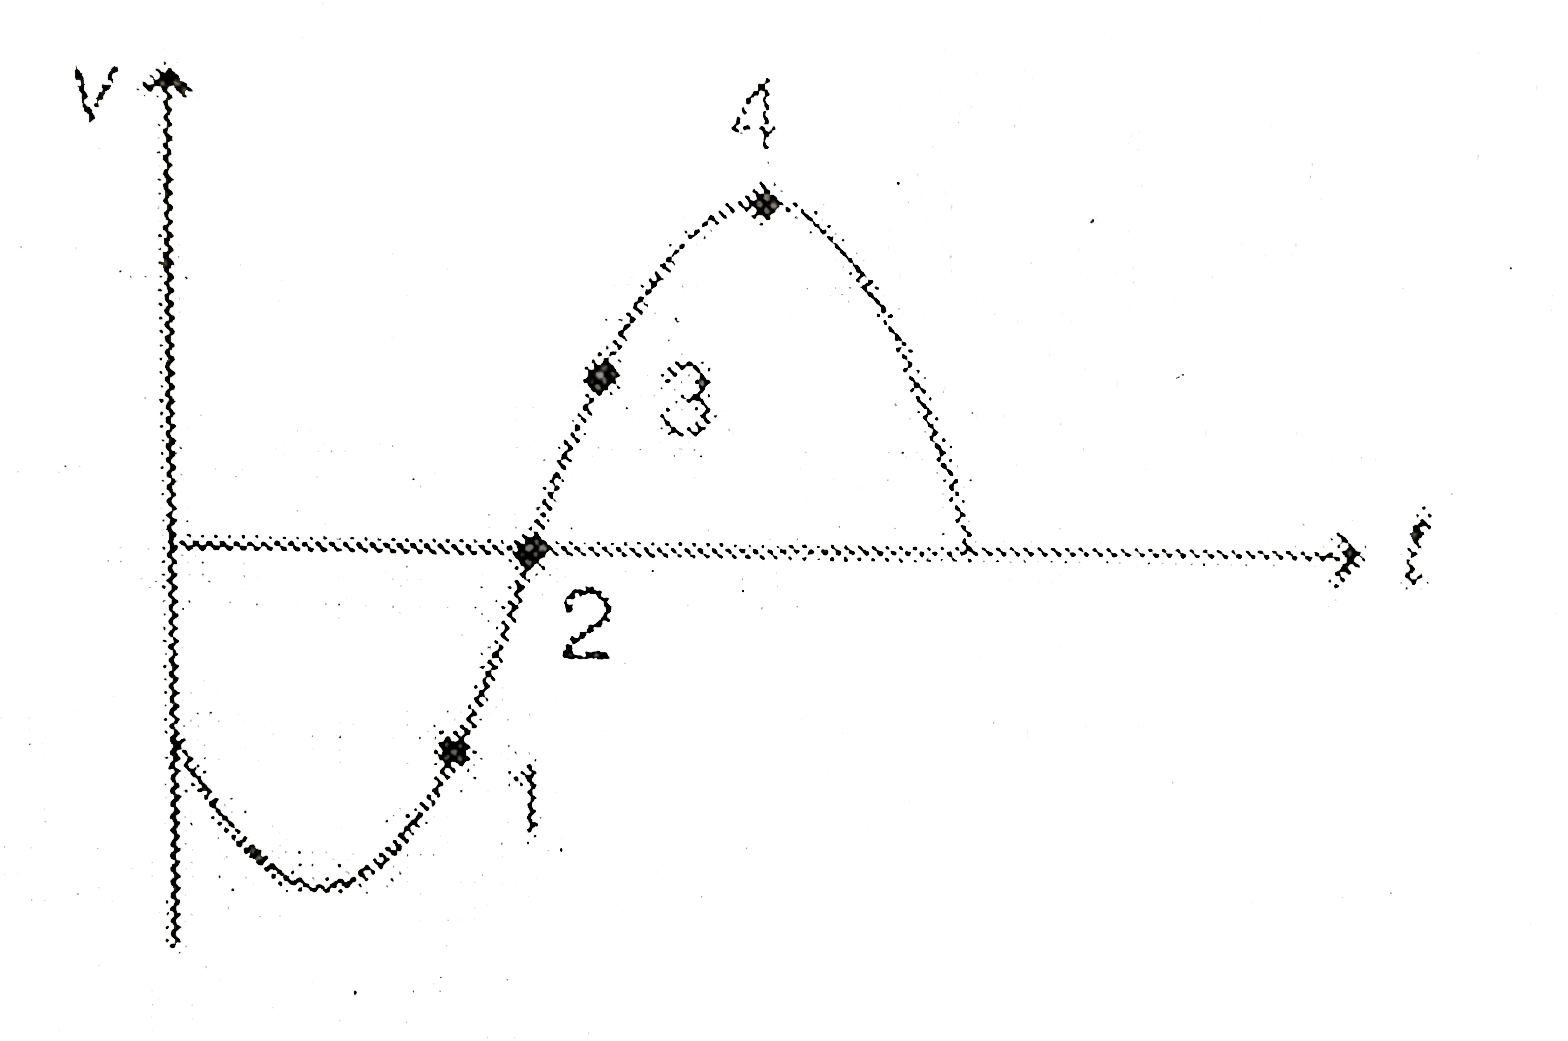
Velocity-time graph of a particle executing SHM is shown in figure. Select the correct alternative(s).
View SolutionThe displacement time graph of a particle executing S.H.M. is as shown in the figure
The corresponding force-time graph of the particle is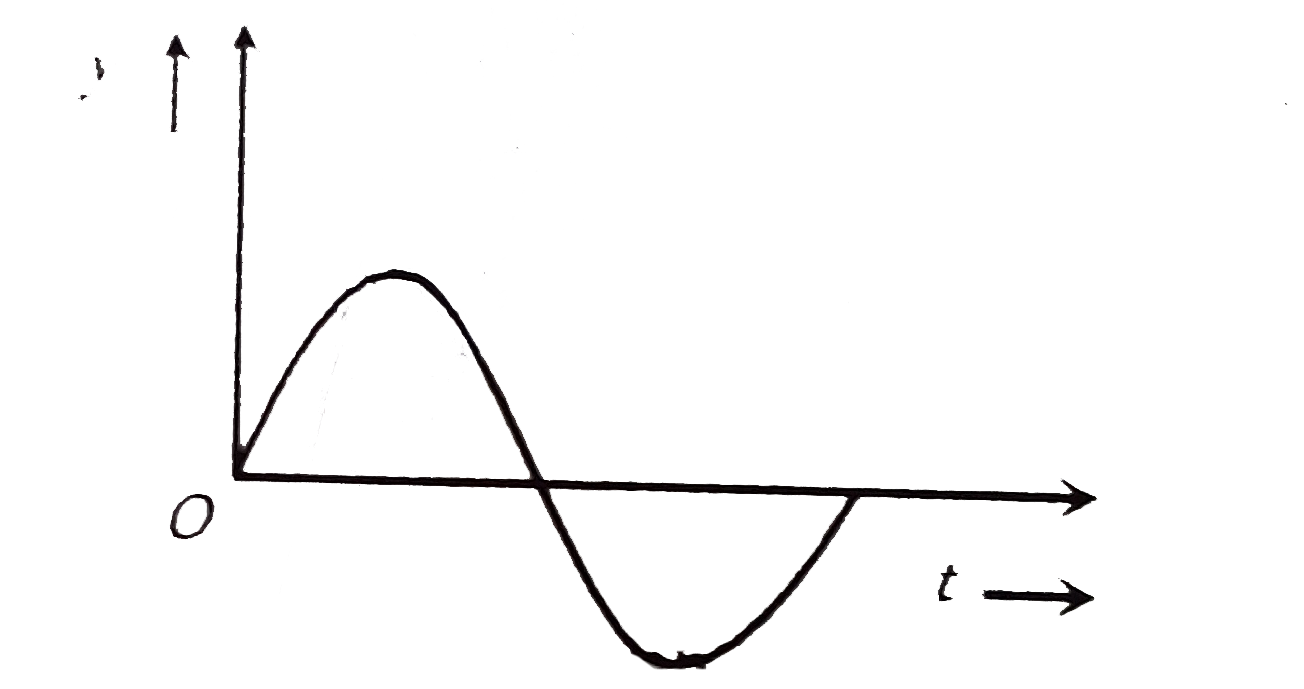
View SolutionThe displacement time graph of a particle executing SHM is as shown in the figure
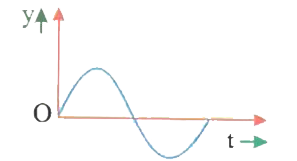
The corresponding force-time graph of the particle is
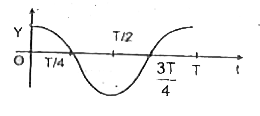
View SolutionDisplacement-time graph of a particle executing SHM is as shown
The corresponding force-time graph of the particle can be
View SolutionThe displacement time graph of a particle executing an SHM is as shown. Which of the following statements are true?
View Solution
