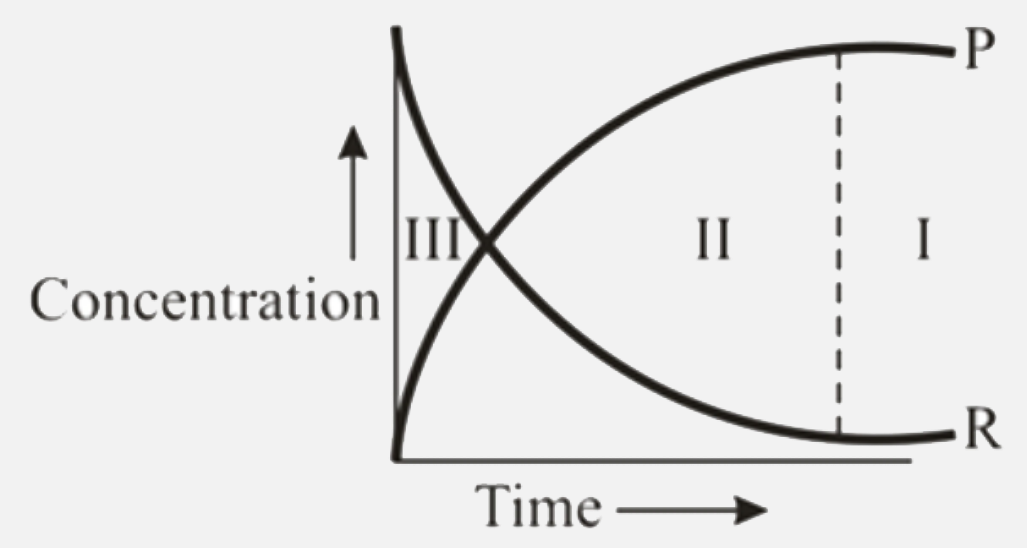
For the reaction R⇔P Variation of concentration is plotted against time

Which of the following regions show (s) equilibrium ?
III
II
I
II and III both
The correct Answer is:C
Step by step video & image solution for For the reaction RhArrP Variation of concentration is plotted against time Which of the following regions show (s) equilibrium ? by Chemistry experts to help you in doubts & scoring excellent marks in Class 12 exams.
Updated on:21/07/2023Topper's Solved these Questions
Similar Questions
For a chemical reactin R → P, variation of concentration of R vs time plot is given below : For this reaction :
(i) Predict the order of reaction.
(ii) What is the unit of rate constant (k) ?
View SolutionThe rate of decay (R) of nuclei in a radioactive sample is plotted against time (t). Which of the following best represents the resulting curve ?
View Solution
Knowledge Check
Growth plotted against time gives a
AParabolic curveBSigmoid curveCUpright lineDHorizontal line.Growth plotted against time gives a
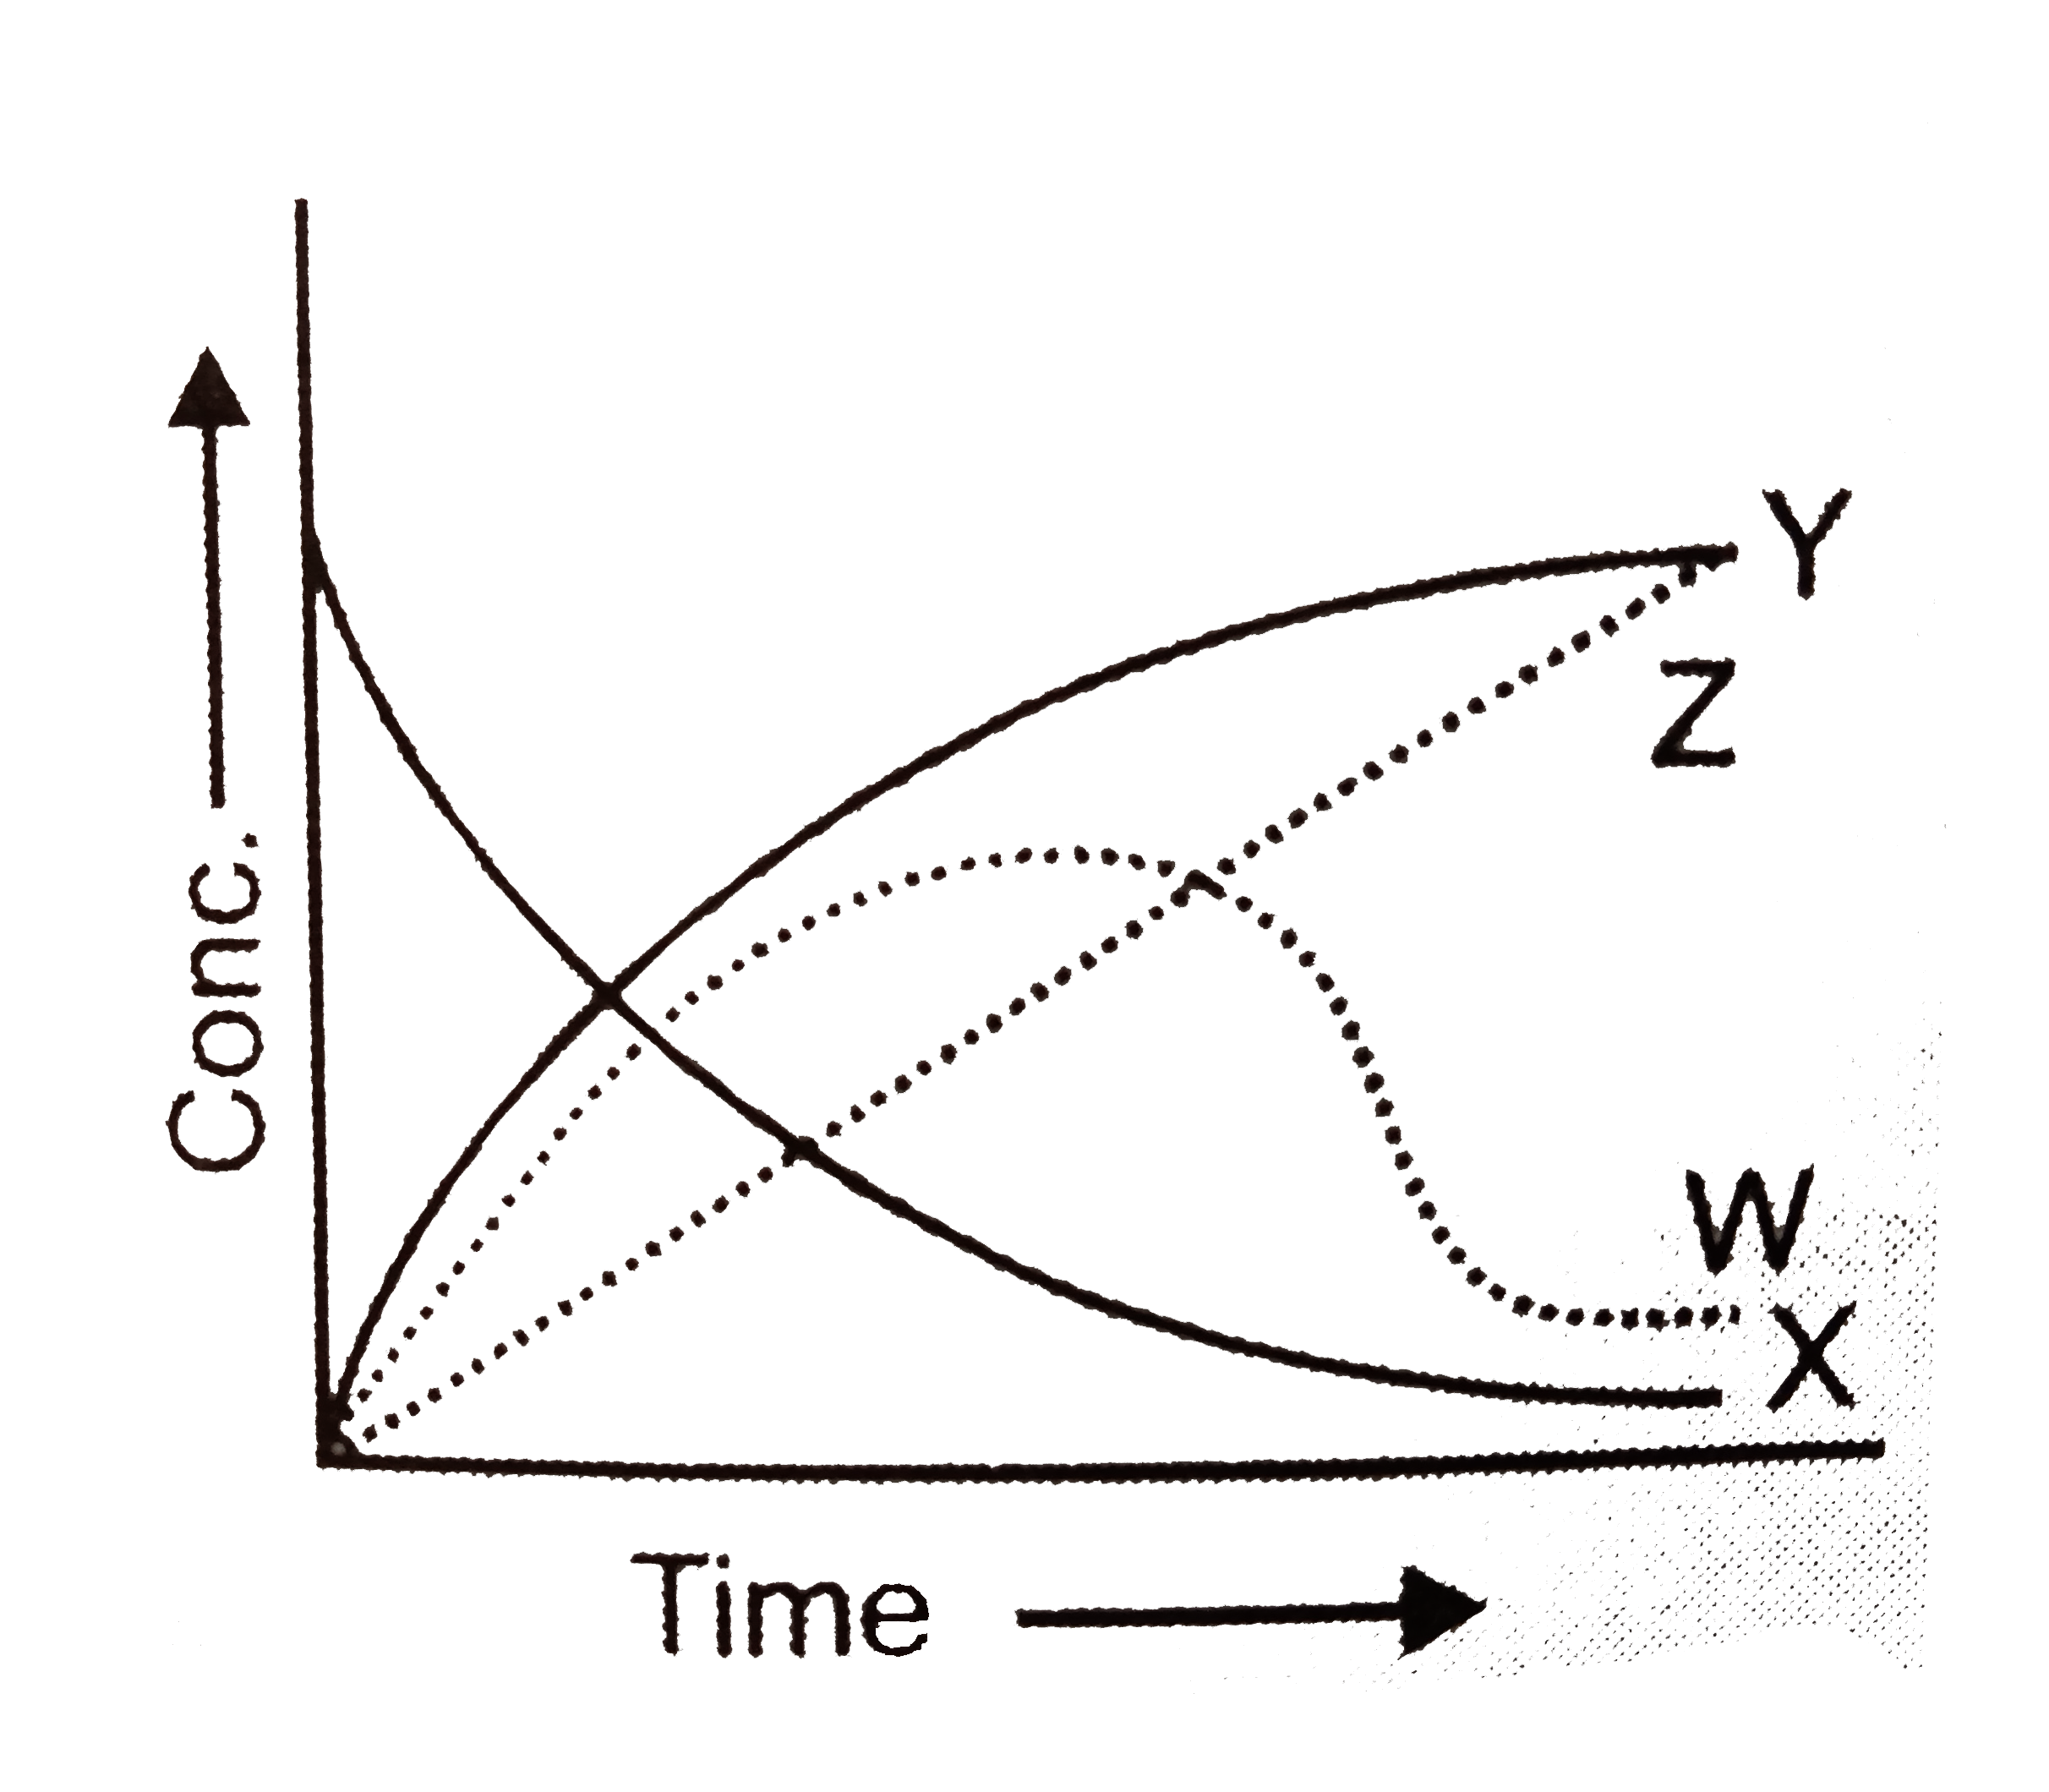
AParabolic curveBSigmoid curveCUpright lineDHorizontal lineFor the reaction, A+B→C+D. The variation of the concentration of the products with time is given by the curve:
 AXBYCZDW
The rate of decay (R) of nuclei in a radioactive sample is plotted against time (t). Which of the following best represents the resulting curve ?
View SolutionFor a given reaction the logarithm of the concentration of the reactant plotted against time gave a straight line with negative slope . The order of the reaction is
View SolutionFor a zero order reaction, the plot of concentration versus time is linear with
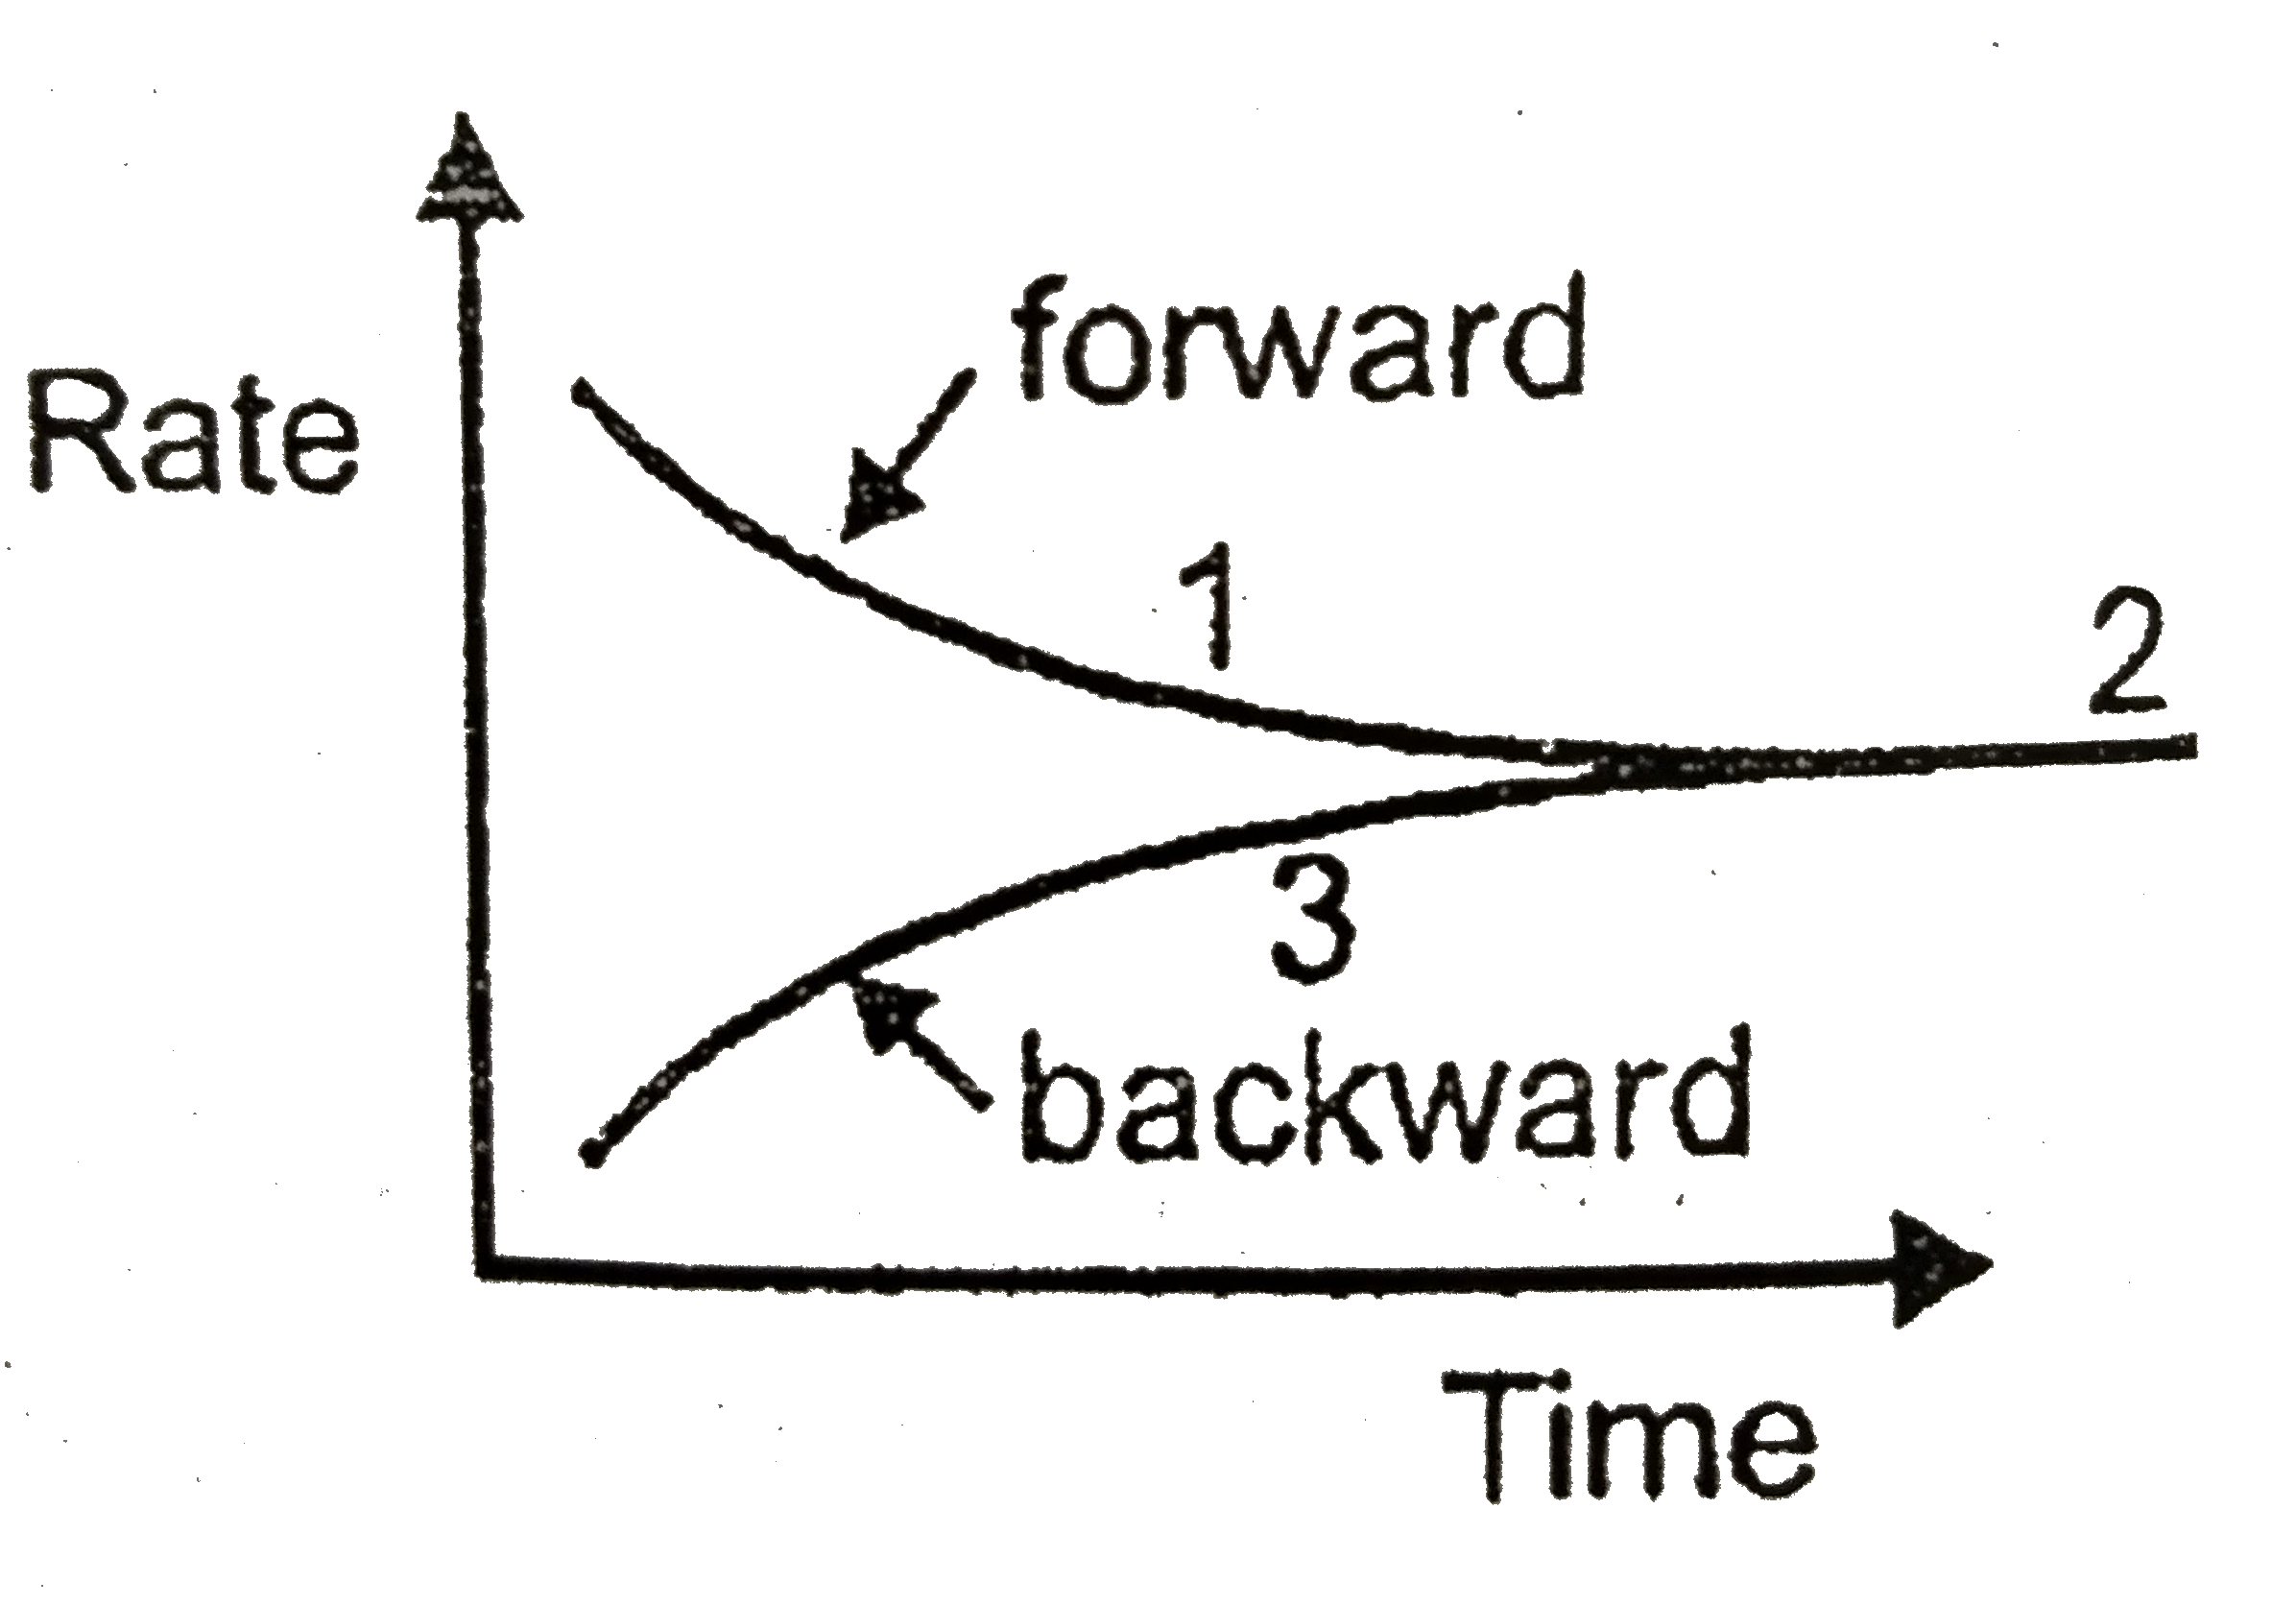
View SolutionIn the reaction
PCl5(g)⇔PCi3(g)+Ci2(g)
a graph in plotted to show the variation of rate of forward and backward reactions against time. Which of the following is correc?

Q>KQ=KQ<K
View SolutionA sound source, emitting sound of constant frequency, moves with a constant speed and crosses a stationary observer. The frequency (n) of sound heard by the observer is plotted against time (t). Which of the following graphs represents the correct variation :-
View Solution
