The rate of decay (R) of nuclei in a radioactive sample is plotted against time (t). Which of the following best represents the resulting curve ?
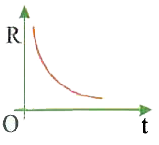
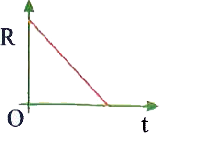
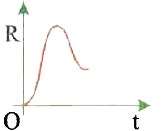
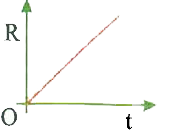
The correct Answer is:A
Step by step video, text & image solution for The rate of decay (R ) of nuclei in a radioactive sample is plotted against time (t). Which of the following best represents the resulting curve ? by Physics experts to help you in doubts & scoring excellent marks in Class 12 exams.
Updated on:21/07/2023Topper's Solved these Questions
- NUCLEI BOOK - NARAYNACHAPTER - NUCLEI EXERCISE - ASSERTION & REASON
5 Videos
- NUCLEI BOOK - NARAYNACHAPTER - NUCLEI EXERCISE - EXERCISE-3
30 Videos
- NUCLEAR PHYSICSBOOK - NARAYNACHAPTER - NUCLEAR PHYSICSEXERCISE - LEVEL-II-(H.W)
9 Videos
- RAY OPTICS AND OPTICAL INSTRAUMENTS BOOK - NARAYNACHAPTER - RAY OPTICS AND OPTICAL INSTRAUMENTS EXERCISE - EXERCISE- 4 One or more than one correct answer type
13 Videos
Similar Questions
A piece of cork starts from rest at the bottom of a lake and floats up. Its velocity v is plotted against time t. Which of the following best represents the resulting curve?
_S01_061_Q01.png)
View SolutionA thin, straight conductor lies along the axis of a hollow conductor of radius R. The two carry equal currents in the same direction. The magnetic field B is plotted against the distance r from the axis. Which of the following best represents the resulting curve?
View Solution
Knowledge Check
An ideal cell is connected to a capacitor through a voltmeter. The reading V of the voltmeter is plotted agains time. Which of the following best represents the resulting curve?
A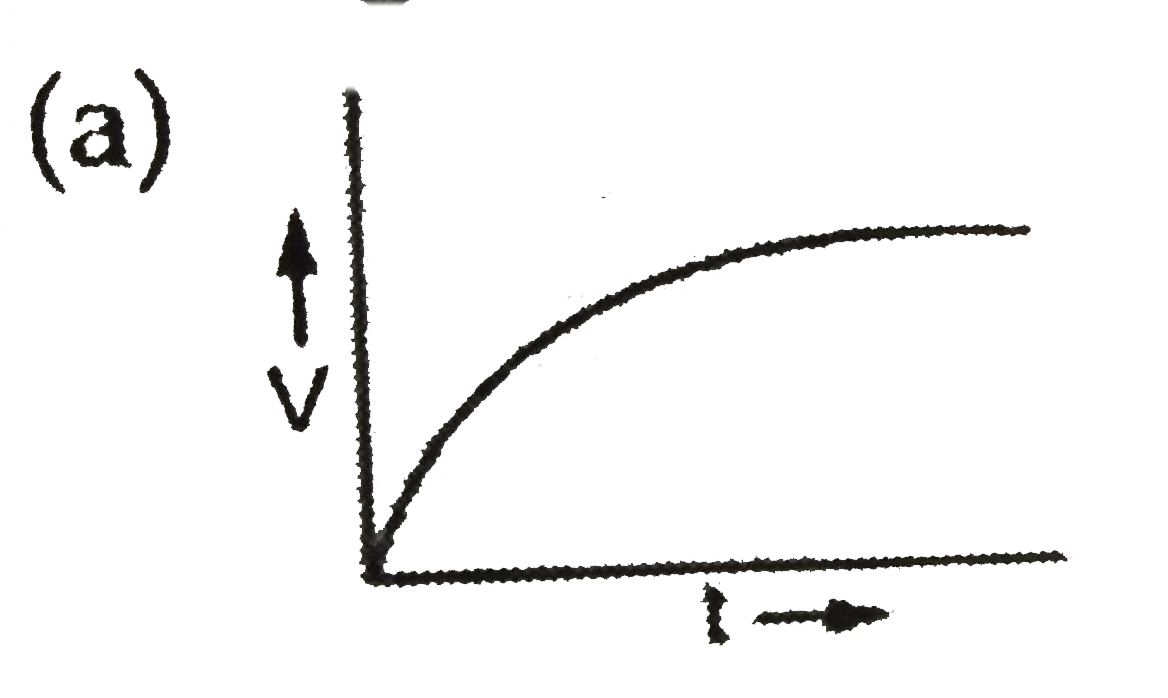 B
B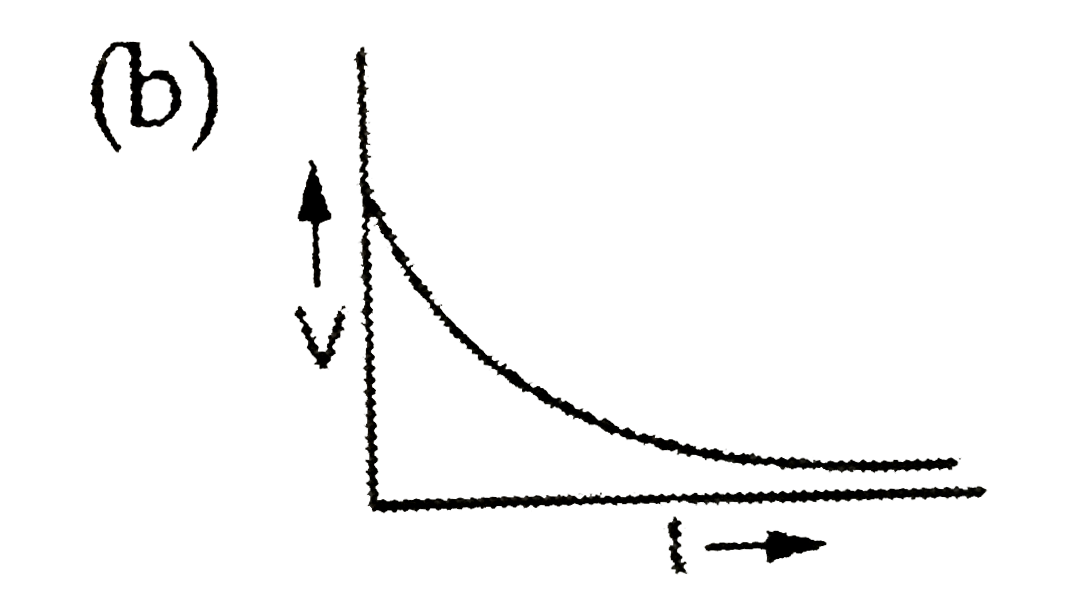 C
C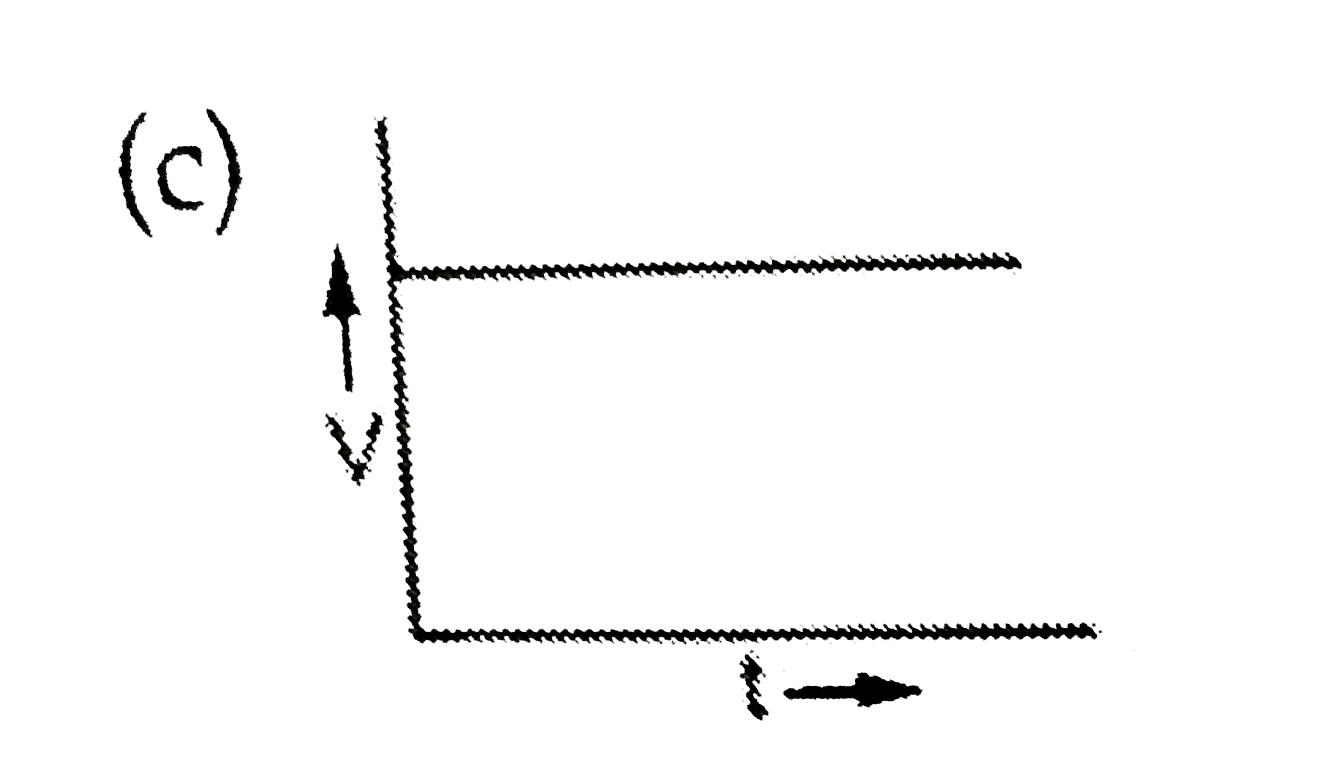 D
D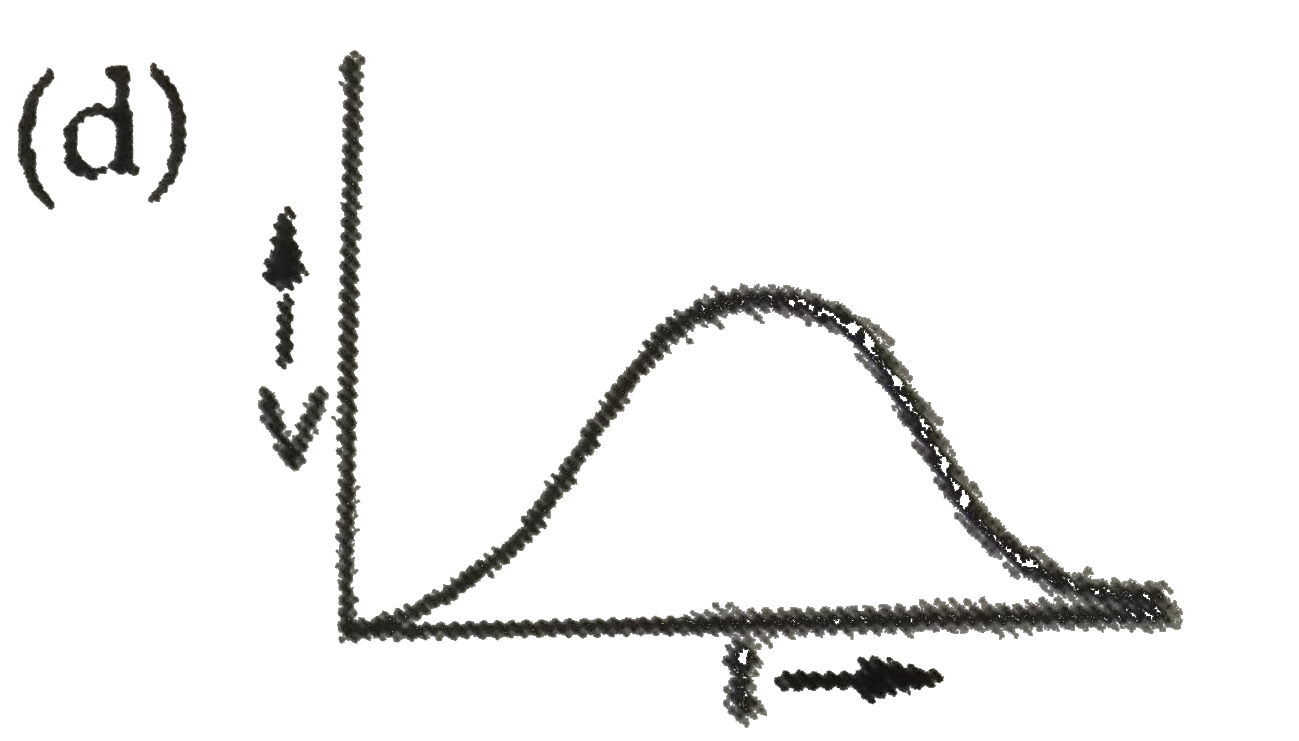
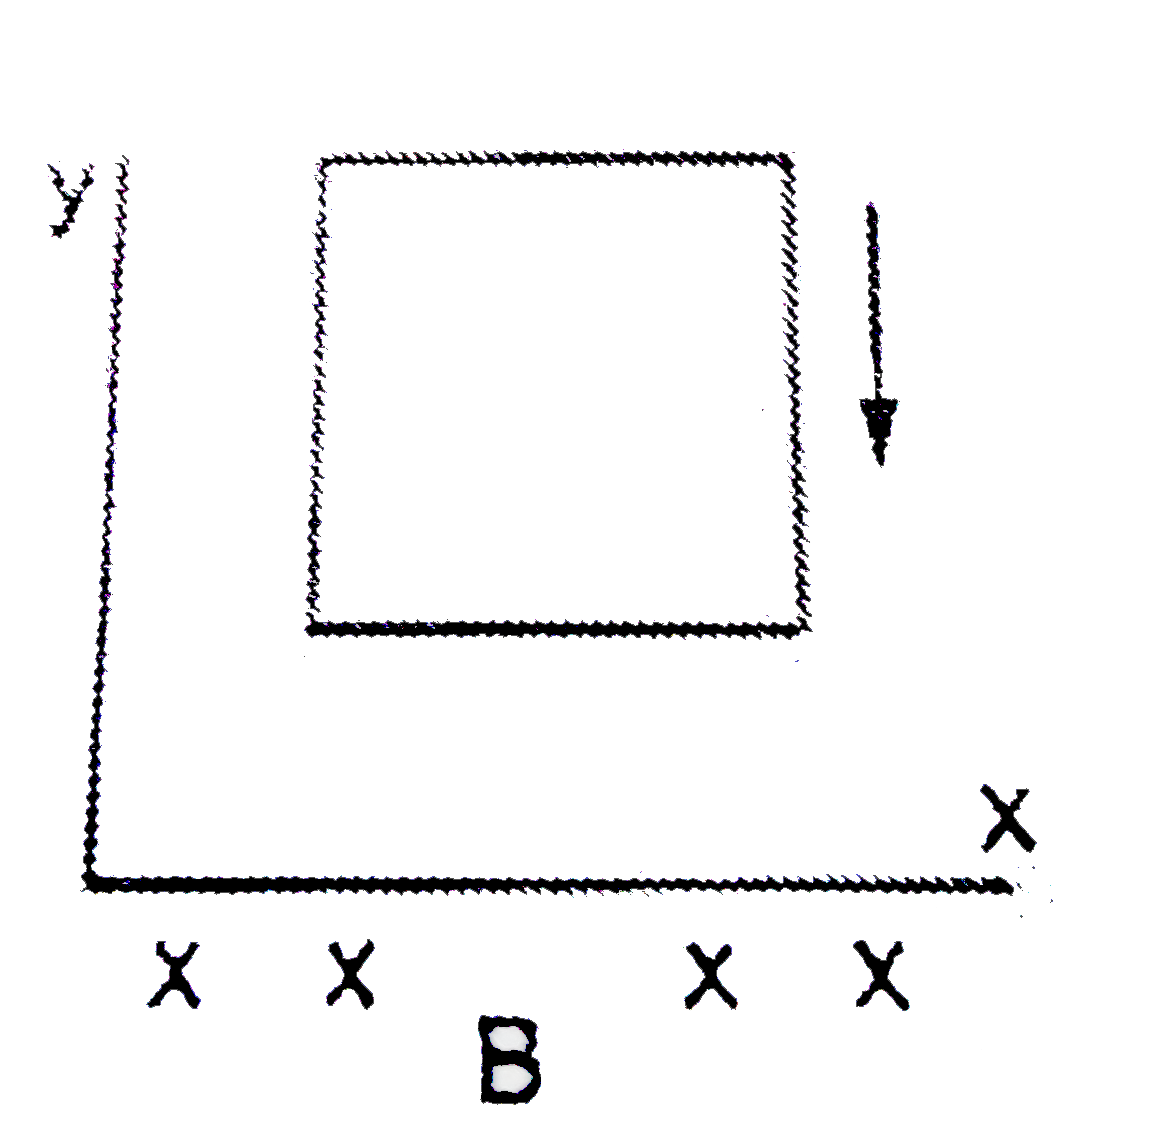
A square, conducting loop falls from rest in the xy-plane. There is a uniform magnetic field in the z-direction below the x-axis. The velocity v of the loop is plotted against time t. Which of the following best represents the resulting curveA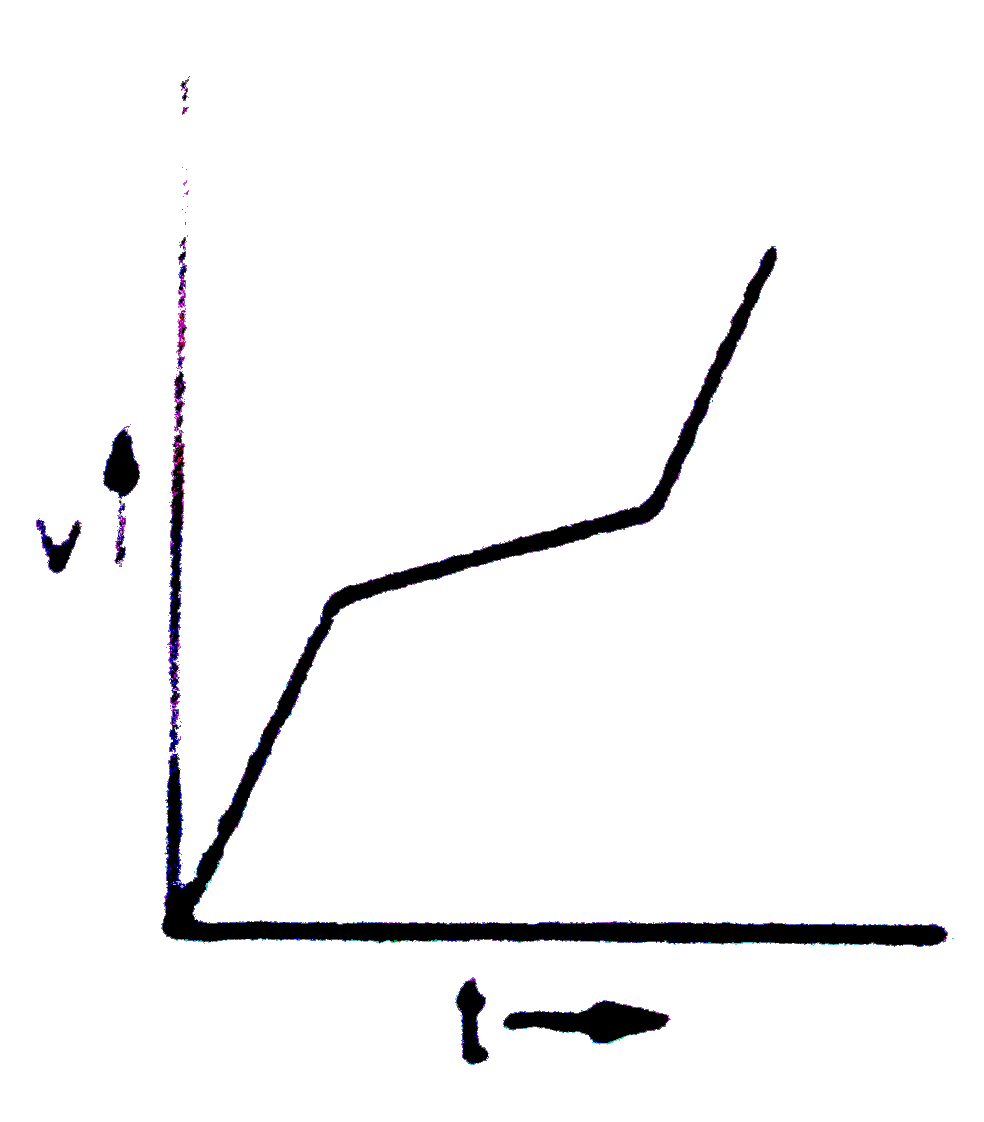 B
B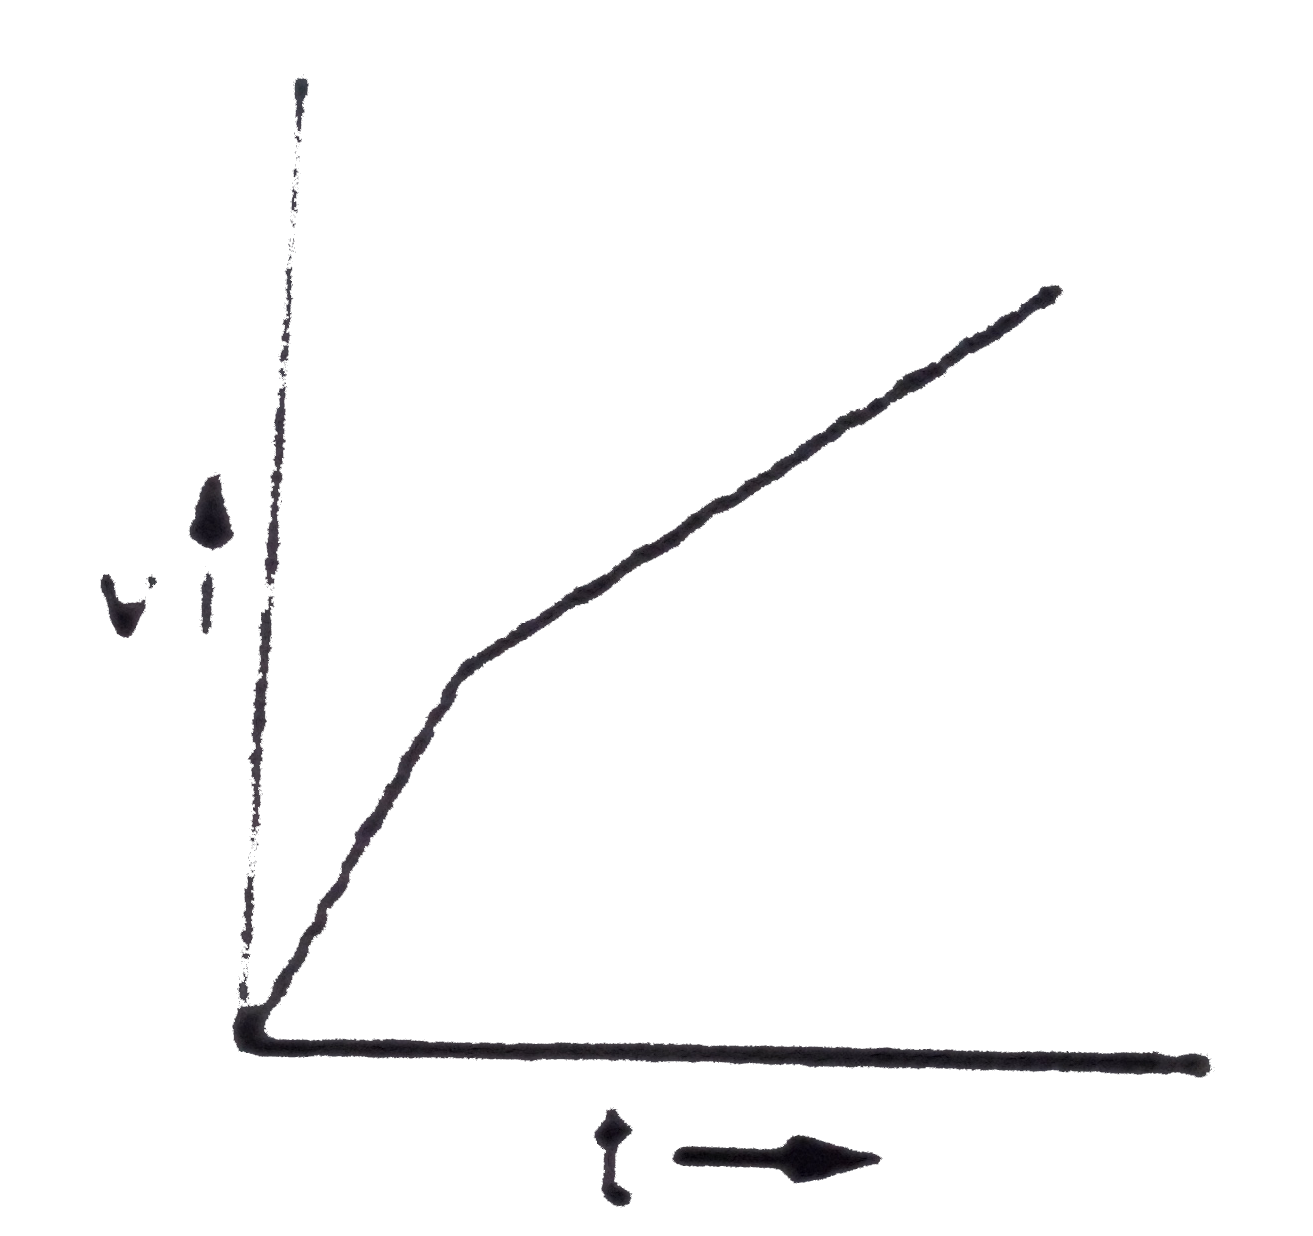 C
C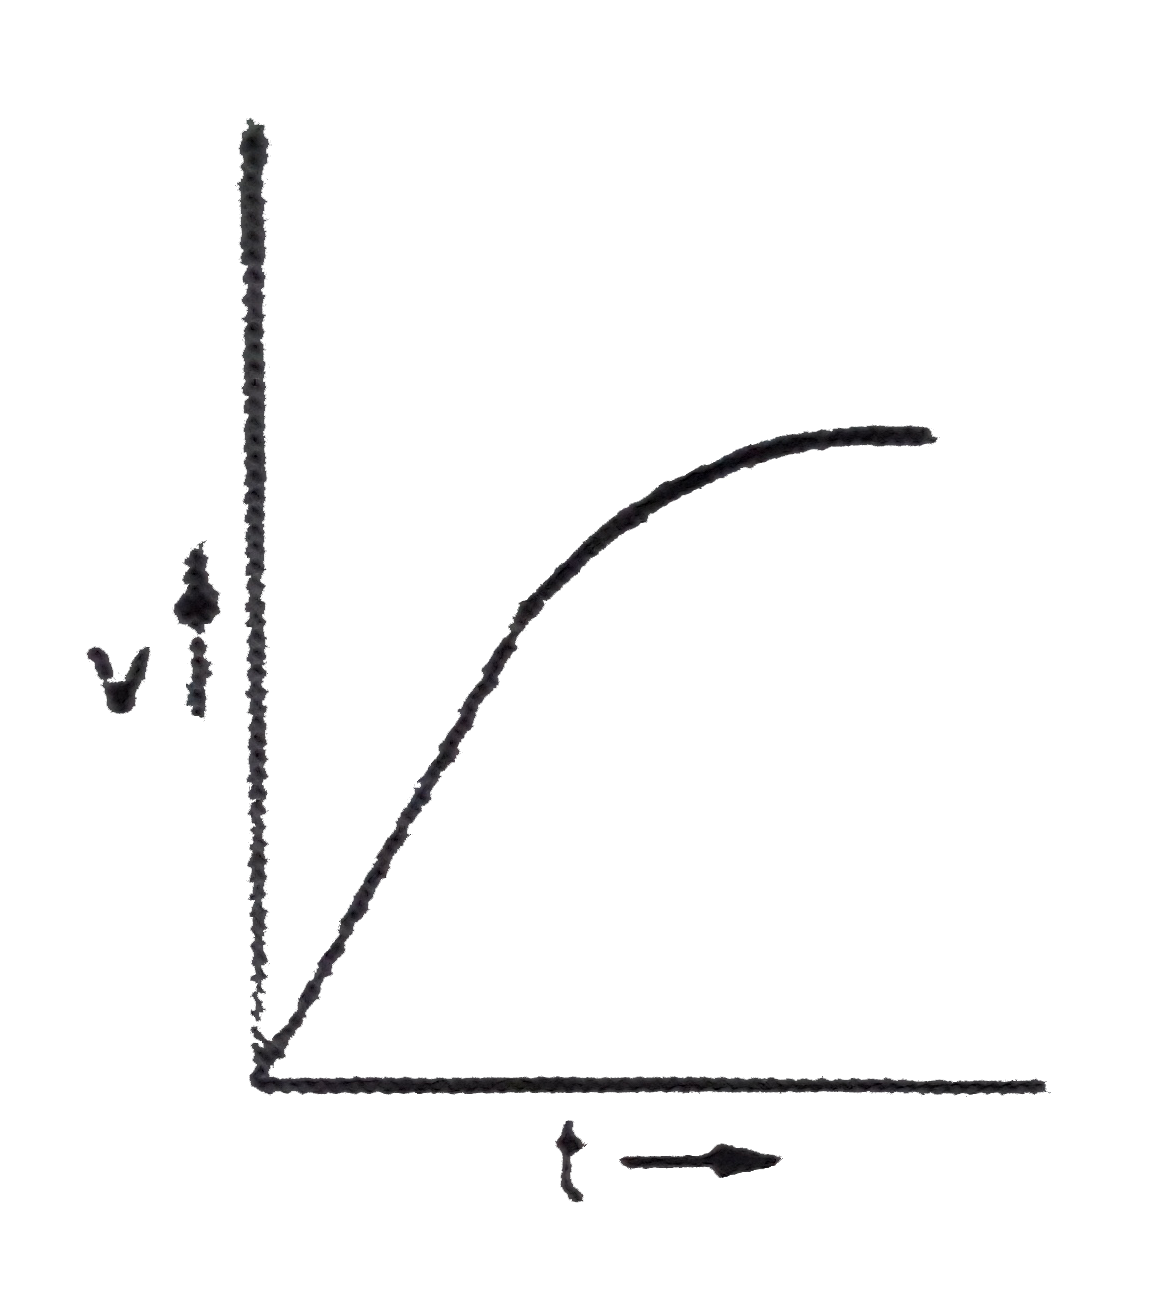 D
D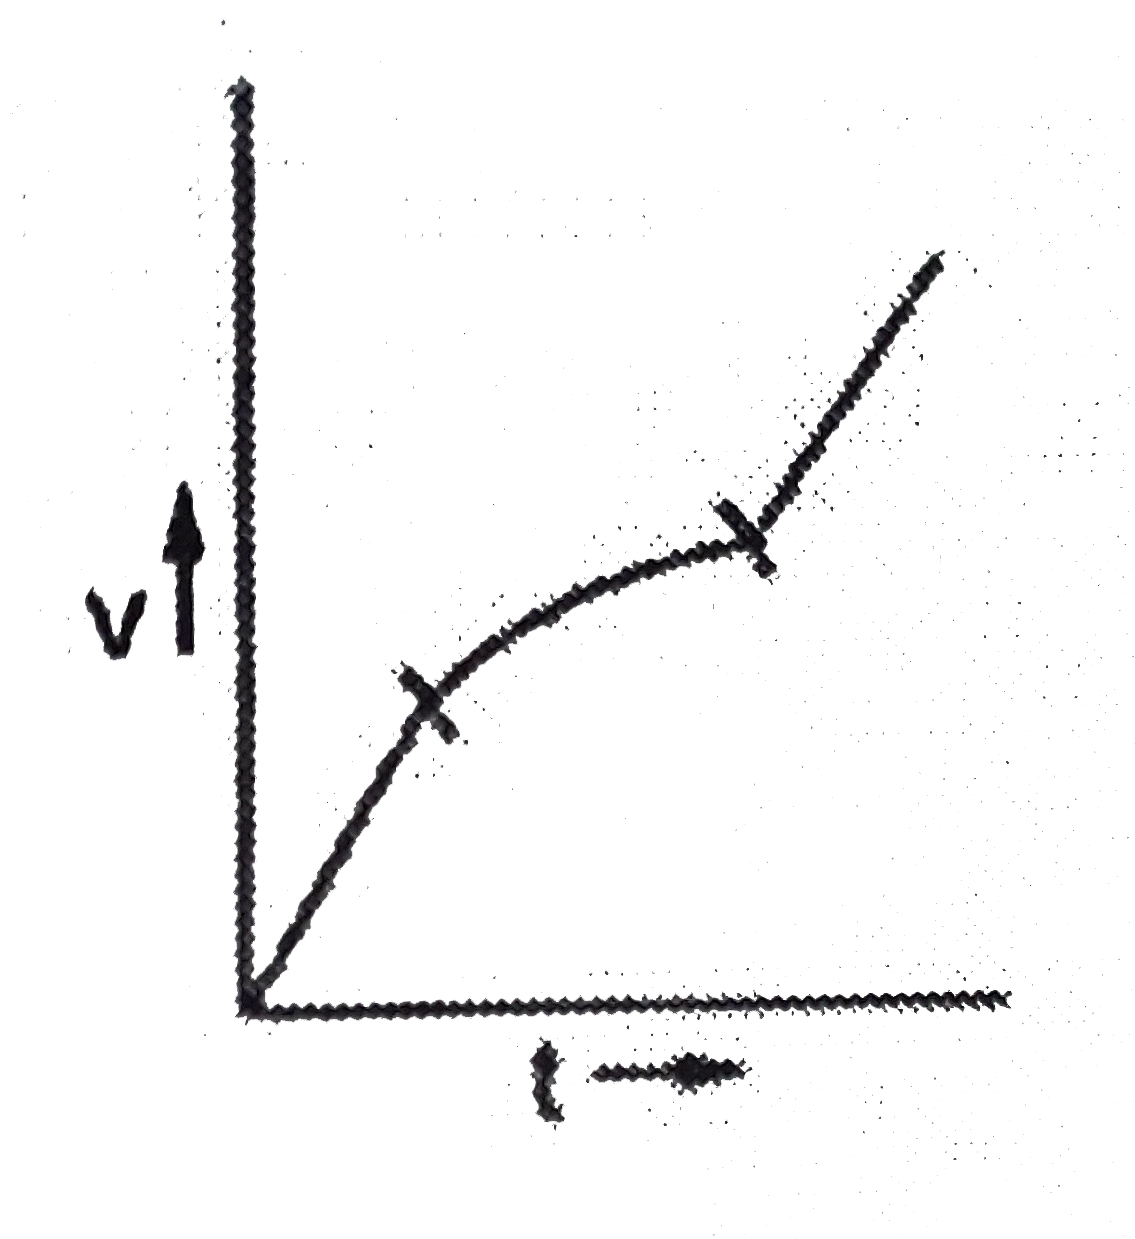
A long bar magnet moves with constant velocity along the axis of a fixed metal ring. It stars form a large distance from the ring, passes through the ring and then moves away far from the ring. The current i flowing in the ring is plotted against time t. Which of the following best represents the resulting curve?
A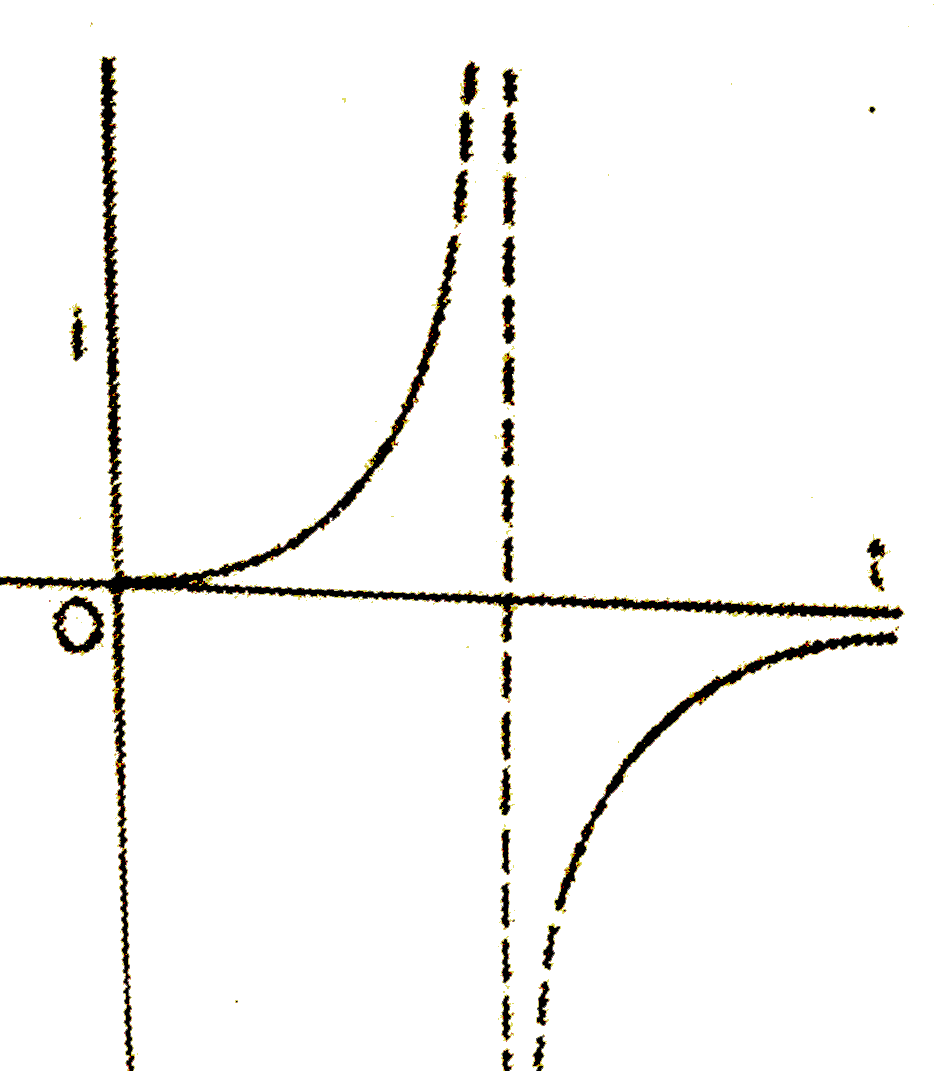 B
B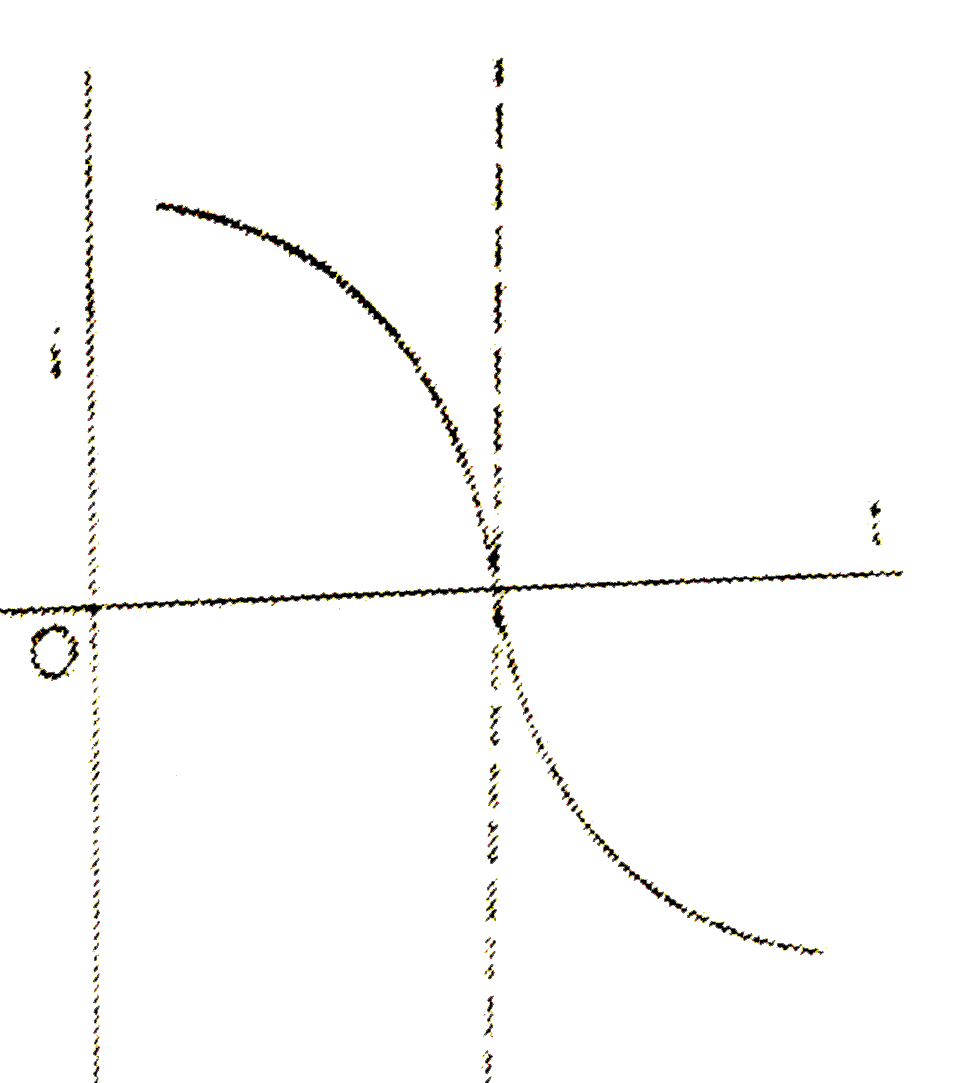 C
C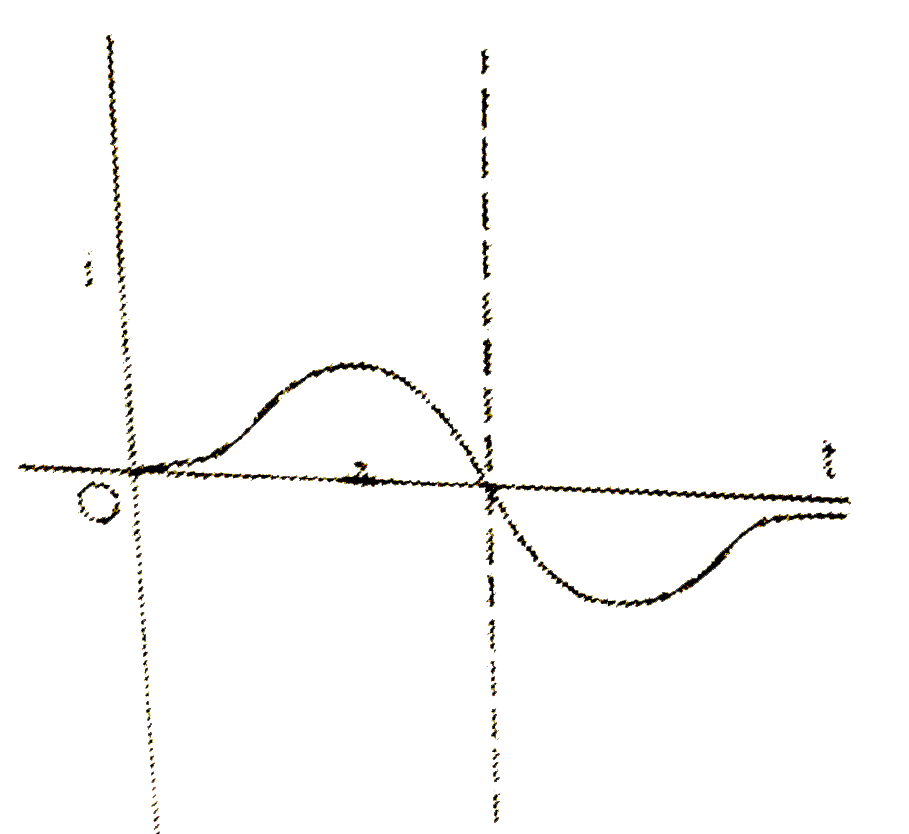 D
D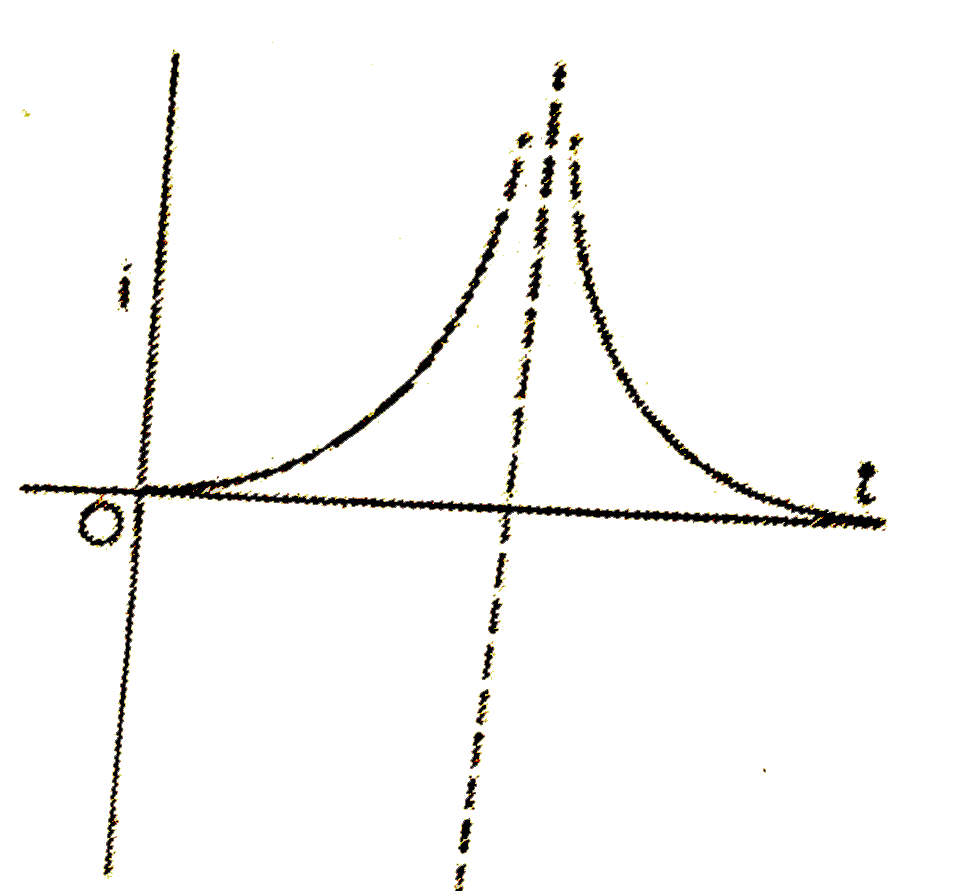
An inductor and a capacitor are joined in series to an AC source. The frequency of the AC is gradually increased. The phase difference φ between the emf and the current is plotted against nthe angular frequency ω. Which of the following best represents the resulting curve?
View SolutionIn an LR circuit connected to a battery, the rate at which energy is stored in the inductor is plotted against time during the growth of current in the circuit. Which of the following best represents the resulation curve?
View SolutionThe variation of decay rate of two radioactive samples A and B with time is shown in fig.
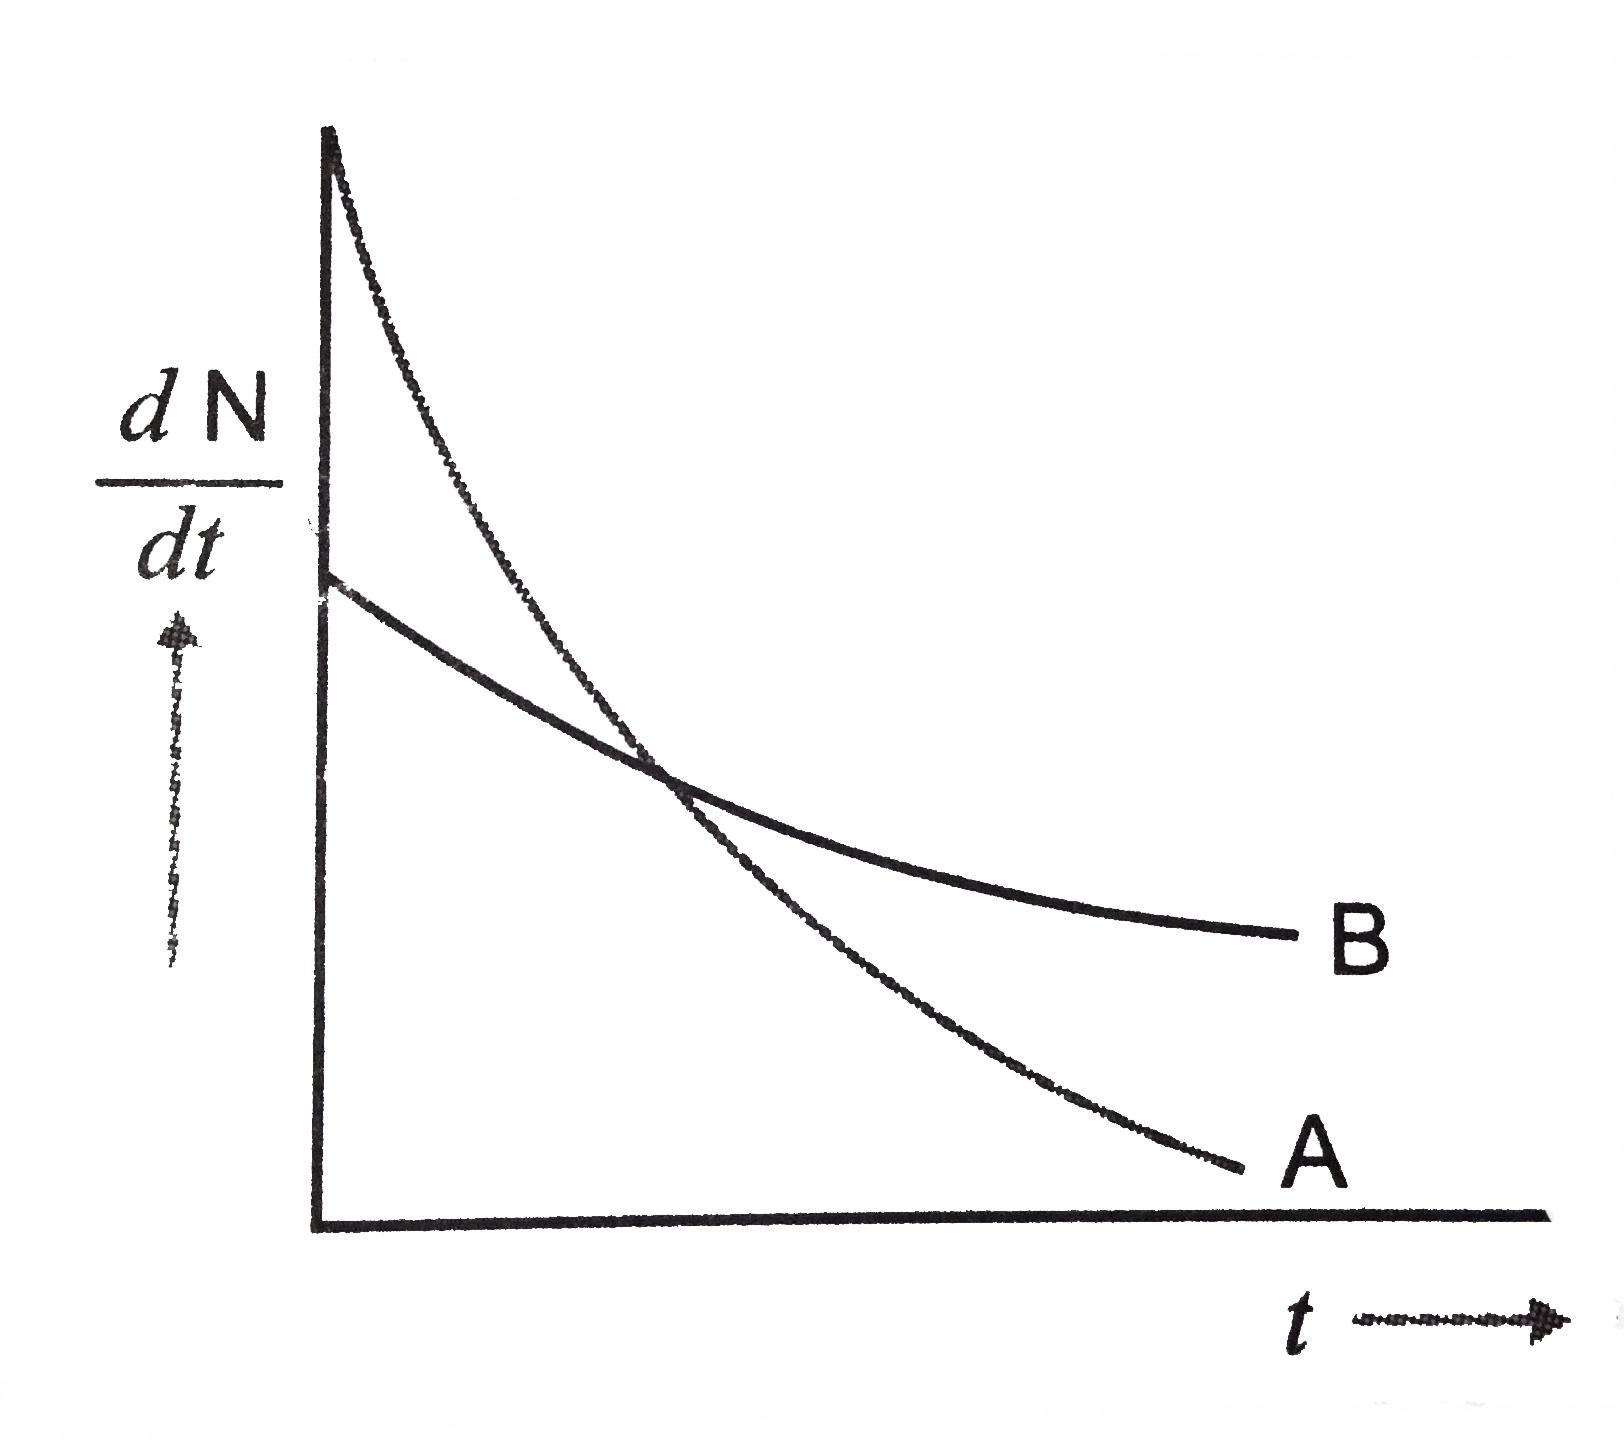
Which of the following statements are true?
View SolutionWhen an electric heater is switched on, the current flowing through it ( i ) is plotted against time ( t ). Taking into account the variation of resistance with temperature, which of the following best represents the resulting curve
View SolutionA solid sphere of radius R is charged uniformly. The electrostatic potential V is plotted as a function of distance r from the centre of th sphere. Which of the following best represents the resulting curve?
View Solution
