Wave function of an orbital is plotted against the distance from nucleus 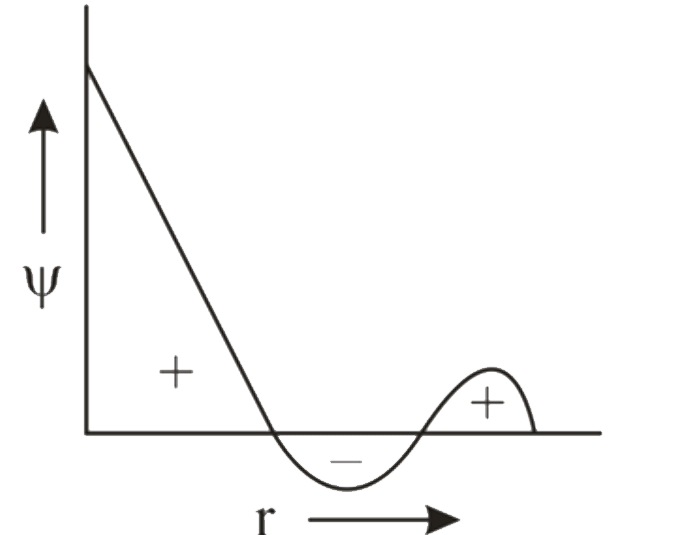
The graphical representation is of
3p
2s
2p
3s
The correct Answer is:D
Step by step video, text & image solution for Wave function of an orbital is plotted against the distance from nucleus The graphical representation is of by Chemistry experts to help you in doubts & scoring excellent marks in Class 12 exams.
Updated on:21/07/2023Topper's Solved these Questions
Similar Questions
Knowledge Check
The Schrodinger wave equation for H-atom is
∇2Ψ=8π2mh2(E−V)Ψ=0
Where ∇2=∂2∂x2+∂2∂y2+∂2∂z2
E = Total energy and V=potential energy wave function Ψ(rθϕ)R(r)Θ(θ)Φ(ϕ)
R is radial wave function which is function of ''r'' only, where r is the distance from nucleus. Θ and Φ are angular wave function. R2 is known as radial probability density and 4πr2R2dr is known as radial probability function i.e., the probability of finding the electron is spherical shell of thickness dr.
Number of radial node =n -l - 1
Number of angular node = l
For hydrogen atom, wave function for 1s and 2s-orbitals are:
Ψ1s=√1πaa0e−zr/a0
Ψ2s=(Z2a0)½(1−Zra0)e−Zra0
The plot of radial probability function 4πr2R2 aganist r will be:
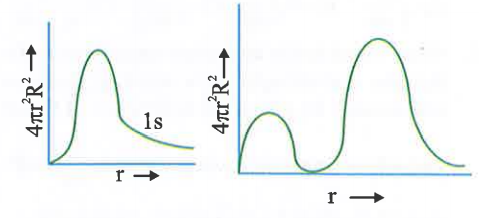
Answer the following questions:
The following graph is plotted for ns-orbitals
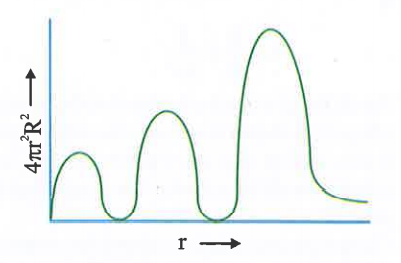
The value of 'n' will be:A1B2C3D4Angular wave function of Px orbital is : (Given : 0 is angle from z-axis)
A(34π)1/2sin 0 sinϕB(34π)1/2sin 0 cosϕC(34π)1/2cos0D(154π)1/2sin 0 cos0cosϕ_S01_027_Q01.png)
If the law of gravitation be such that the force of attraction between two particles vary inversely as the 5/2th powr of their separation then the graph of orbital velocity v0 plotted against the distance r of a satellite from the earth's centre on a log-log scale is shown alongside the slope oline will beA−54B−52C−34D−1
A particle is projected at t=0 from a point on the ground with certain velocity at an angle with the horizontal. The power of gravitation force is plotted against time. Which of the following is the best representation?
View SolutionA particle is projected at t=0 from a point on the ground with certain velocity at an angle with the horizontal. The power gravitational force is plotted against time. Which of the following is the best representation ?
View SolutionIn the given table, Column I gives description of waves characteristics, Column II gives their characteristic and Column II shows their graphical representation.

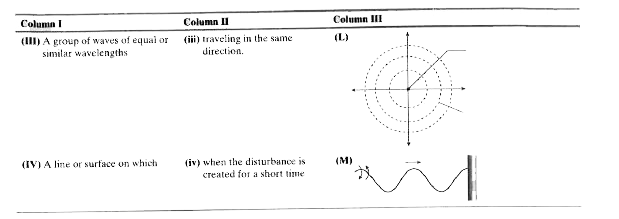
What are the characteristics of a wave function?
View SolutionIn the given table, Column I gives description of waves characteristics, Column II gives their characteristic and Column II shows their graphical representation.

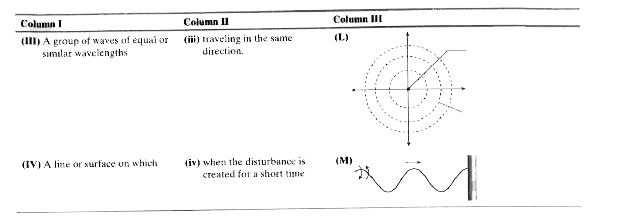
What are the characteristics of a wave front?
View SolutionIn the given table, Column I gives frequencies of different waves, Column II gives their examples and Column III gives their graphical representation.
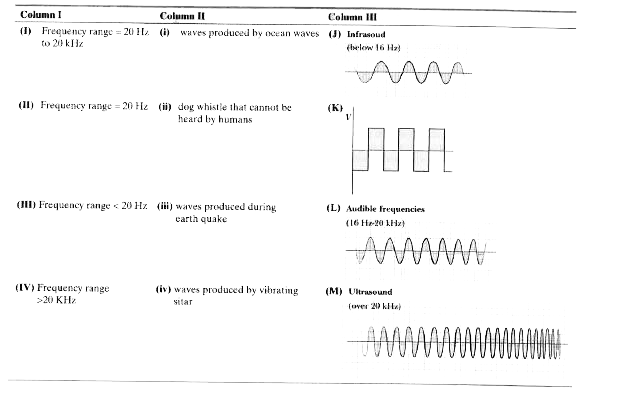
What are the characteristics of ultrasonic waves?
View Solution
