Which In K vs 1/T plot is correct for an equilibrium that shits toward reactants at higher temperatures?
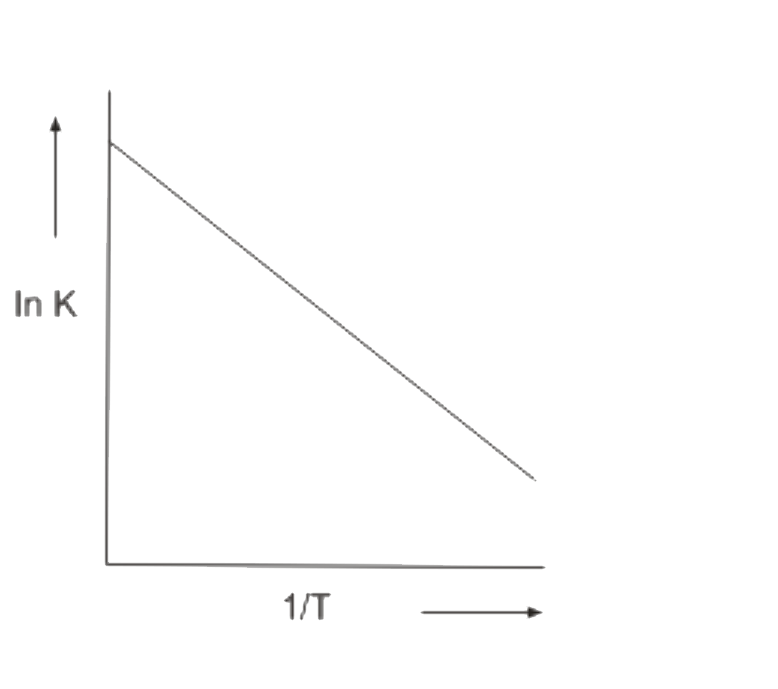
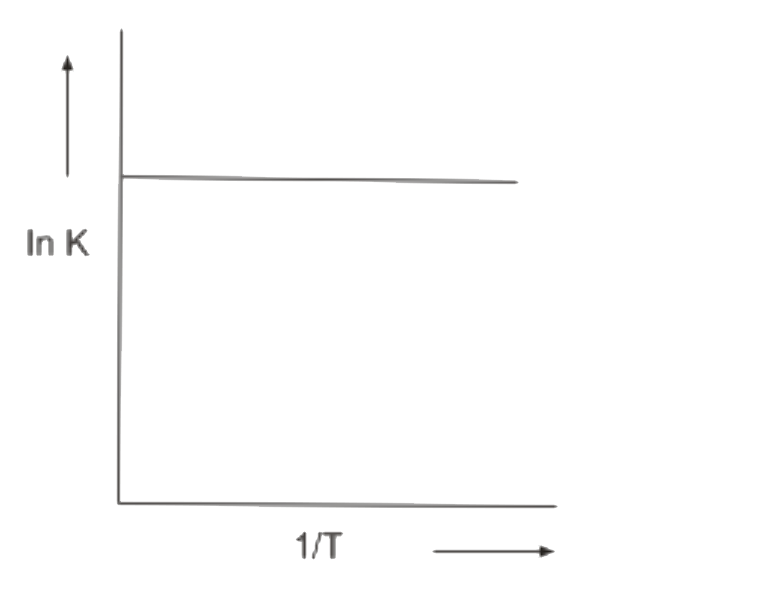
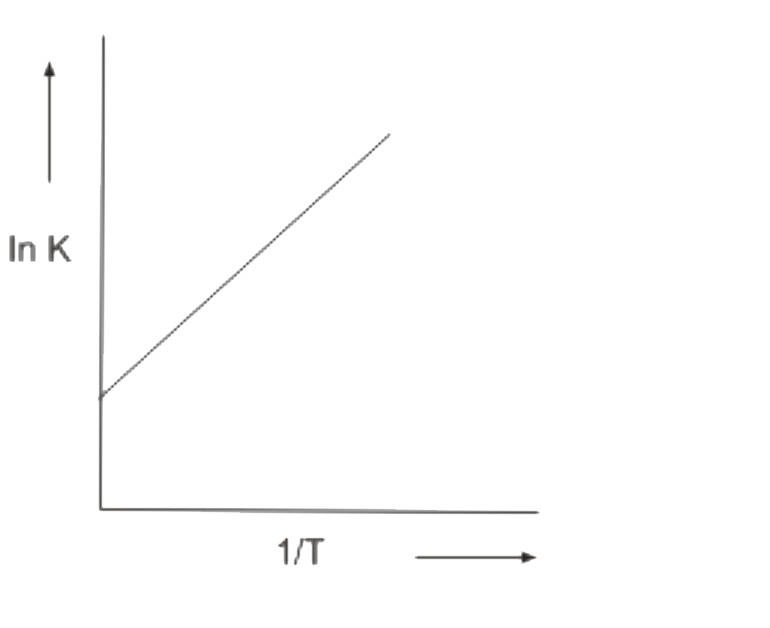
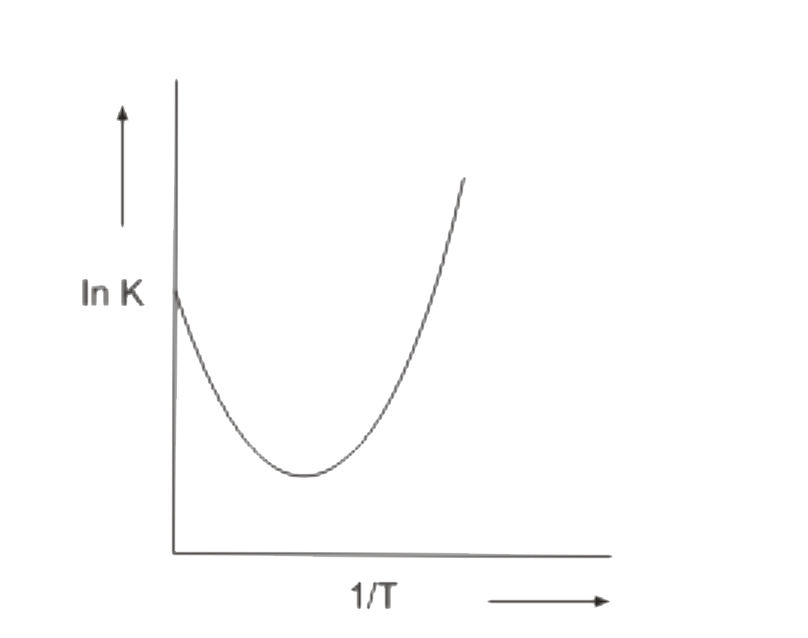
The correct Answer is:C
To solve the question regarding the plot of ln K versus 1/T for an equilibrium that shifts toward reactants at higher temperatures, we can follow these steps:
1. Understanding the Reaction Shift:
- When the equilibrium shifts toward the reactants at higher temperatures, it indicates that the reaction is exothermic. According to Le Chatelier's principle, increasing the temperature will favor the endothermic direction, which in this case is the reverse reaction (toward reactants).
2. Relating Equilibrium Constant to Temperature:
- The relationship between the equilibrium constant (K) and temperature (T) can be described by the van 't Hoff equation:
lnK=−ΔH∘R⋅1T+ΔS∘R
- Here, ΔH∘ is the change in enthalpy, R is the gas constant, and ΔS∘ is the change in entropy.
3. Determining the Sign of ΔH:
- Since the equilibrium shifts toward the reactants at higher temperatures, we conclude that the reaction is exothermic, which means ΔH∘<0.
4. Analyzing the Slope:
- In the equation lnK=−ΔH∘R⋅1T+ΔS∘R, the slope (m) is given by:
m=−ΔH∘R
- Since ΔH∘ is negative, the slope m will be positive.
5. Graph Interpretation:
- The plot of lnK versus 1T will yield a straight line with a positive slope. This means that as 1T increases (which corresponds to decreasing temperature), lnK also increases, indicating that K decreases as temperature increases, consistent with the shift toward reactants.
6. Conclusion:
- Therefore, the plot of lnK versus 1T for an equilibrium that shifts toward reactants at higher temperatures will have a positive slope.
- When the equilibrium shifts toward the reactants at higher temperatures, it indicates that the reaction is exothermic. According to Le Chatelier's principle, increasing the temperature will favor the endothermic direction, which in this case is the reverse reaction (toward reactants).
- The relationship between the equilibrium constant (K) and temperature (T) can be described by the van 't Hoff equation:
lnK=−ΔH∘R⋅1T+ΔS∘R
- Here, ΔH∘ is the change in enthalpy, R is the gas constant, and ΔS∘ is the change in entropy.
- Since the equilibrium shifts toward the reactants at higher temperatures, we conclude that the reaction is exothermic, which means ΔH∘<0.
- In the equation lnK=−ΔH∘R⋅1T+ΔS∘R, the slope (m) is given by:
m=−ΔH∘R
- Since ΔH∘ is negative, the slope m will be positive.
- The plot of lnK versus 1T will yield a straight line with a positive slope. This means that as 1T increases (which corresponds to decreasing temperature), lnK also increases, indicating that K decreases as temperature increases, consistent with the shift toward reactants.
- Therefore, the plot of lnK versus 1T for an equilibrium that shifts toward reactants at higher temperatures will have a positive slope.
Topper's Solved these Questions
Similar Questions
which of the following is/are correct? (A) At equilibrium the concentration of reactants and product are equal
(B) KP=KC(RT)Δn
(C) When the concentration of reactants is doubled the value of equilibrium constant is also doubled
(D) A catalyst doesn't alter the position of the equilibrium
View SolutionPlot ln K vs. 1/T for two reactions A and B are given below. Which reaction is more sensitive to temperature :-
View Solution
Knowledge Check
Which is the correct plot for In k vs 1/T?
A B
B C
C D
D
Which of the plots of ln K vs (1T) is/are correct?
A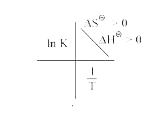 B
B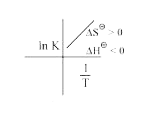 C
C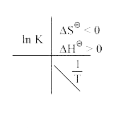 D
D
The correct relation between equilibrium constant (K), standard free energy (ΔG∘) and temperature (T) is
AΔG∘=RTlnKBK=e−ΔG∘/2.303RTCΔG∘=−RTlog10KDK=10−ΔG∘/2.303RT
Choose the correct a vs t graph
View SolutionThe enthalpies of two reactions are ΔH1andΔH2 both positive with ΔH2>ΔH1. If the temperature of reacting system is increased from T1 to T2 predict which of the following alternative is correct? Here k is equilibrium constant at T1andk' is equilibrium constant at T2.
View SolutionFor a given exothermic reaction, KpandK′p are the equilibrium constants at temperatures T1andT2 respectively. Assuming that heat of reaction is constant in temperature range between T1andT2, it is readily water that
View SolutionWhich among the following plots are linear (a -x) is the concentration of reactant remaining after time , t
(a) (a - x) vs t , for a first order reaction
(b) (a - x) vs t , for a zero order reaction
(c) (a - x) vs t , for a second order reaction
(d) 1/(a - x) vs t , for a second order reaction
View SolutionIf K1 is the equilibrium constant at temperature T1andK2 is the equilibrium constant at temperature T2and If T2>T1 and reaction is endothermic then
View Solution
