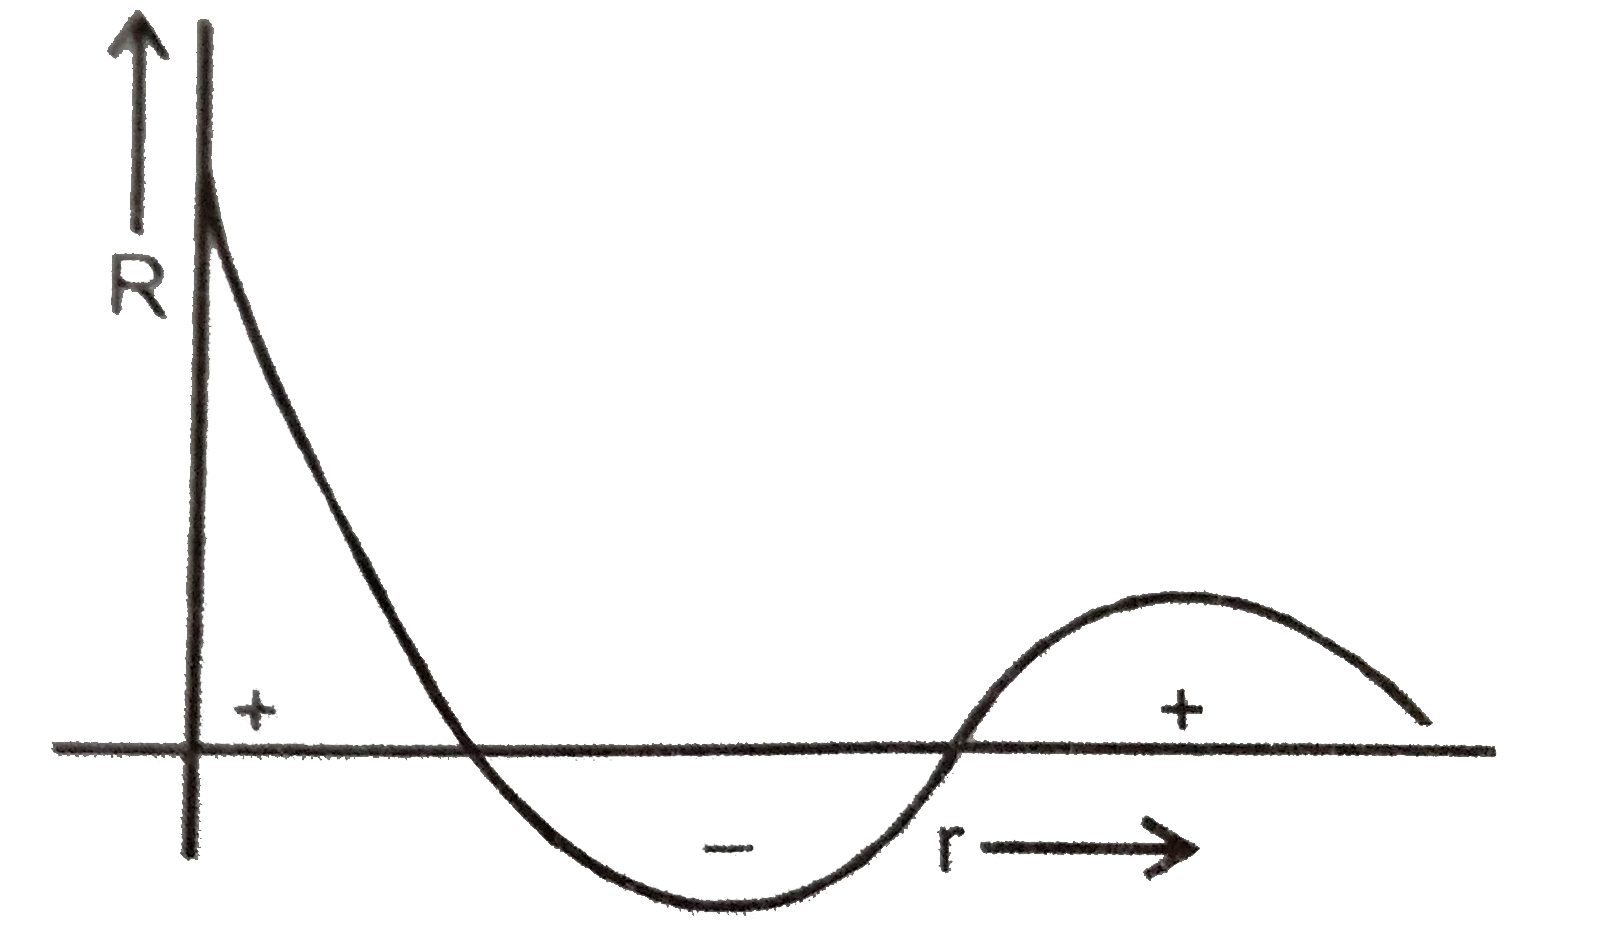
This graphical representation specifics

A
Absorption spectrum
B
Action spectrum
C
both (a) and (b)
D
neither (a) and (b)
Video Solution
Text Solution
The correct Answer is:B
|
Answer
Step by step video & image solution for This graphical representation specifics by Biology experts to help you in doubts & scoring excellent marks in Class 12 exams.
Updated on:21/07/2023Topper's Solved these Questions
Similar Questions
Knowledge Check
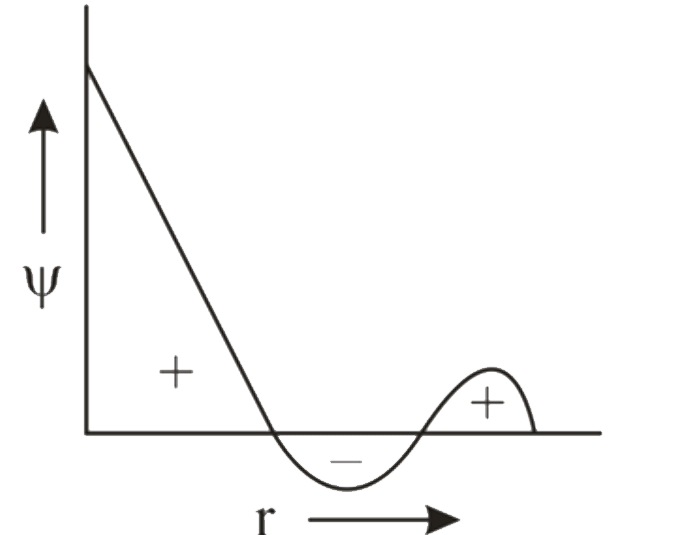
Wave function of an orbital is plotted against the distance from nucleus

The graphical representation is ofA3pB2sC2pD3sEllingham diagram is a graphical representation of :
AΔH vs TBΔG vs TCΔG vs PD(ΔG−TΔS) vs TWhich is a graphical representation of an application ?
AWindows 95BWindows ExplorerCTaskbarDNone of these
Explain graphical representations of the first order reaction.
View SolutionDraw the graphical representation of simple harmonic motion, showing the acceleration-time curve.
View SolutionThe two lines 4 x + 3y =0 and 7x + 5y = 0 will _______ in their graphical representation
View SolutionWhich is not the graphical representation for the zeroth order reaction ?
View SolutionA particle executes SHM. Then the graph of velocity as a function of displacement is
View Solution

