On a graph paper , we have plotted the oxygen haemoglobin curve of hemoglobin seen in the embryonic stage. A new oxygen hemoglobin curve of hemoglobin seen in a 10 - year - old child is plotted on the same graph paper. with respect to this graph, which one of the following statements is correct ?
The new curve is on the right of the old
The new curve is on the left of the old curve.
The new curve completely overlaps the old curve.
Data is insufficient to comment on the position of graphs
The correct Answer is:A
Step by step video, text & image solution for On a graph paper , we have plotted the oxygen haemoglobin curve of hemoglobin seen in the embryonic stage. A new oxygen hemoglobin curve of hemoglobin seen in a 10 - year - old child is plotted on the same graph paper. with respect to this graph, which one of the following statements is correct ? by Biology experts to help you in doubts & scoring excellent marks in Class 12 exams.
Updated on:21/07/2023Topper's Solved these Questions
Similar Questions
30 metallic cylinders of same size are melted and cast in the form of cones having the same radius and height as those of the cylinders. Consider the following statements :
Statement I : A maximum of 90 cones will be obtained.
Statement II : The Curved surface of the cylinder can be flattened in the shape of a rectangle but the curved surface of the cone when flattened has the shape of triangle. which one of the following is correct in respect of the above ?
View SolutionA graph is plotted between log(x/m) and log P according to the equation xm=kP1n
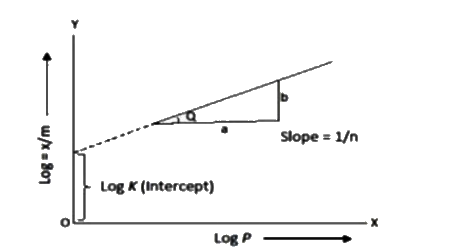
Which of the following statements about this graph is not correct?
View Solution
Knowledge Check
The following is a graph plotted between the vapour pressure of two volatile liquids against their respective mole fractions. Which of the following statements is/are correct?
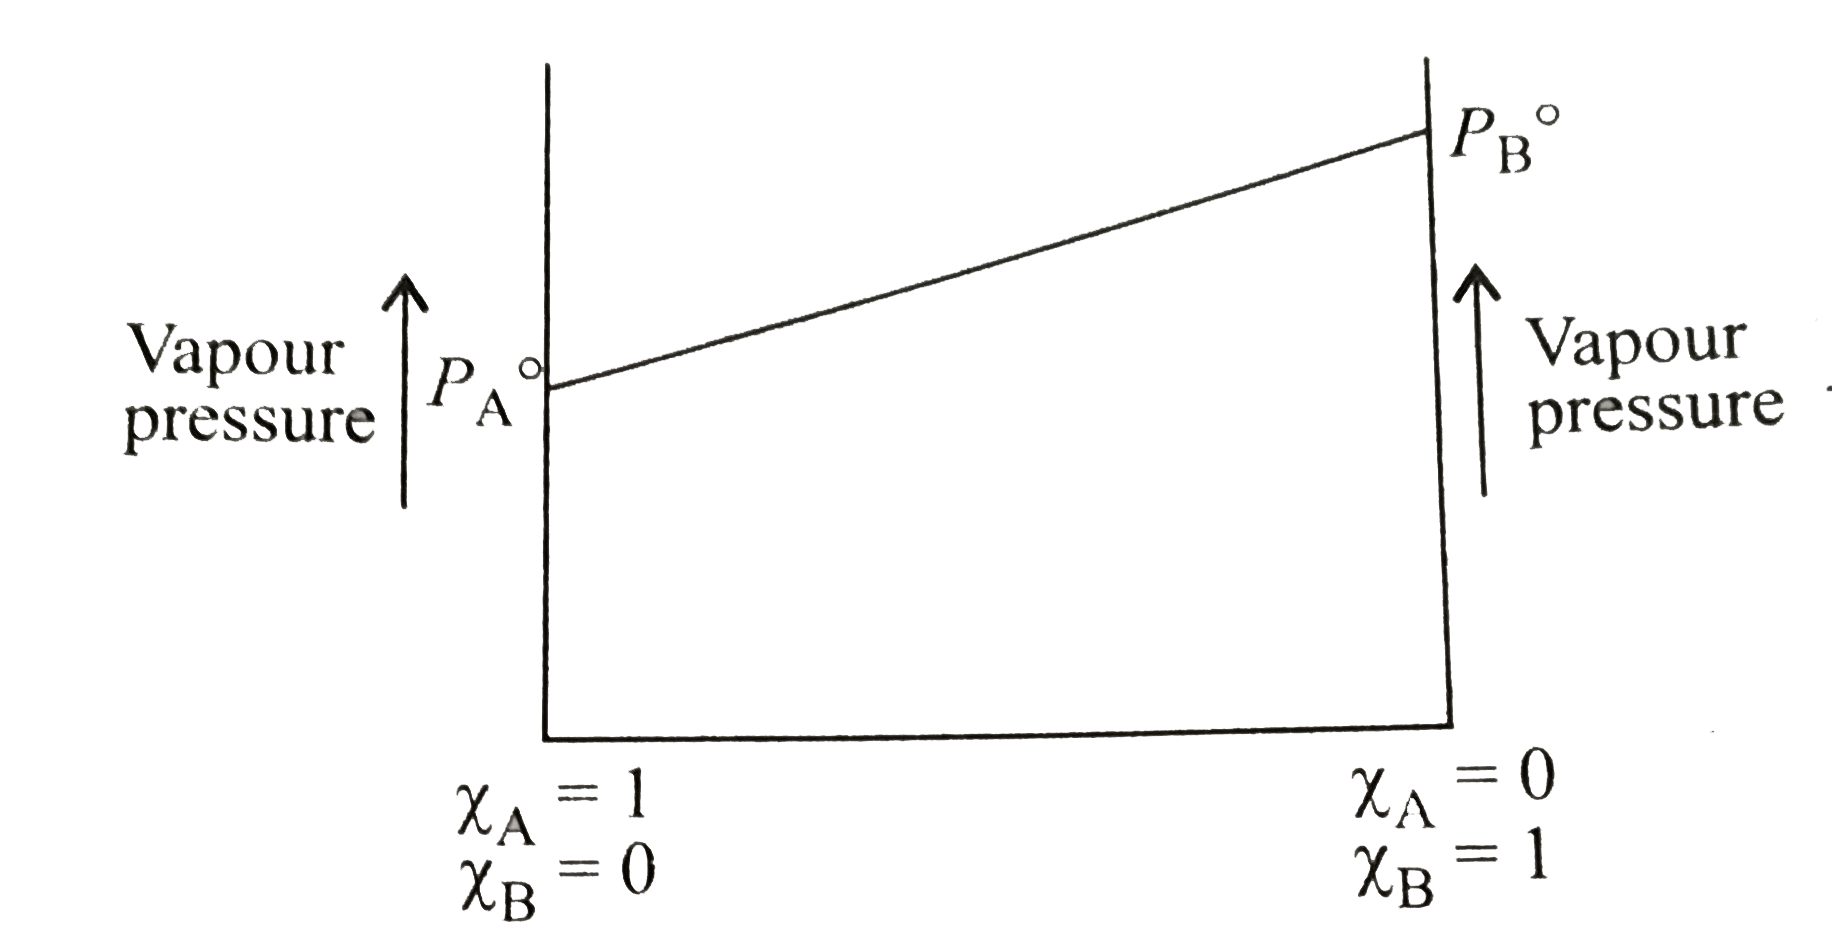 AWhen χA=1 and χB=0, then P=P∘A.BWhen χB=1 and χA=0, then P=P∘B.CWhen χA=1 and χB=0, then P<P∘.DWhen χB=1 and χA=0, then P>P∘.
If a graph is plotted between log V and log T for 2 moles of a gas of constant pressure of 0.0821 atm, then which of the following statements are correct?
AThe curve is straight line with slope -1.BThe curve is straight line with slope +1CThe intercept on y-axis is equal to 2.DThe intercept on y-axis is equal to 0.3010.The distance v of the real image formed by a convex lens is measured for various object distance u . A graph is plotted between v and u , which one of the following graphs is correct
A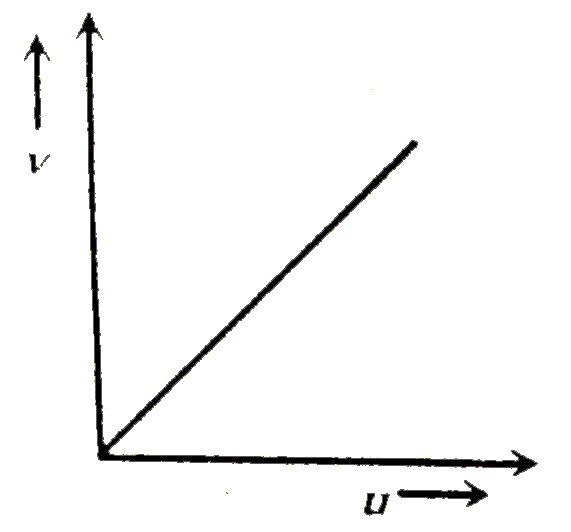 B
B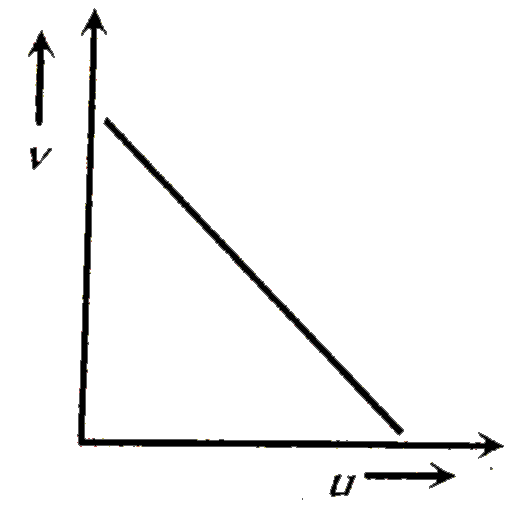 C
C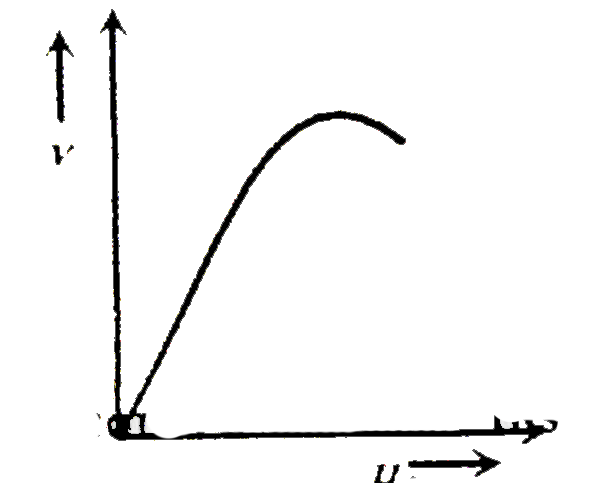 D
D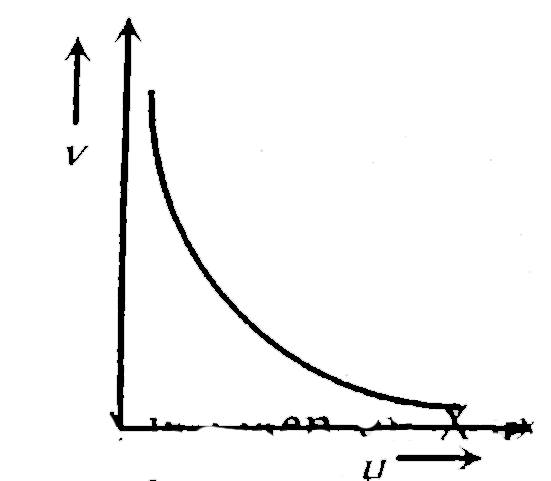
A solenoid is a long helical coil of wire through which a current is runs in order to create a magnetic field. The magnetic field of the solenoid is the superposition of the fields due to the current through each coil. It is nearly uniform inside the solenoid and close to zero outside and is similar to the field of a bar magnet having a north pole at one end and a south pole at the other depending upon the direction of current flow. The magnetic field produced in the solenoid is dependent on a few factors such as, the current in the coil, number of turns per unit length etc.
The following graph is obtained by a researcher while doing an experiment to see the variation of the magnetic field with respect to the current in the solenoid.
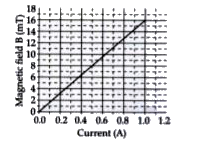
The unit of magnetic field as given in the graph attached is in milli-Tesla (mT) and the current is given in Ampere.
From the graph deduce which of the following statements is correct?
View SolutionA solenoid is a long helical coil of wire through which a current is run in order to create a magnetic field. The magnetic field of the solenoid is the superposition of the fields due to the current through each coil. It is nearly uniform inside the solenoid and close to zero outside and is similar to the field of a bar magnet having a north pole at one end and a south pole at the other depending upon the direction of current flow. The magnetic field produced in the solenoid is dependent on a few factors such as, the current in the coil, number of turns per unit length etc. The following graph is obtained by a researcher while doing an experiment to see the variation of the magnetic field with respect to the current in the solenoid. The unit of magnetic field as given in the graph attached is in milli-Tesla (mT) and the current is given in Ampere.
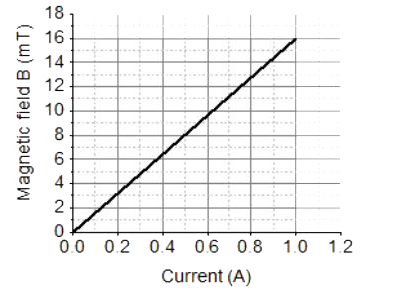
From the graph deduce which of the following statements is correct.
View SolutionA solenoid is a long helical coil of wire through which a current is runs in order to create a magnetic field. The magnetic field of the solenoid is the superposition of the fields due to the current through each coil. It is nearly uniform inside the solenoid and close to zero outside and is similar to the field of a bar magnet having a north pole at one end and a south pole at the other depending upon the direction of current flow. The magnetic field produced in the solenoid is dependent on a few factors such as, the current in the coil, number of turns per unit length etc.
The following graph is obtained by a researcher while doing an experiment to see the variation of the magnetic field with respect to the current in the solenoid.
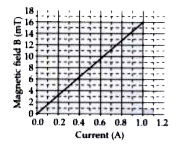
The unit of magnetic field as given in the graph attached is in milli-Tesla (mT) and the current is given in Ampere.
Which of the following statement is correct if a soft iron bar is placed inside the solenoid?
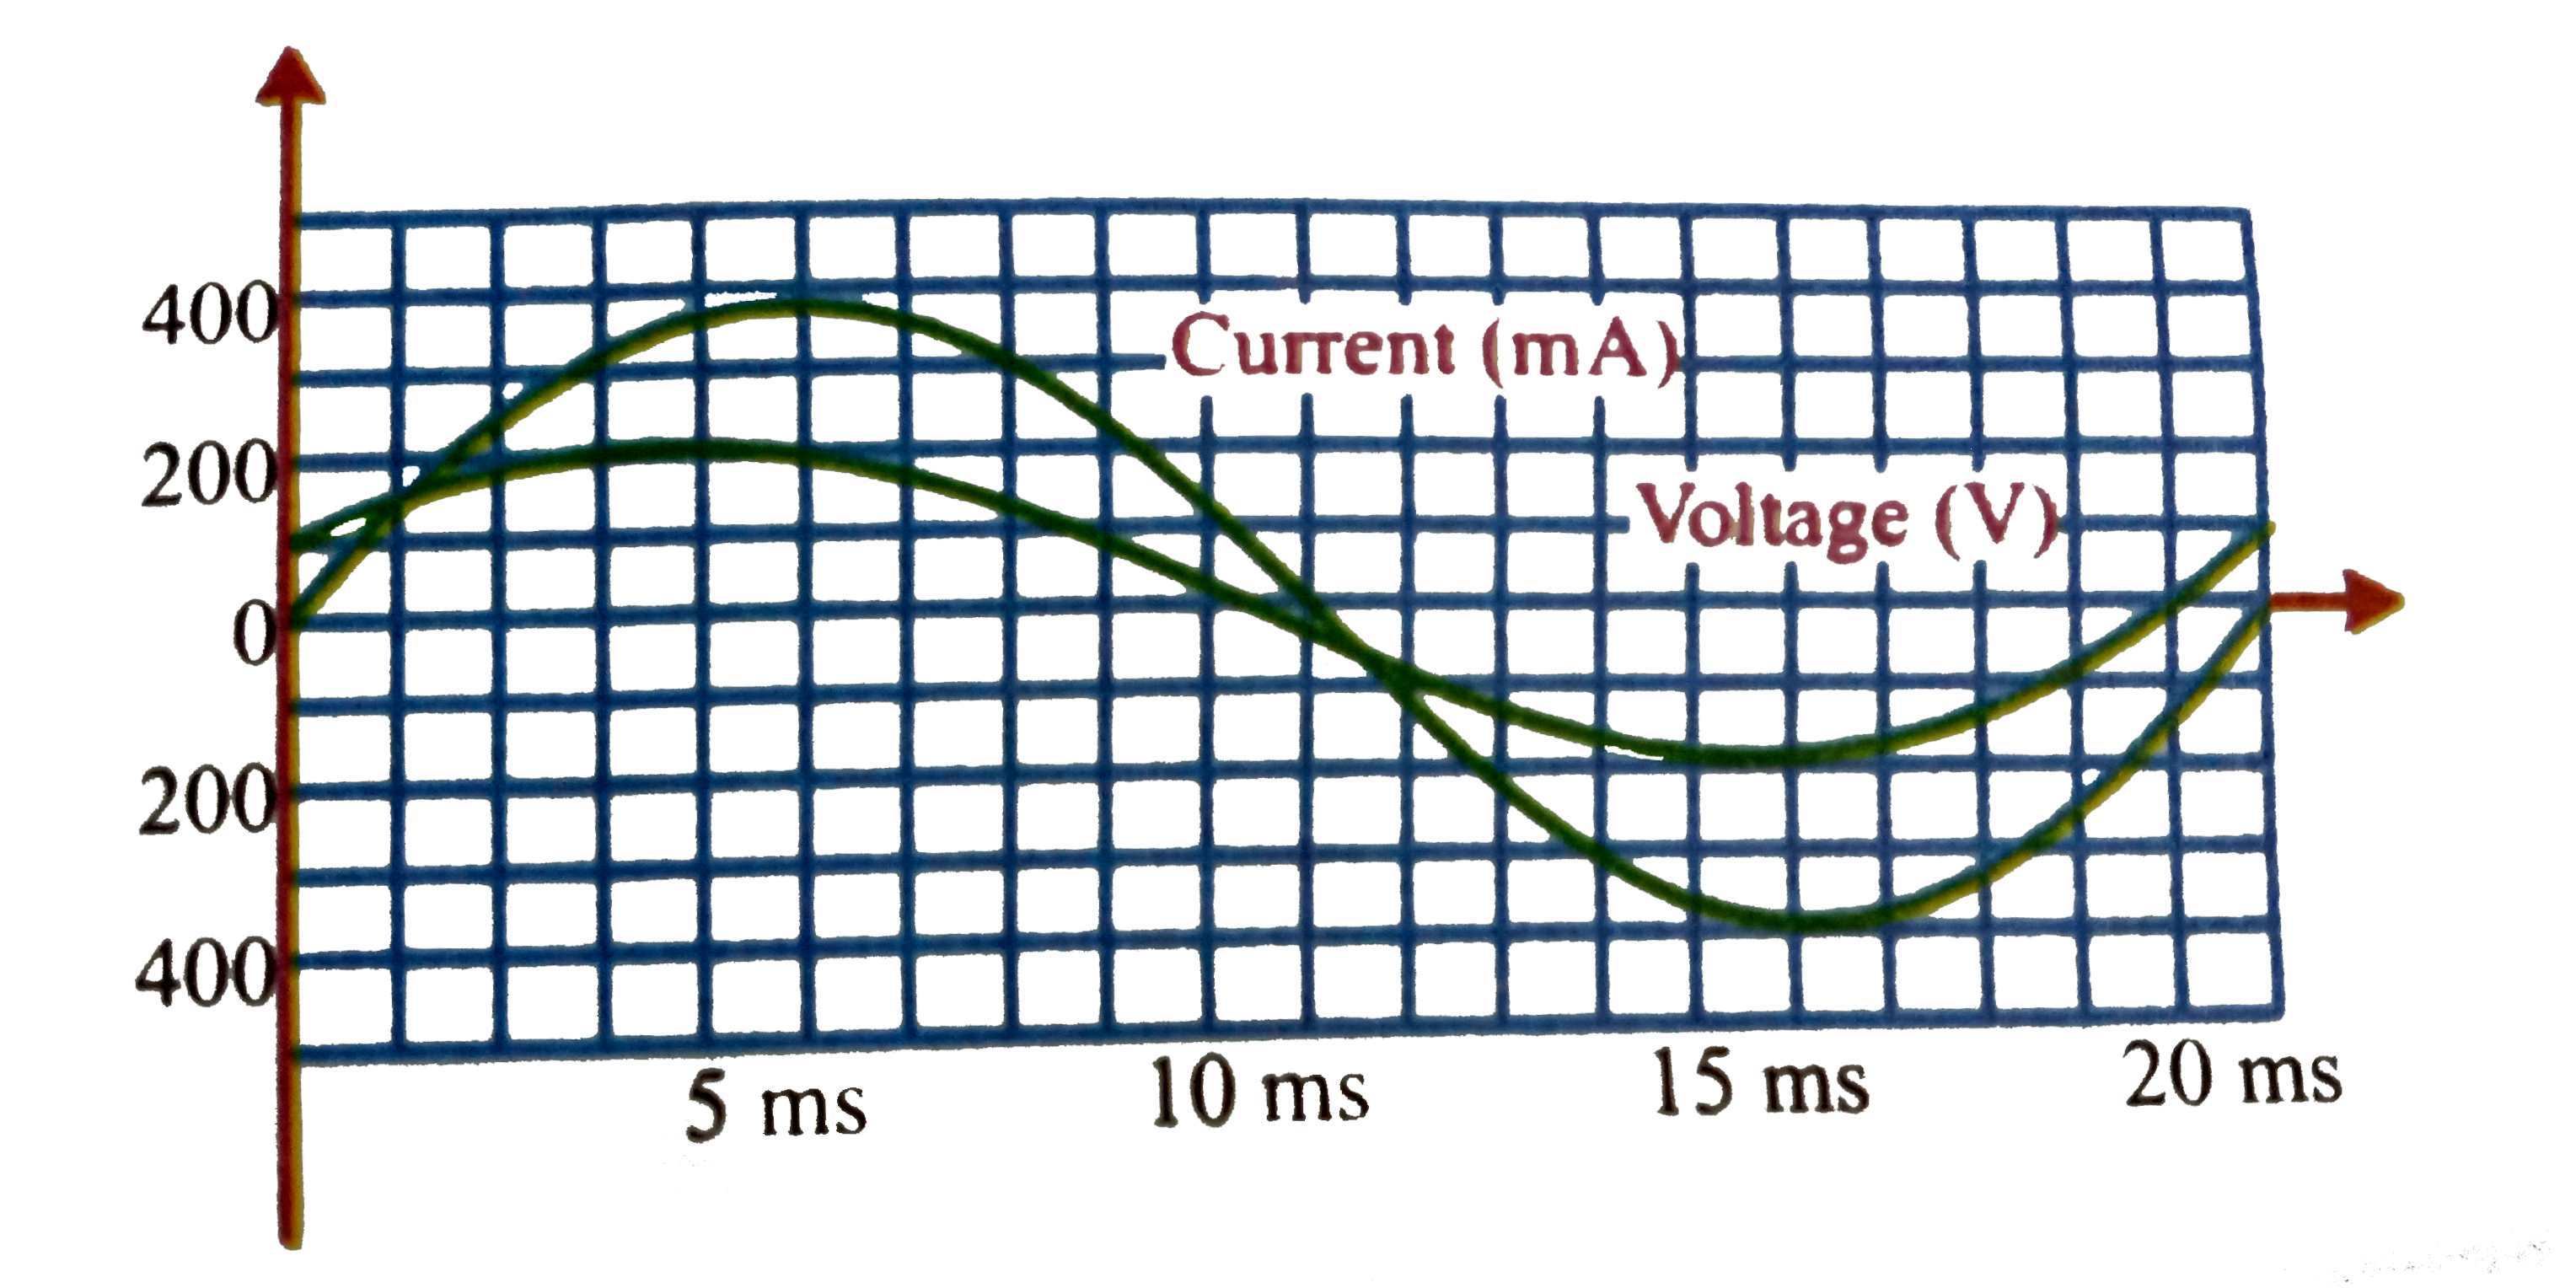
View SolutionThe given graph shows variation with time in the source voltage and steady state current drawn by a series RLC circuit. Given curve through origin is the current variation.
Which of the following statements is/are correct ?
View SolutionWhich of these examples will have the steepest curve when log of species richness and log of area are plotted on a graph?
View Solution
