Choose the diagram which correctly depicts anaphase I
A
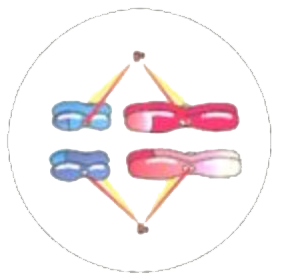
B
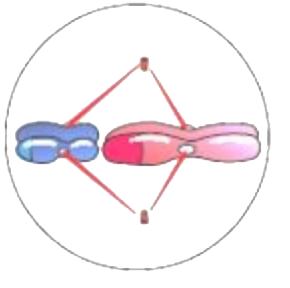
C
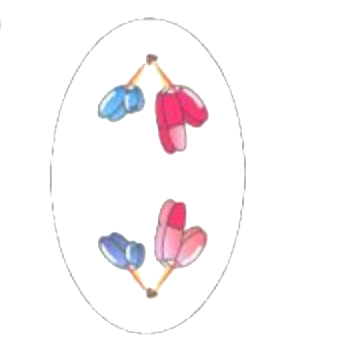
D
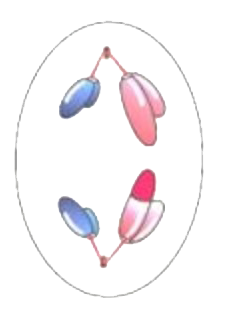
Video Solution
Text Solution
The correct Answer is:C
|
Answer
Step by step video, text & image solution for Choose the diagram which correctly depicts anaphase I by Biology experts to help you in doubts & scoring excellent marks in Class 12 exams.
Updated on:21/07/2023
Topper's Solved these Questions
Similar Questions
Knowledge Check
- Question 1 - Select One
Choose the word which is spelt correctly.
ACommitedBCommittedCComitteedDCommitteed - Question 2 - Select One
In Anaphase-I
Achromosomes move to respective polesBchromatids move to respective polesCcentriole movesDspindle fibres move - Question 3 - Select One
Which of the following diagram correctly depicts the ralation between AC and MC ?
A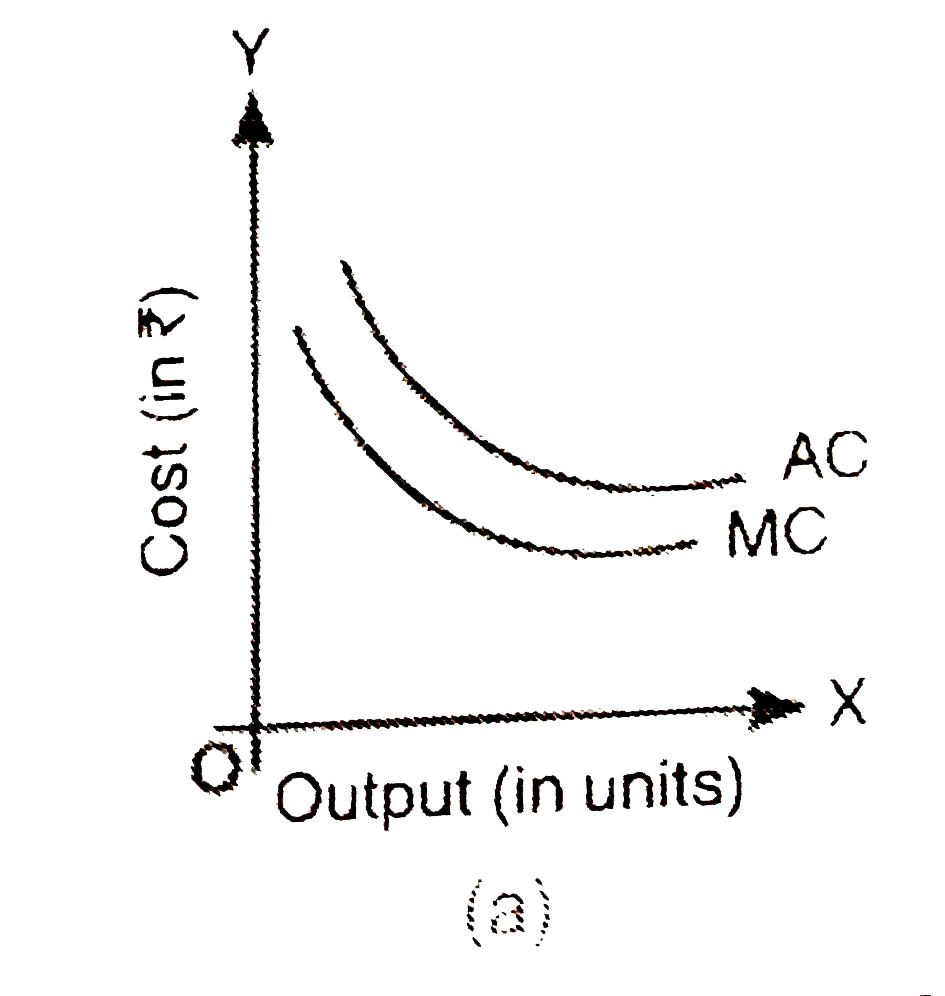 B
B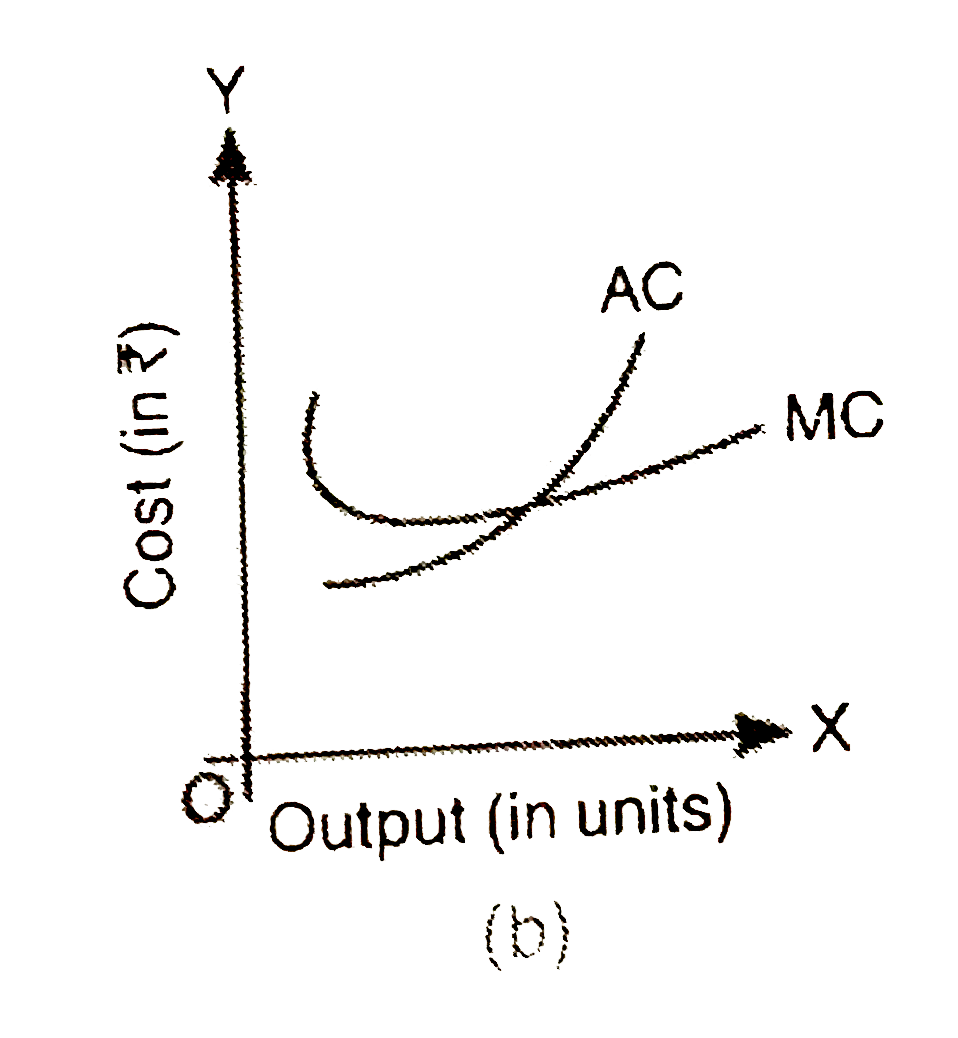 C
C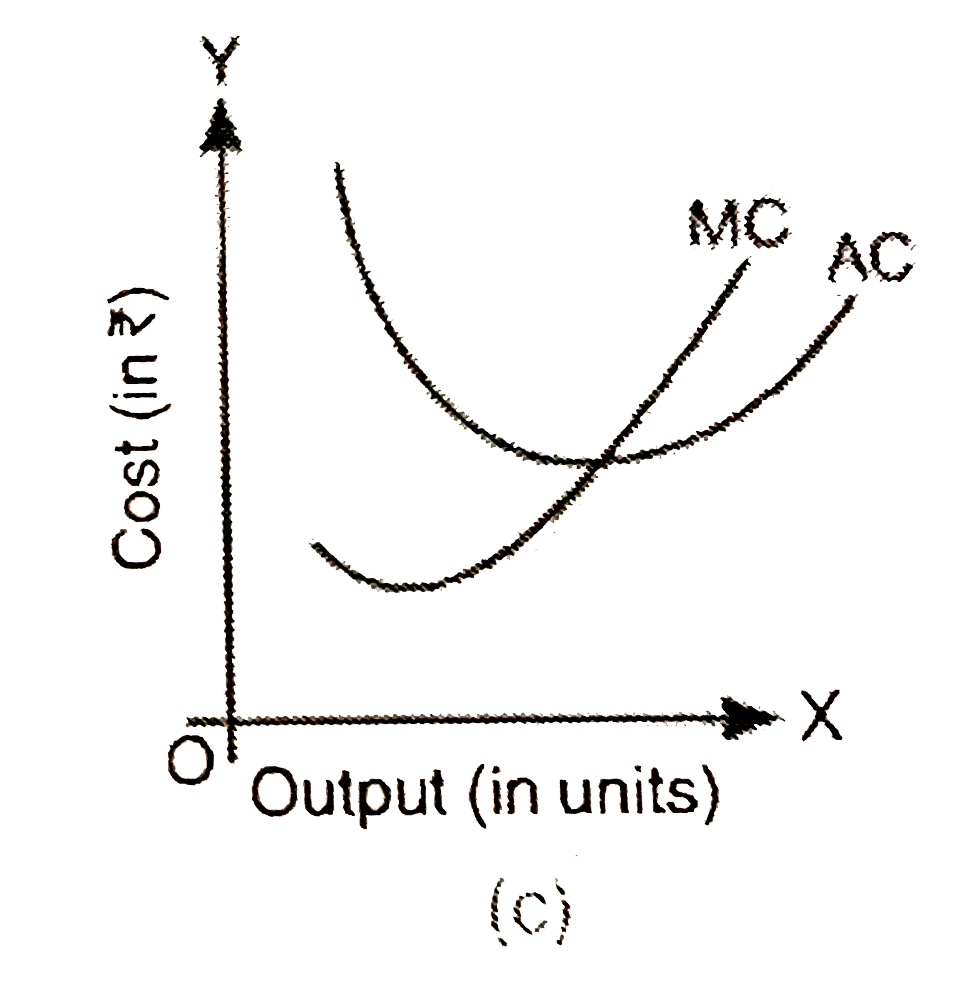 D
D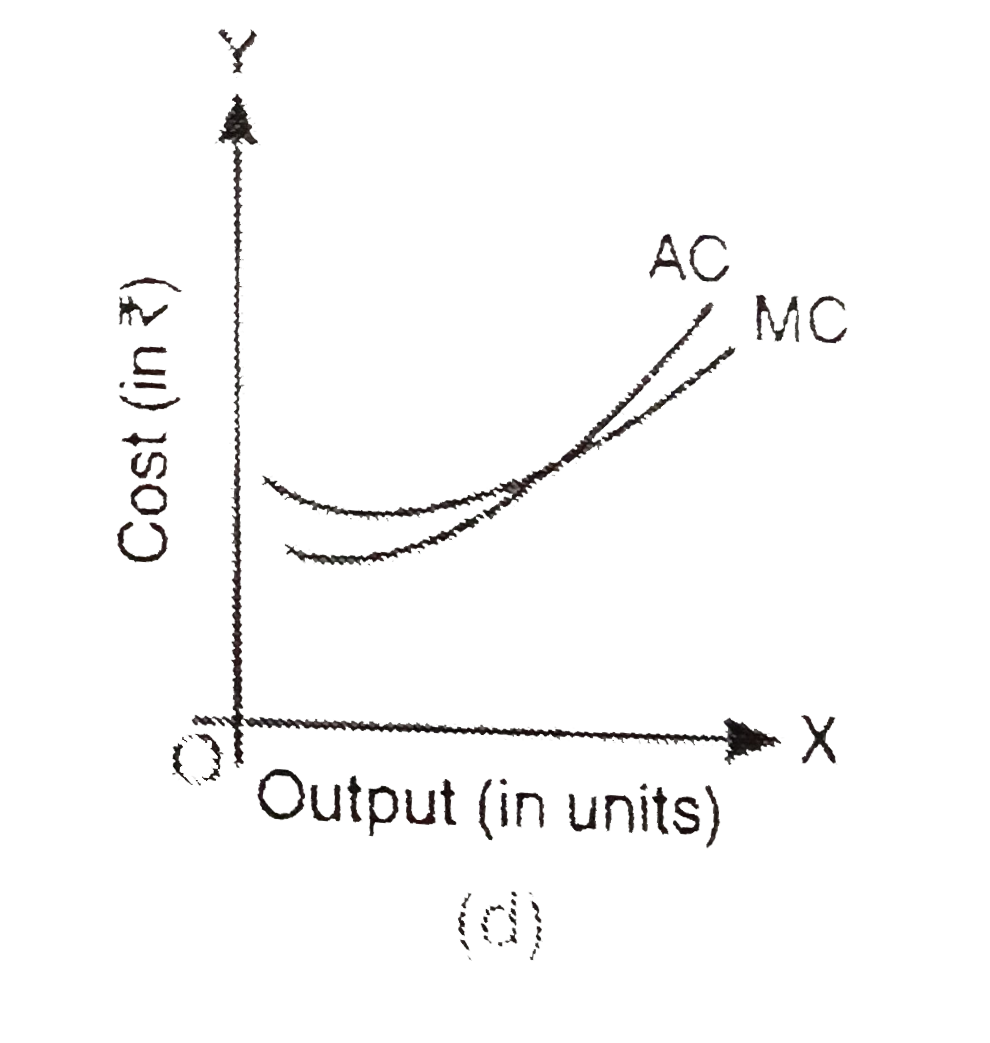
Which of the following diagram correctly depicts the relationship between TC,TFC and TVC ?
View SolutionWhich of the following diagram correctly depicts the relation between AR and MR when price falls with rise in output ?
View SolutionWhich diagram correctly depicts total variable cost curve :
View SolutionSelect the option which correctly represents the stage anaphase - I for chromosome number 2n = 4.
View SolutionWhich of the following graphs correctly depicts the rate of photosynthesis of sun plant (P) and shade plant (Q)?
View Solution
