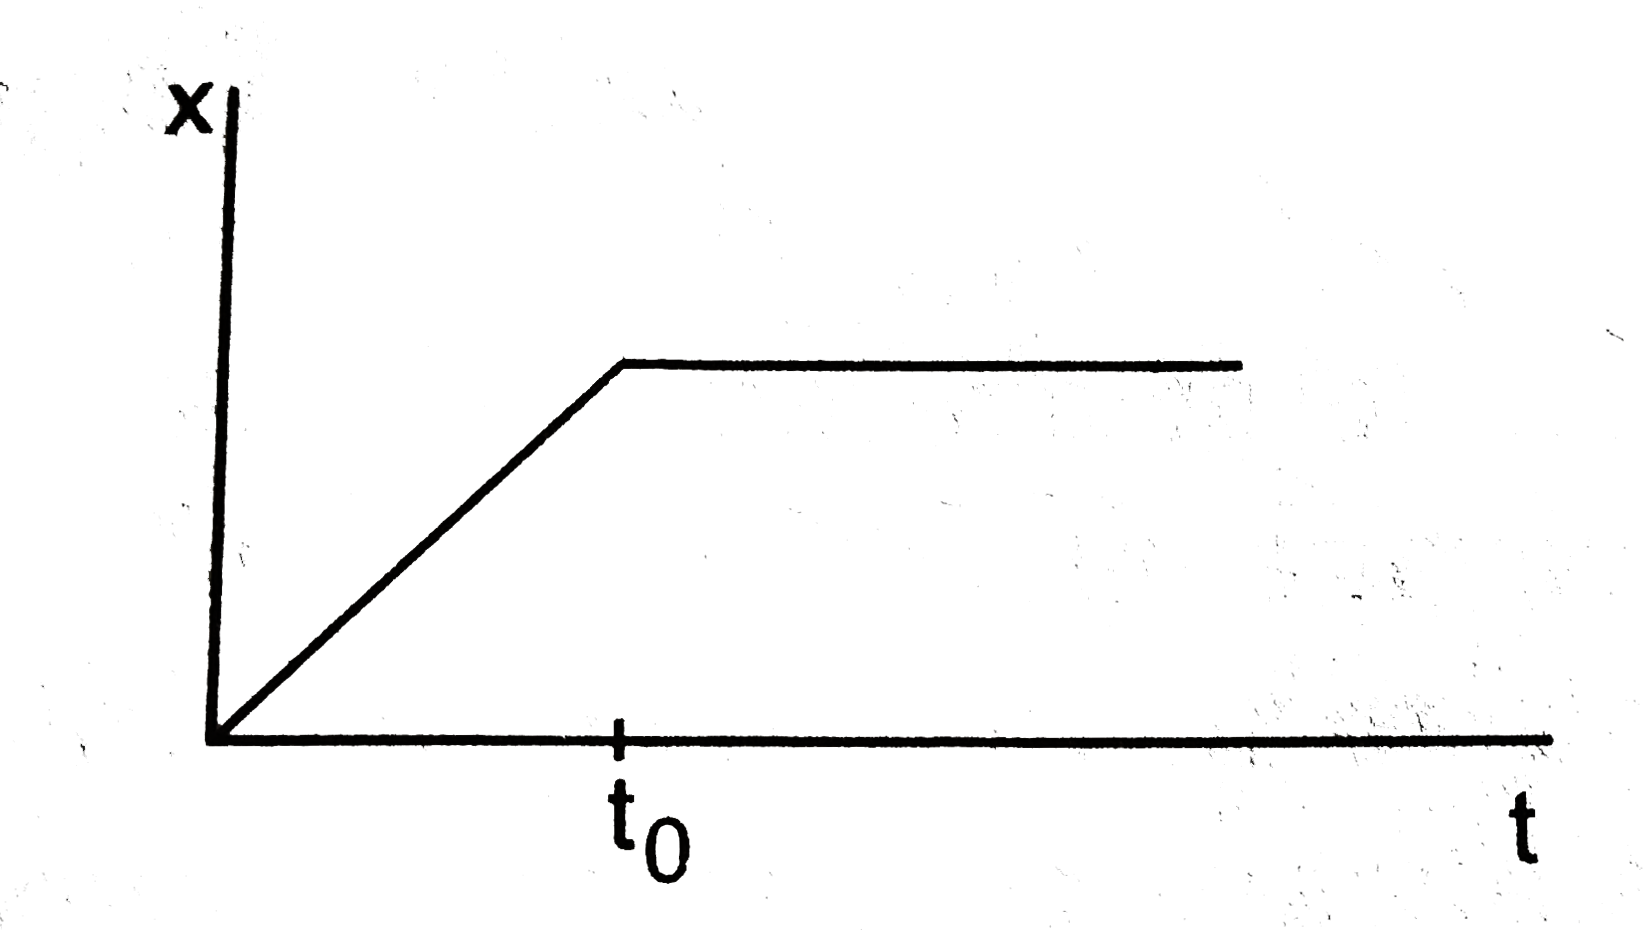
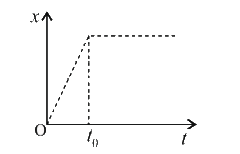
Figure shows two displacement-time graphs of particles P1 and P2
Their relative velocity is

zero
non-zero but constant
continuously decreases
continuously increases
The correct Answer is:B
Step by step video, text & image solution for Figure shows two displacement-time graphs of particles P_(1) and P_(2) Their relative velocity is by Physics experts to help you in doubts & scoring excellent marks in Class 12 exams.
Topper's Solved these Questions
- BOOK - FIITJEECHAPTER - KINEMATICSEXERCISE - ASSIGNMENT PROBLEMS (OBJECTIVE) LEVEL-I (ASSERTION REASONING TYPE)2videos
KINEMATICS
- BOOK - FIITJEECHAPTER - KINEMATICSEXERCISE - ASSIGNMENT PROBLEMS (OBJECTIVE) LEVEL-II20videos
KINEMATICS
- BOOK - FIITJEECHAPTER - KINEMATICSEXERCISE - ASSIGNMENT PROBLEMS (SUBJECTIVE) LEVEL-II & III15videos
KINEMATICS
- BOOK - FIITJEECHAPTER - HEAT AND TEMPERATUREEXERCISE - NUMERICAL BASES QUESTIONS1videos
HEAT AND TEMPERATURE
- BOOK - FIITJEECHAPTER - LAWS OF MOTIONEXERCISE - COMPREHENSION-III2videos
LAWS OF MOTION
Similar Questions
Knowledge Check
- Question 1 - Select One
Figure show the displacement - time graph of a particle moving on the x-axis
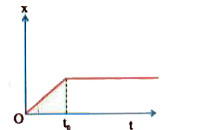 Athe particle is continuously going in positive X directionBthe particle is at restCthe velocity increases up to a time t0 and then becomes constant.Dthe particle moves at constant velocity up to a time t0 and then stops.
 - Question 2 - Select One
Figure shows a velocity-time graph. This shows that.
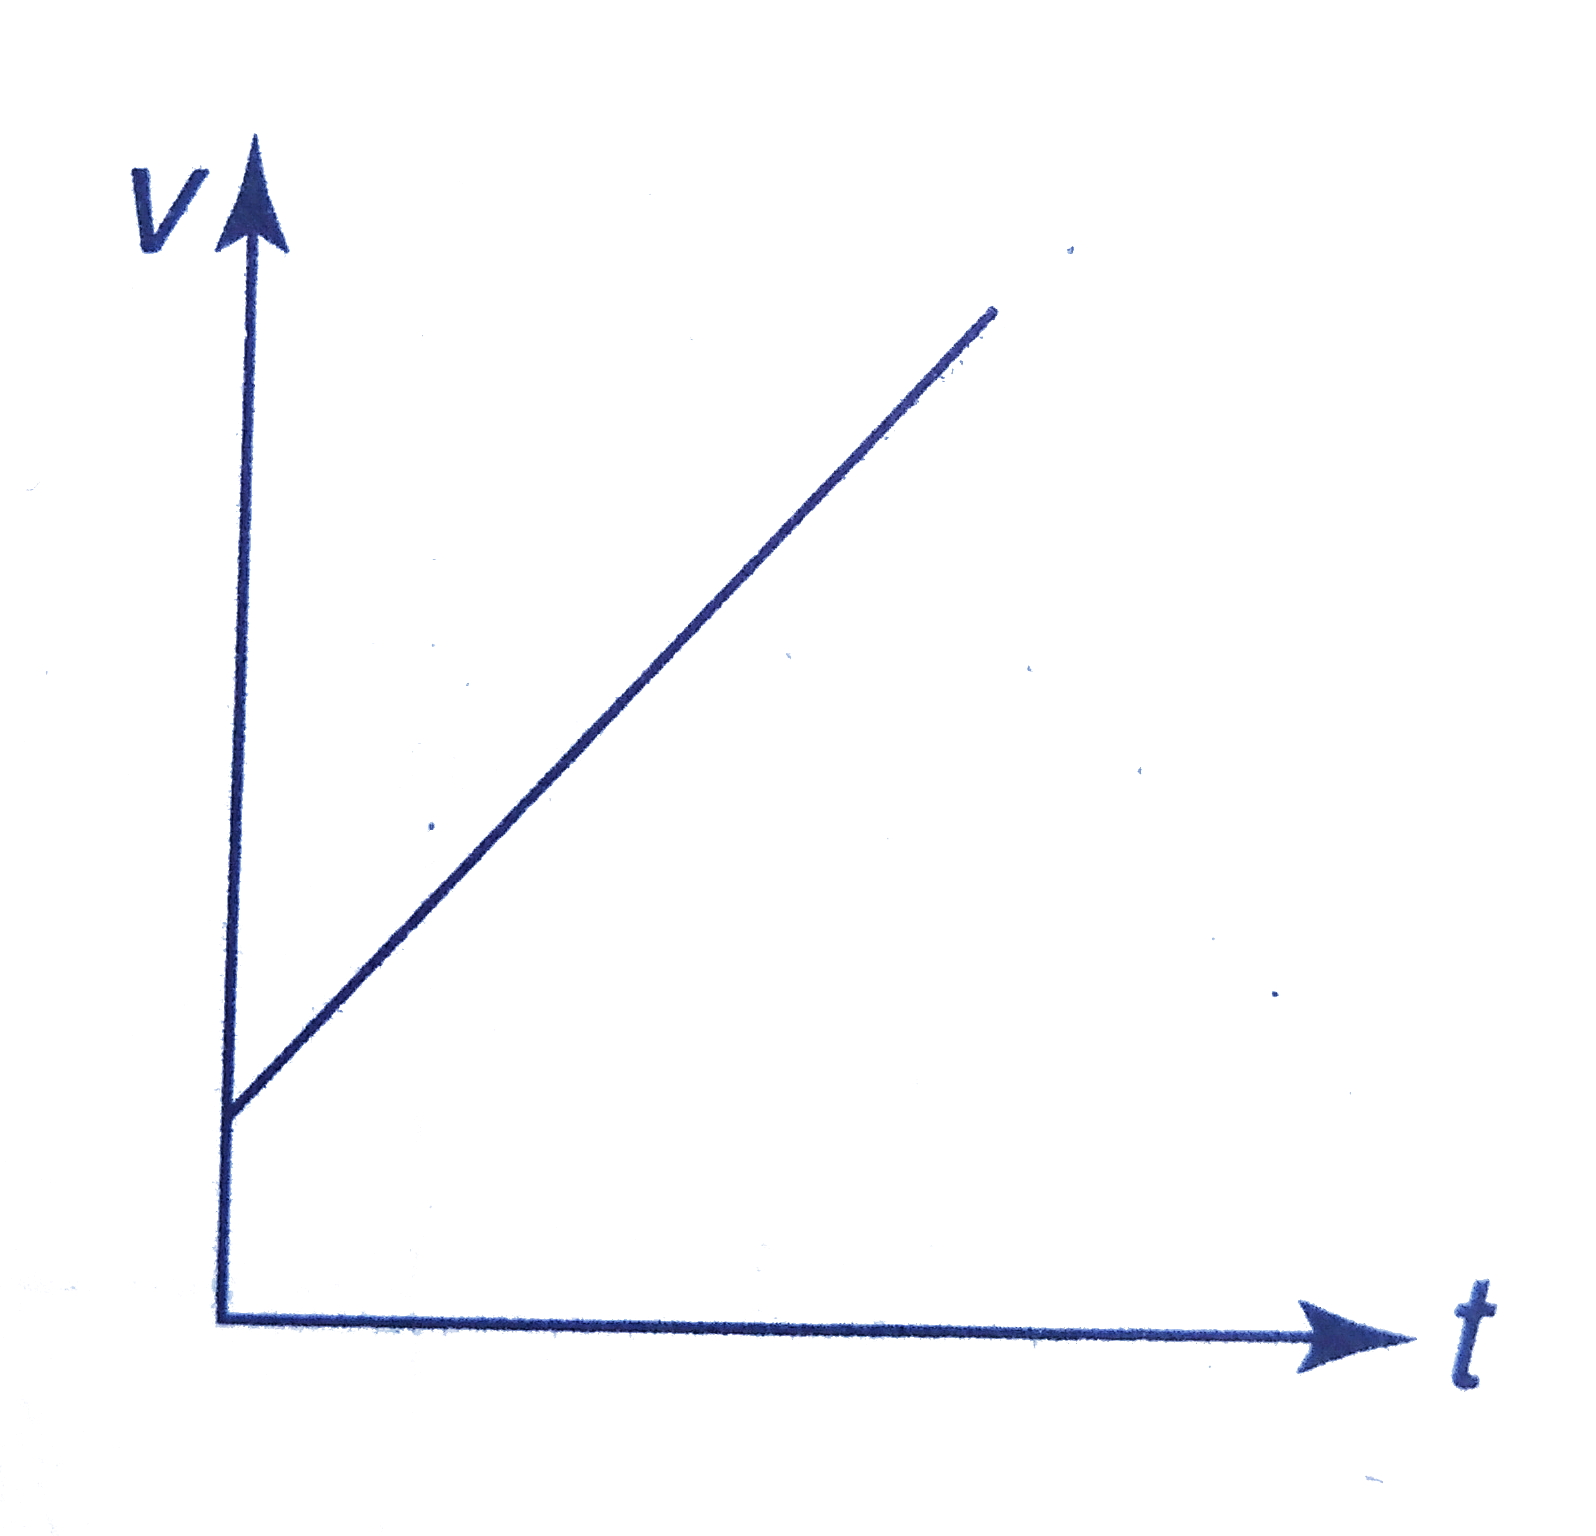 Athe body is at restBthe body starts from rest and moves with uniform velocityCthe body has some initial velocity and moves with uniform accelerationDthe motion is retarded
 - Question 3 - Select One
Which one of the following represents displacement-time graph of two objects A and B moving with zero relative velocity?
A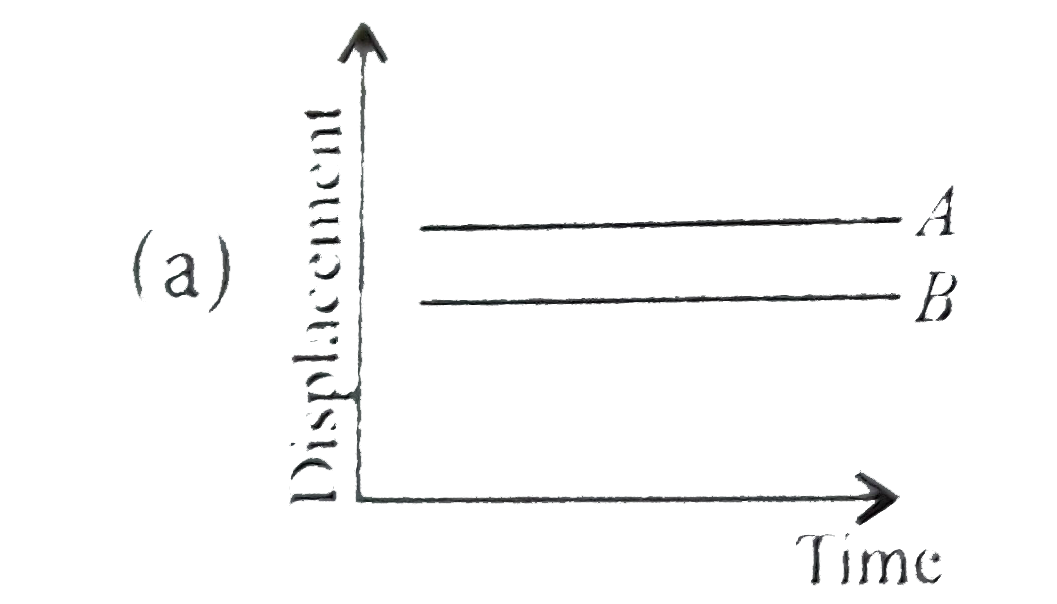 B
B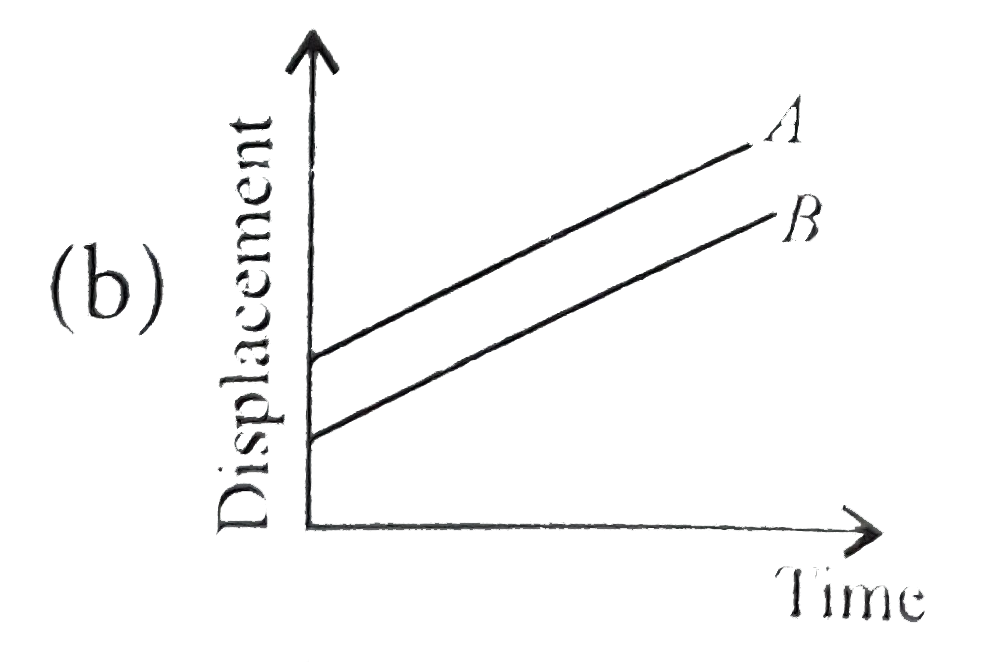 C
C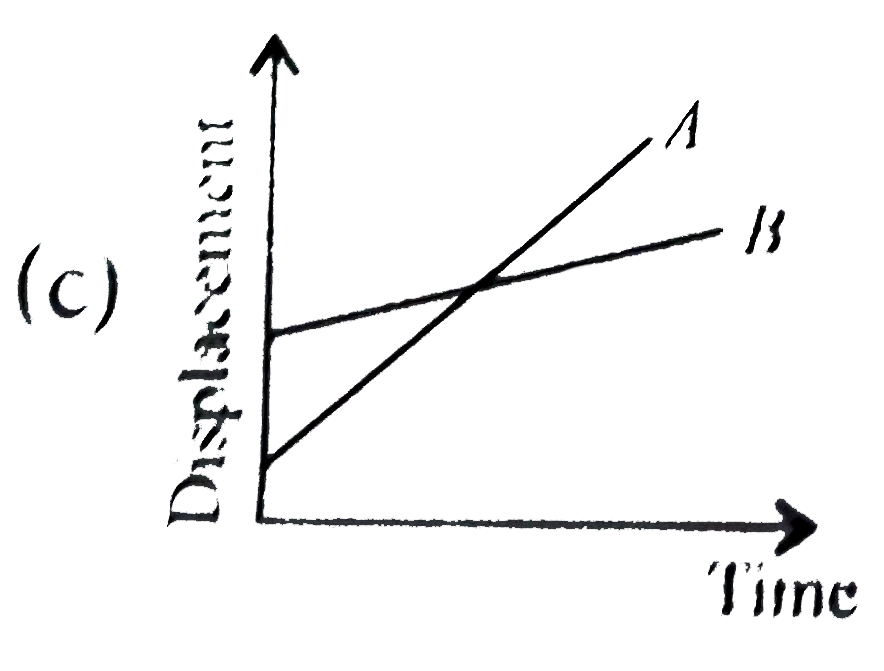 D
D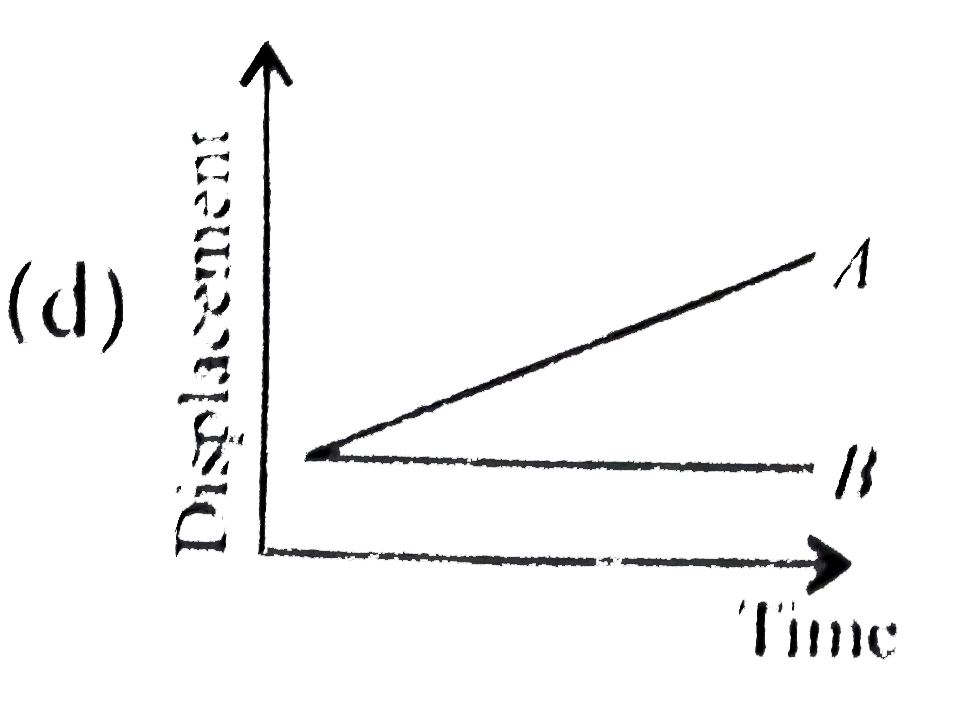
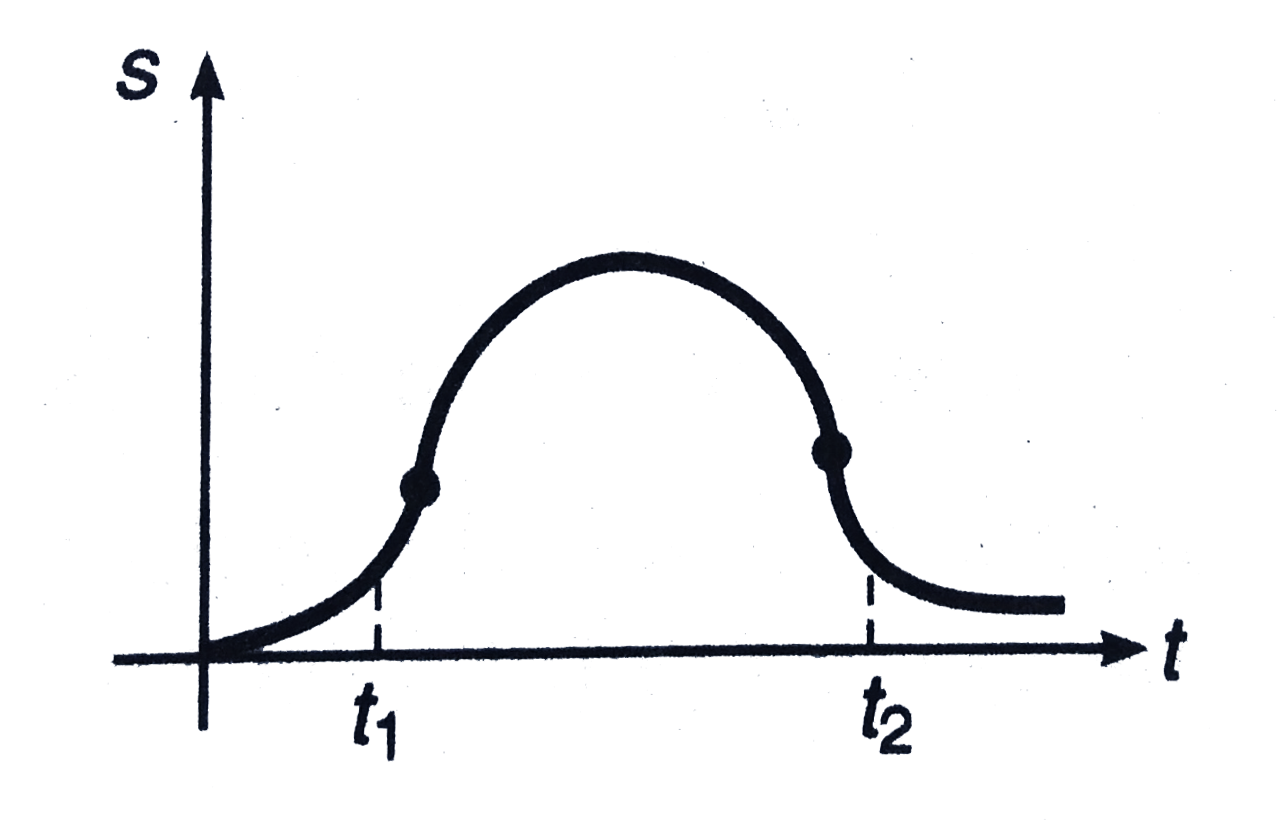
Figure shows the displacement-time graph of a particle moving in a straight line. Find the signs of velocity and acceleration of particle at time t=t1andt=t2.
 View Solution
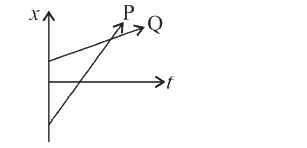
Figure shows the displacement -time curve of the particles P and Q. Which of the following statement is correct ?
 View Solution
The displacement-time graph for two particles is as shown. Find the ratio of their velocities.
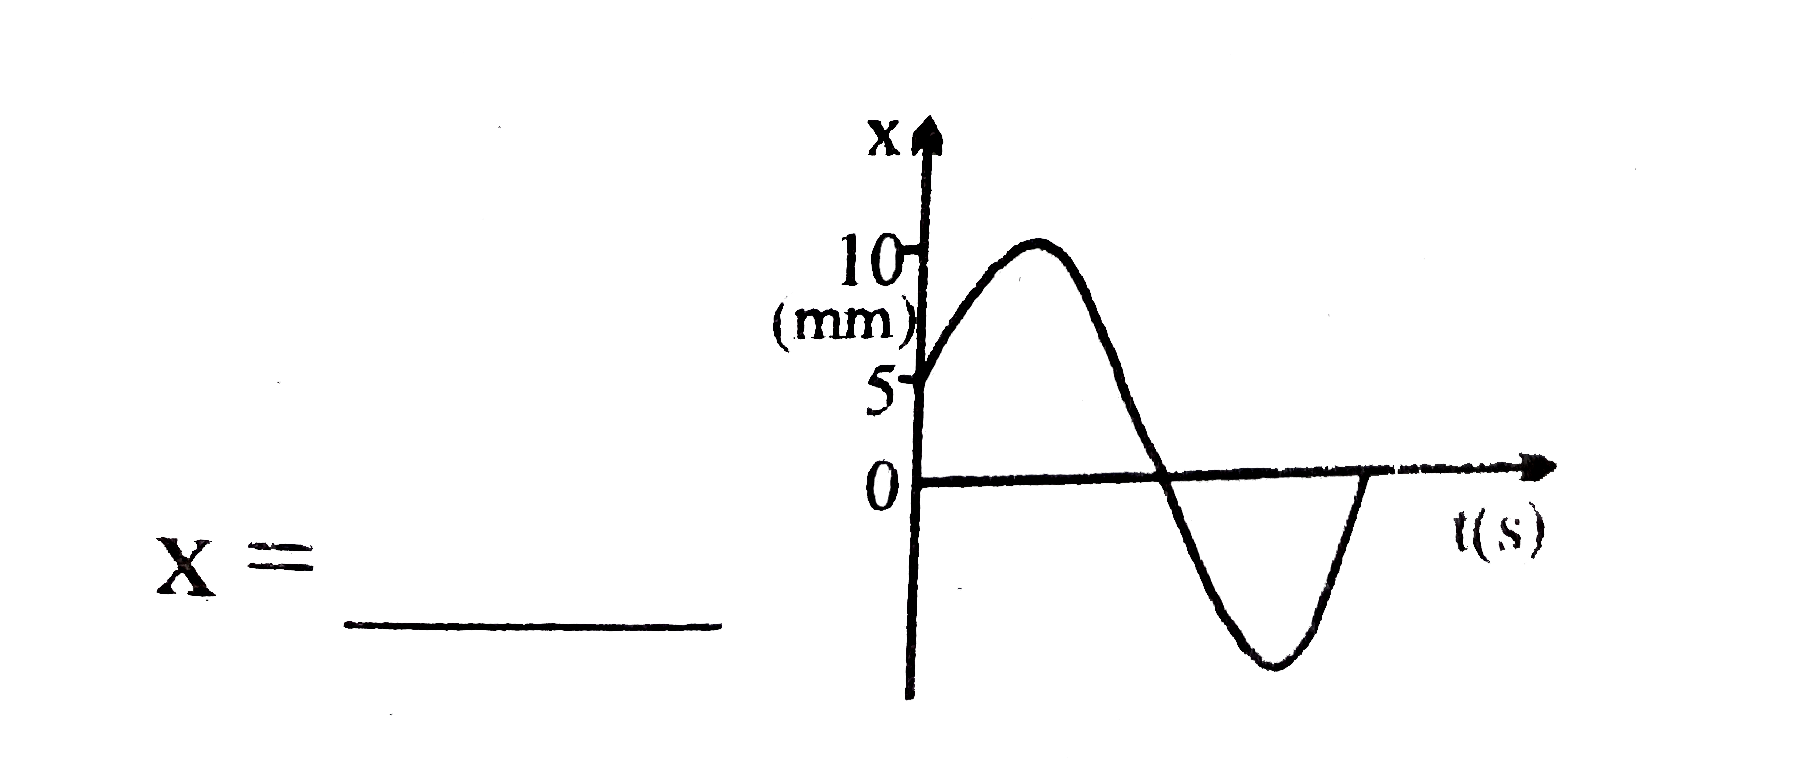
View SolutionThe figure shows the displacement-time graph of a particle executing SHM. If the time period of oscillation is 2s, then the equation of motion is given by
 View Solution
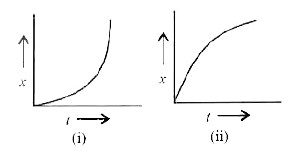
Figure (i) and (i) show the displacement-time graphs of two particles moving along the x-axis. We can say that
 View Solution


