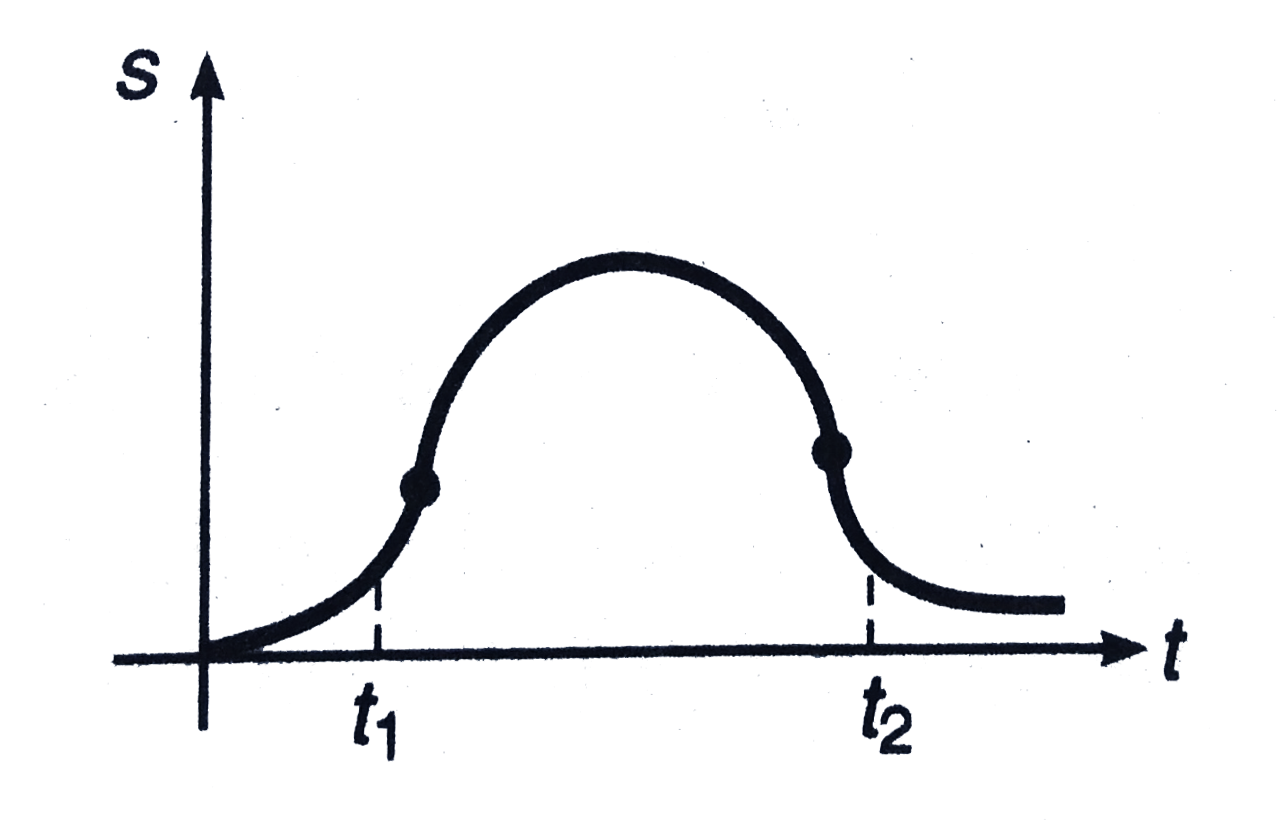
Figure shows the displacement-time graph of a particle moving in a straight line. Find the signs of velocity and acceleration of particle at time t=t1andt=t2.
The correct Answer is:A, B, D
At time t=t1, slope of s-t graph (=velocity) is
positive and increasing. Therefore velocity is
positive and accleration is also positive.
At time t=t2 slope is negative but decreasing
(in magnitude). Therefore velocity is negative but
decreasing in magnitude. Hence, acceleration is
positive.
Topper's Solved these Questions
- BOOK - DC PANDEYCHAPTER - KINEMATICSEXERCISE - Subjective51videos
KINEMATICS
- BOOK - DC PANDEYCHAPTER - KINEMATICSEXERCISE - More Than One Correct6videos
KINEMATICS
- BOOK - DC PANDEYCHAPTER - KINEMATICSEXERCISE - Assertion And Reason12videos
KINEMATICS
- BOOK - DC PANDEYCHAPTER - GRAVITATIONEXERCISE - (C) Chapter Exercises45videos
GRAVITATION
- BOOK - DC PANDEYCHAPTER - KINEMATICS 1EXERCISE - INTEGER_TYPE15videos
KINEMATICS 1
Similar Questions
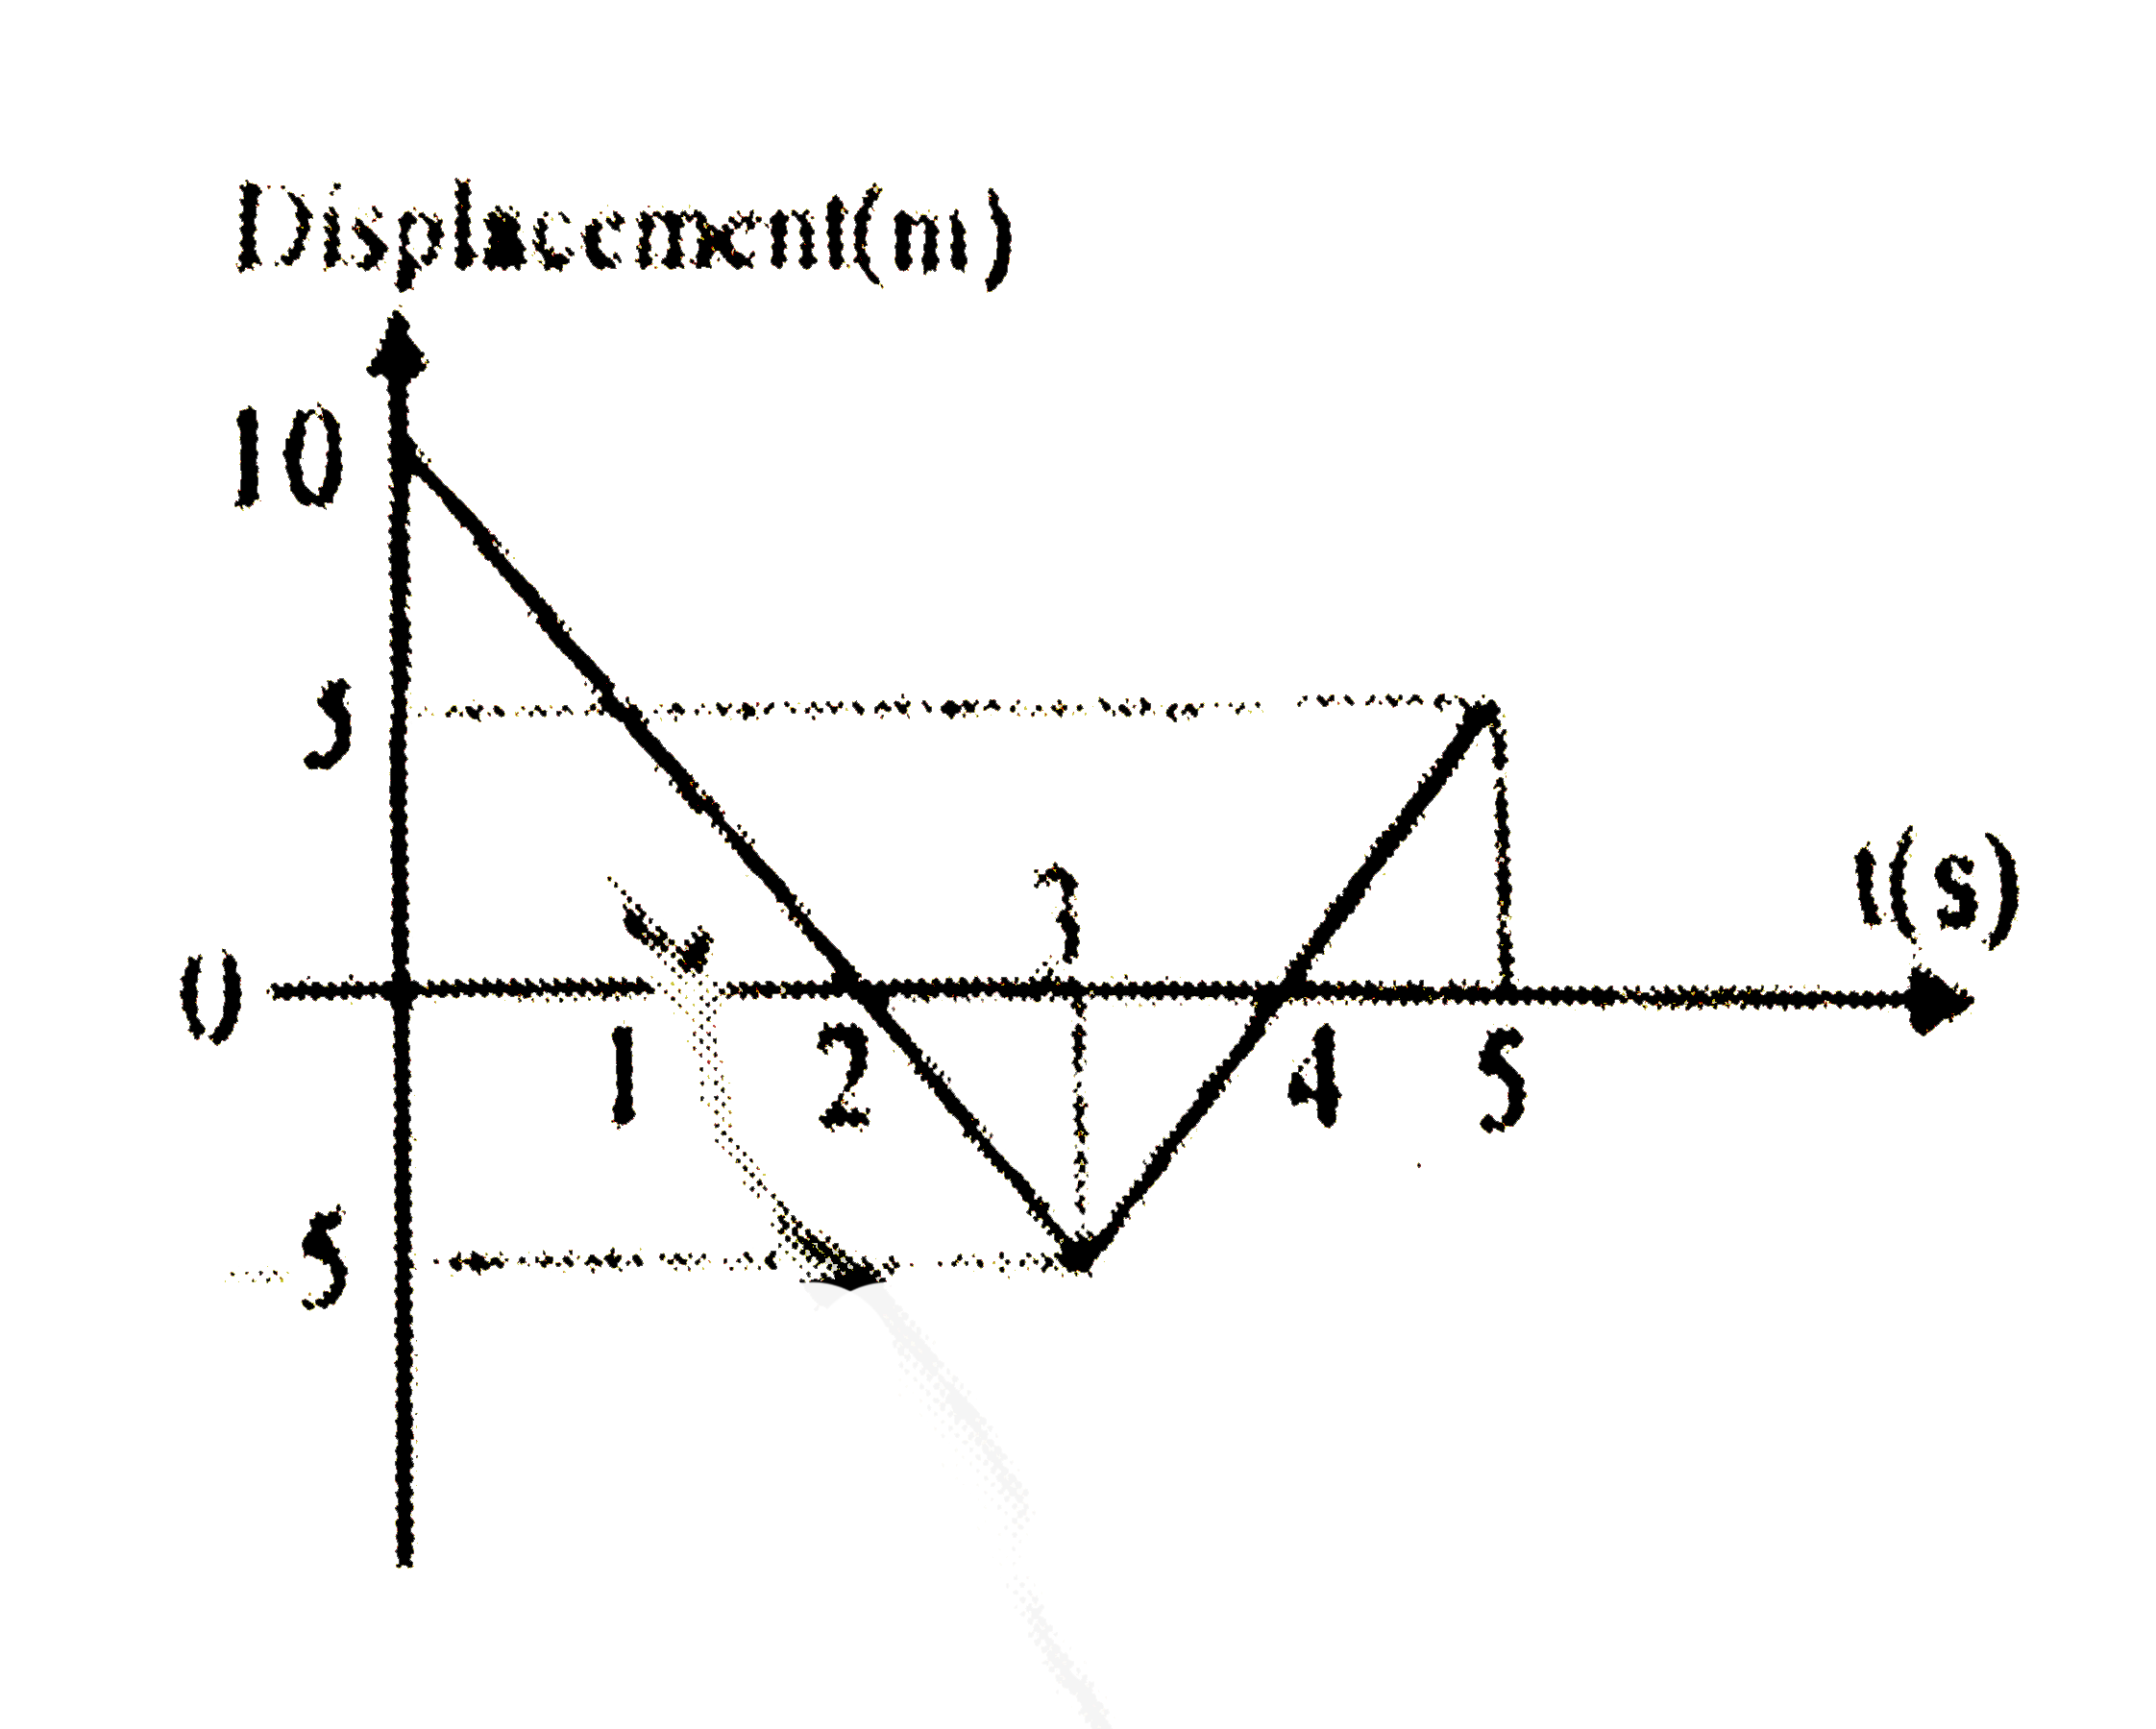
The diagram shows the displacement - time graph for a particle moving in a straight line. The distance (in m) coverted by the particle in the time interval t=0 to t=5s is
 View Solution
The displacement of a particle moving along a straight line is given by
s=3t^(3)+2t^(2)-10t. find initial velocity and acceleration of particle.View Solution
Knowledge Check
- Question 1 - Select One
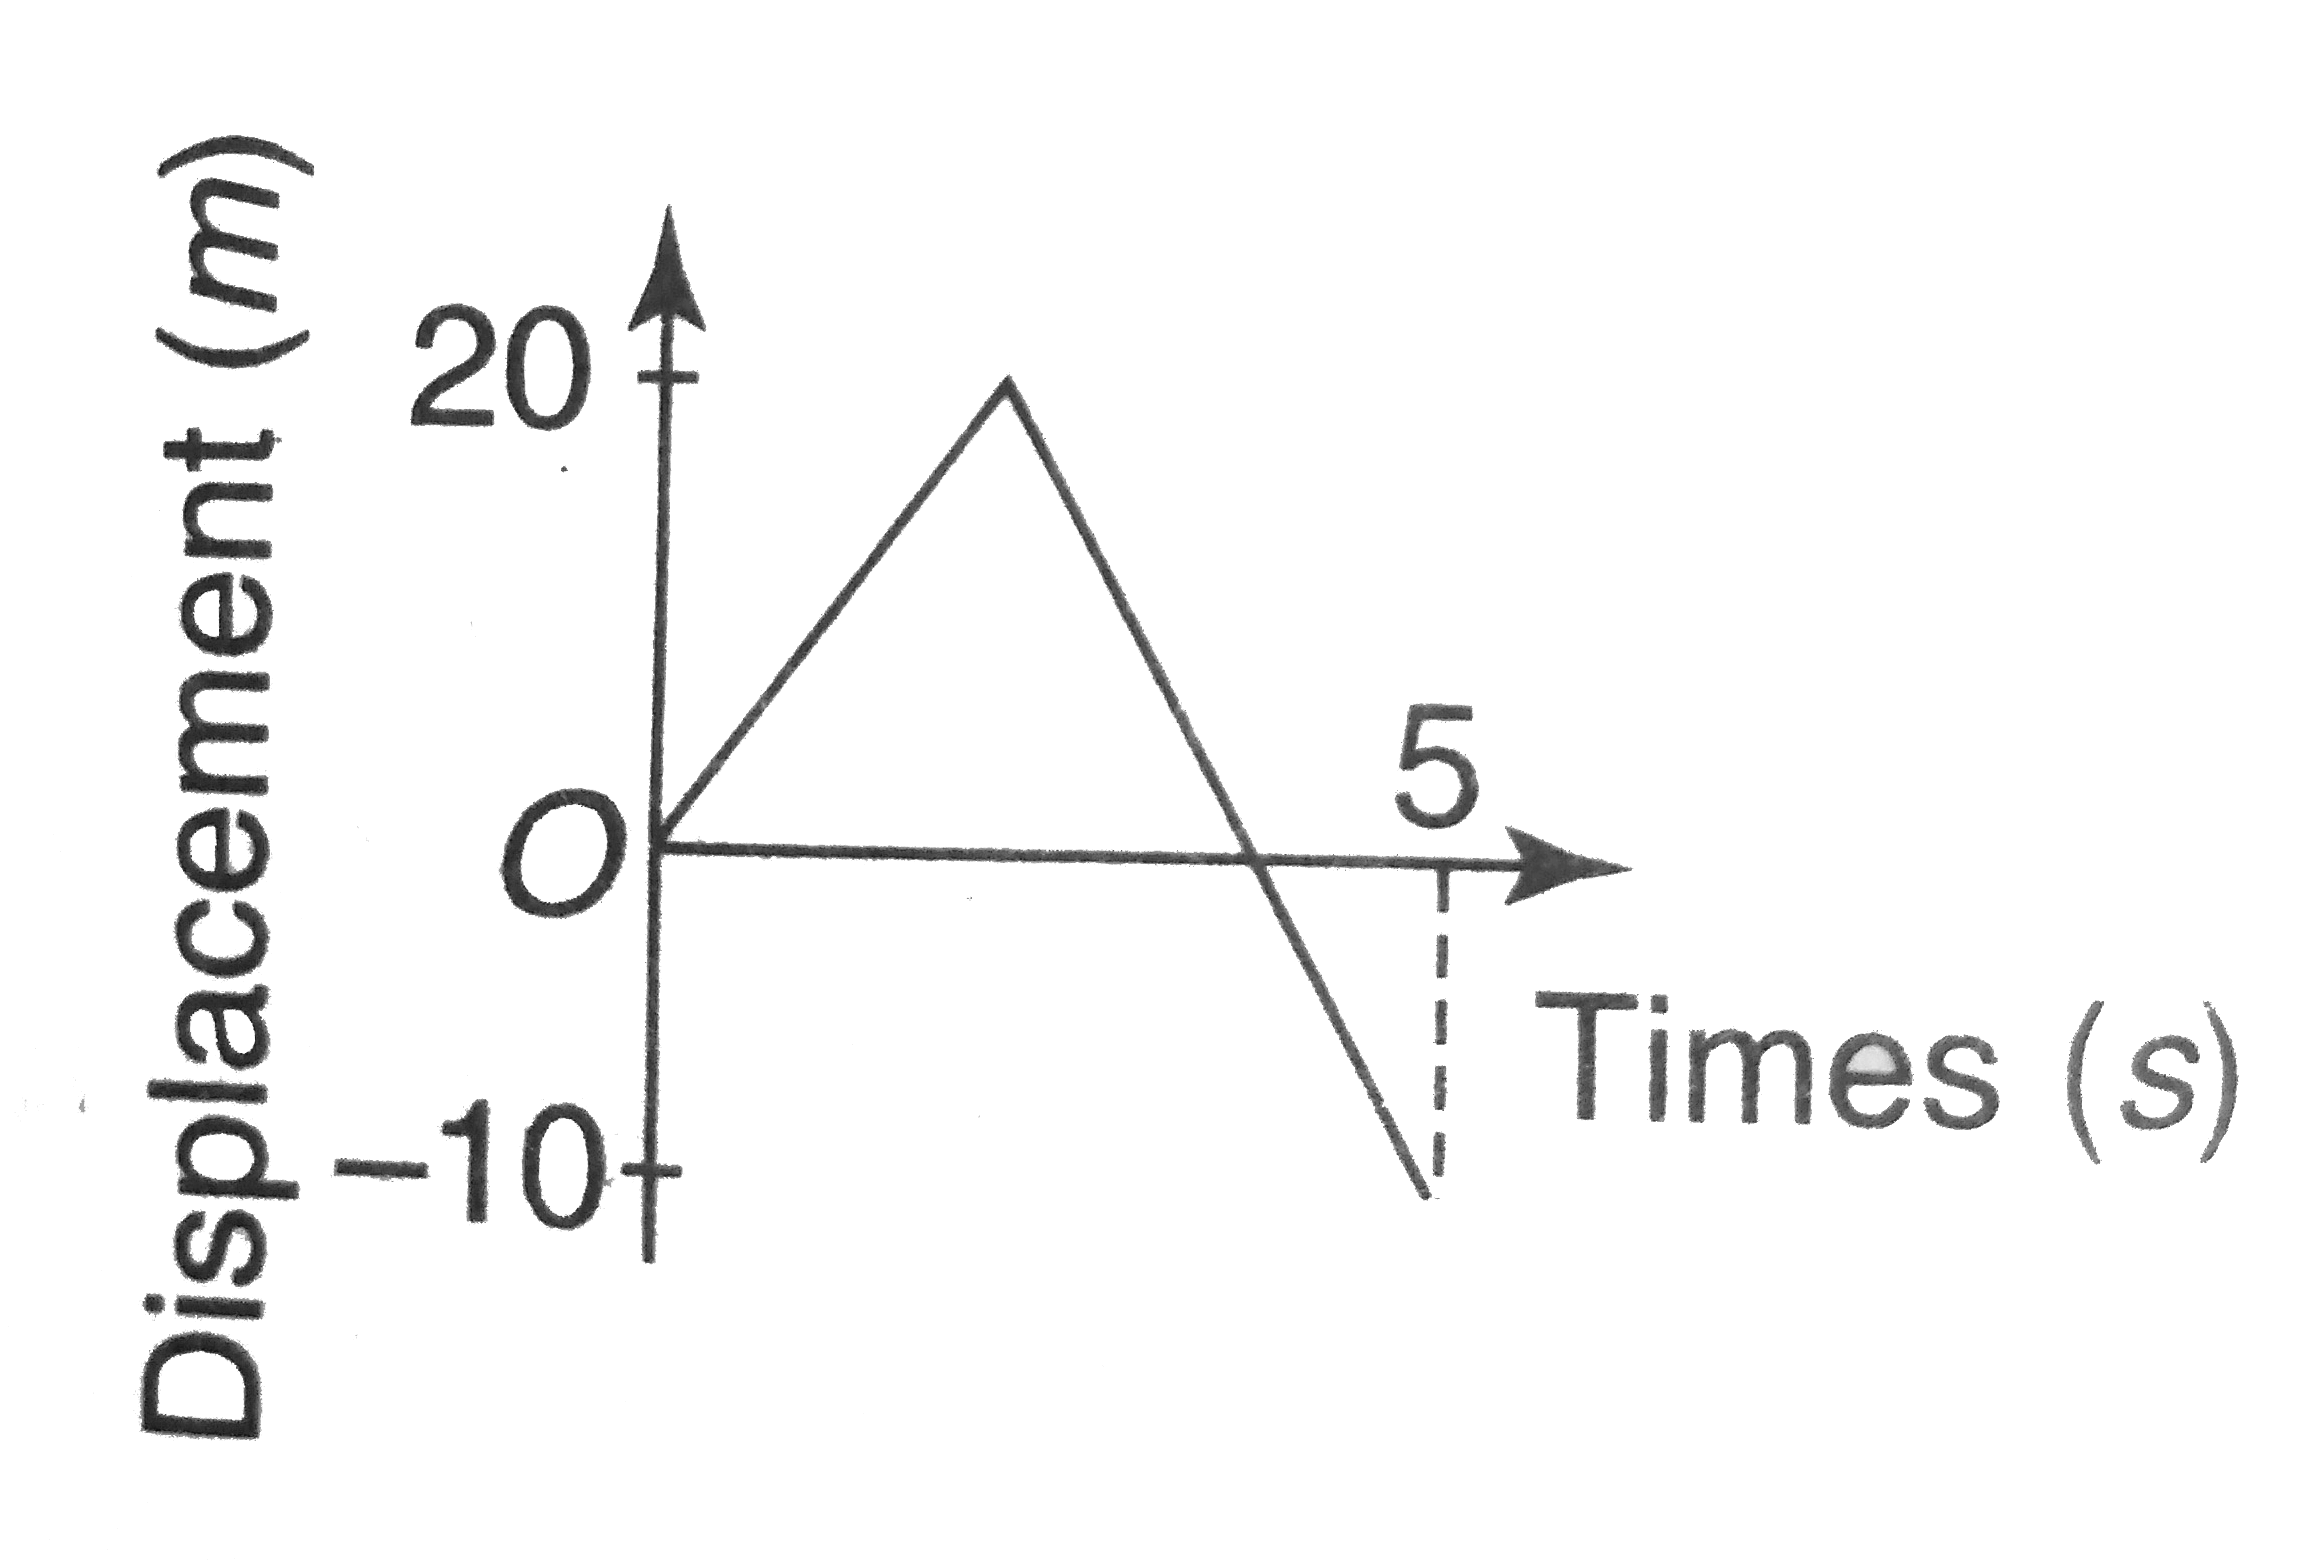
The diagram shows the displacement-time graph for a particle moving in a straight line. Find the average velocity for the interval from t=0 to t=5s.
 A−2ms−1B2ms−1C−4ms−1D4ms−1
 - Question 2 - Select One
The diagram shows the displacement-time graph for a particle moving in a straight line. Find the average velocity for the interval from t=0 to t=5s.
 A−2ms−1B2ms−1C−4ms−1D4ms−1
 - Question 3 - Select One
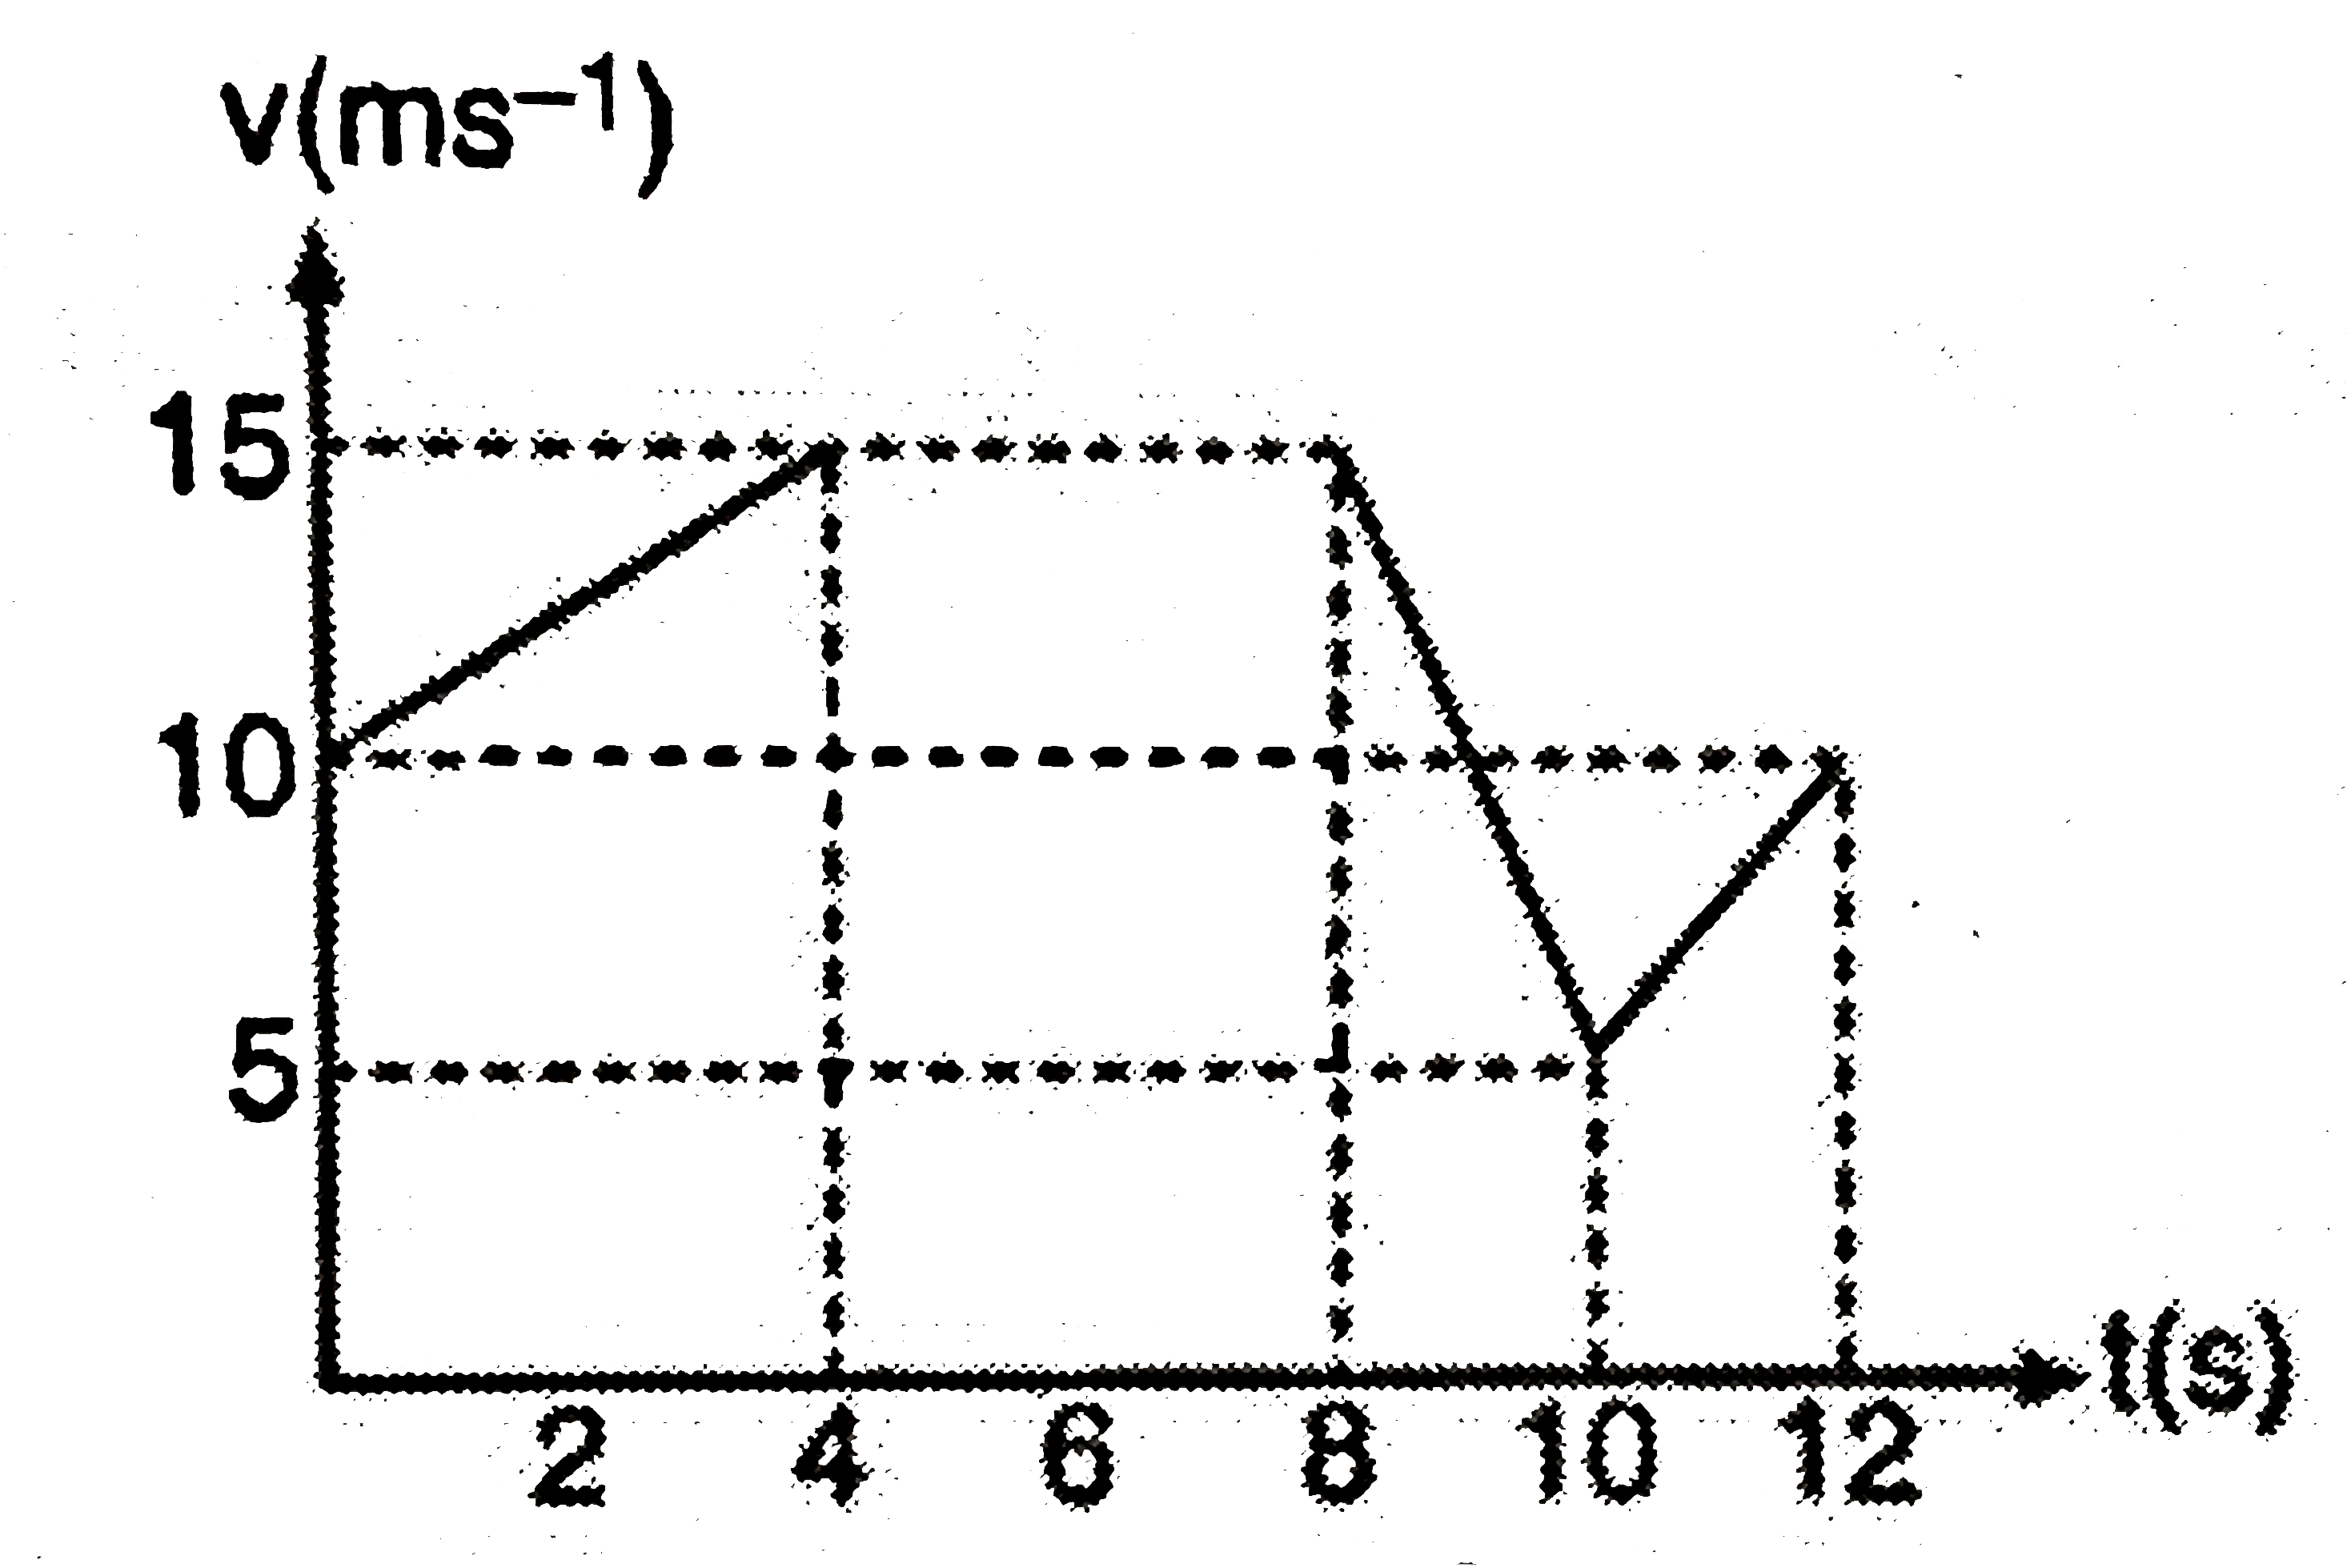
The velocity -time (v−t) graph of a particle moving in a straight line is shown in figure. The acceleration of the particle at t=9 is:
 AzeroB5ms−2C−5ms2D−2ms−2
The displacement x of a particle varies with time as x=4t2–15t+25. Find the position, velocity and acceleration of the particle at t = 0.
View SolutionDisplacement-time graph of a particle moving in a straight line is as shown in figure.
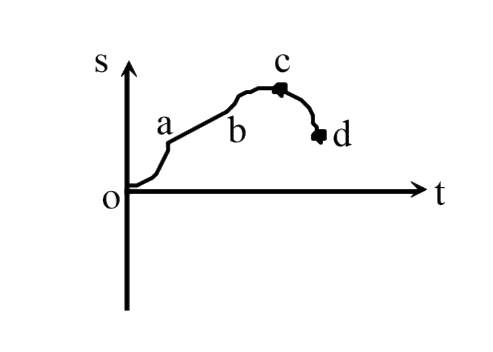
Q. Find the sign of acceleration in the above regionView SolutionDisplacement-time graph of a particle moving in a straight line is as shown in figure. s t a o b c
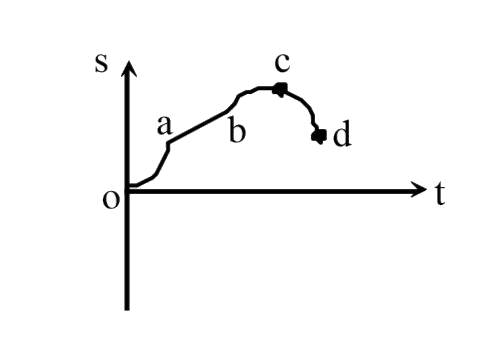
Q. Find the sign of velocity in regions oa, ab, bc and cdView SolutionThe acceleration versus time graph of a particle moving in a straight line is show in figure. The velocity-time graph of the particle would be
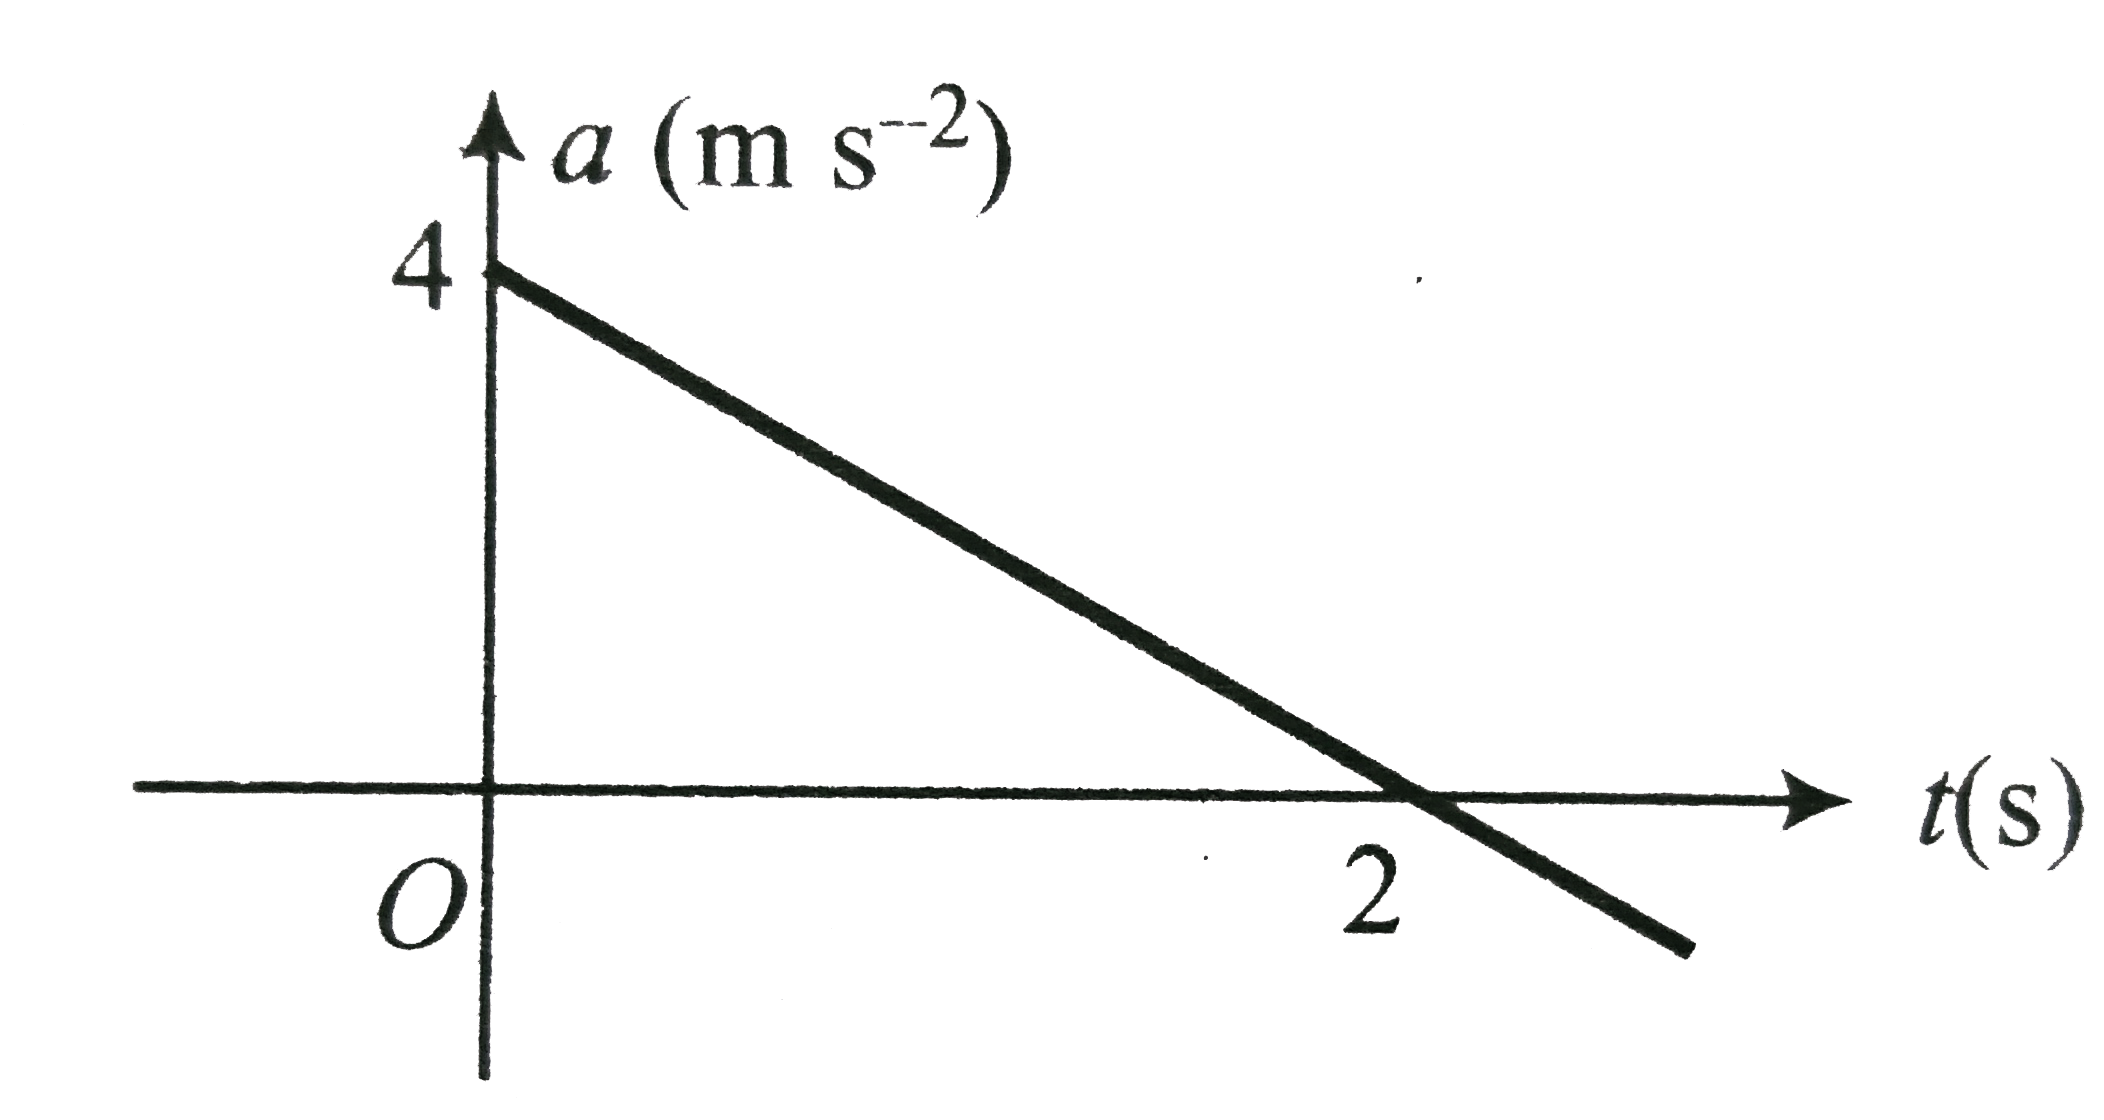 .View Solution
Acceleration time graph of a particle moving along a straight line is given. Then average acceleration between t=0 & t=4 is :−
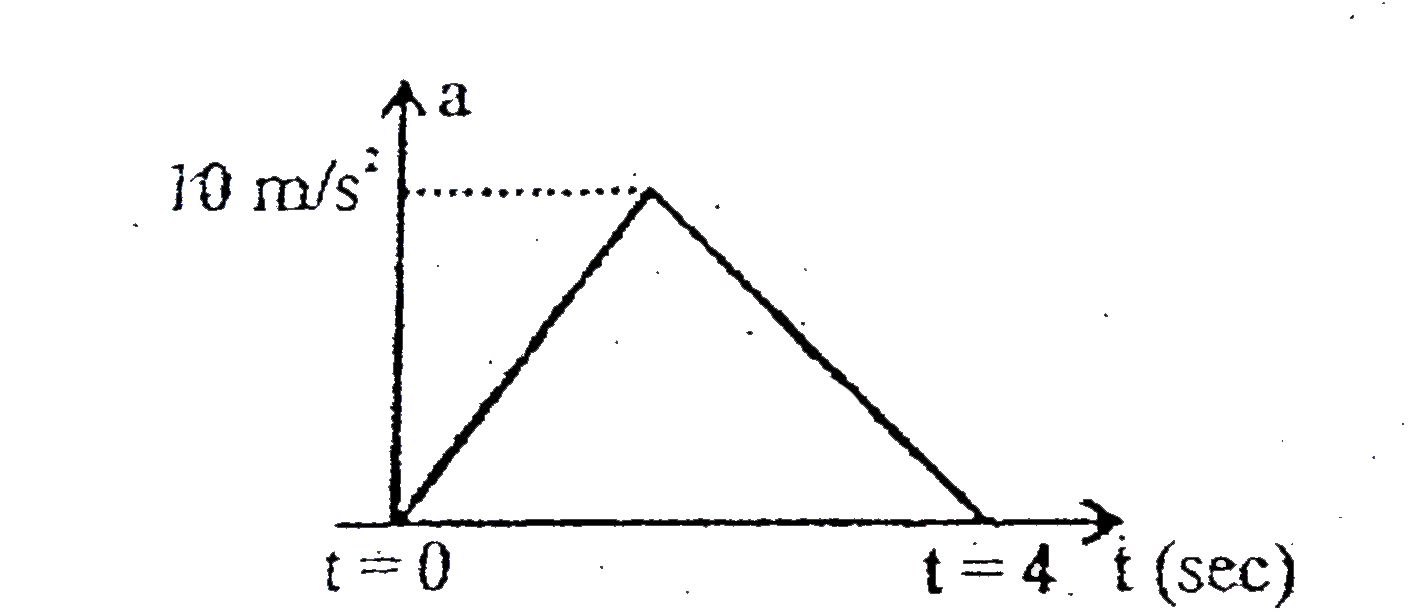 View Solution

