Constant power P is supplied to a particle having mass m and initially at rest. choose correct graph.
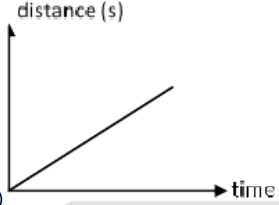
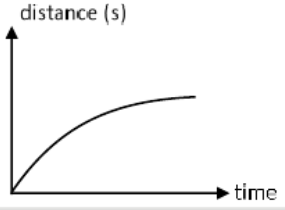

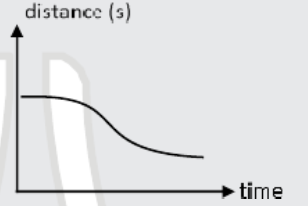
The correct Answer is:C
To solve the problem of a particle with mass m initially at rest and subjected to a constant power P, we need to derive the relationship between distance x and time t. Here’s a step-by-step breakdown of the solution:
Step 1: Understand the relationship between power, work, and energy
Power is defined as the rate at which work is done or energy is transferred. The relationship can be expressed as:
P=dWdt
where W is the work done.
Step 2: Relate power to kinetic energy
The work done on the particle is converted into kinetic energy. The kinetic energy K of a particle is given by:
K=12mv2
If we supply power P for a time t, the total work done (or energy supplied) is:
W=P⋅t
Step 3: Set up the equation for kinetic energy
Since the work done is equal to the change in kinetic energy, we can write:
P⋅t=12mv2
Step 4: Solve for velocity v
Rearranging the equation gives us:
v2=2Ptm
Taking the square root, we find:
v=√2Ptm
Step 5: Relate velocity to distance
Velocity is defined as the rate of change of distance with respect to time:
v=dxdt
Substituting our expression for v:
√2Ptm=dxdt
Step 6: Separate variables and integrate
Rearranging gives:
dx=√2Pm⋅t1/2dt
Now we integrate both sides. The left side integrates to x, and the right side integrates as follows:
∫dx=∫√2Pm⋅t1/2dt
The integral of t1/2 is:
∫t1/2dt=23t3/2
Thus, we have:
x=√2Pm⋅23t3/2+C
Since the particle starts from rest at t=0, C=0. Therefore:
x=2√2P3√mt3/2
Step 7: Analyze the relationship between x and t
From the derived equation, we see that:
x∝t3/2
This indicates that the distance x varies with the time t in a non-linear fashion, specifically as a power function.
Step 8: Identify the correct graph
Since x varies as t3/2, the graph of x versus t will be a curve that starts at the origin and increases steeply as t increases. The correct graph will show this non-linear relationship.
Conclusion
The correct graph representing the relationship between distance and time for a particle under constant power is one that curves upwards, indicating that distance increases with the time raised to the power of 3/2.
---
Power is defined as the rate at which work is done or energy is transferred. The relationship can be expressed as:
P=dWdt
where W is the work done.
The work done on the particle is converted into kinetic energy. The kinetic energy K of a particle is given by:
K=12mv2
If we supply power P for a time t, the total work done (or energy supplied) is:
W=P⋅t
Since the work done is equal to the change in kinetic energy, we can write:
P⋅t=12mv2
Rearranging the equation gives us:
v2=2Ptm
Taking the square root, we find:
v=√2Ptm
Velocity is defined as the rate of change of distance with respect to time:
v=dxdt
Substituting our expression for v:
√2Ptm=dxdt
Rearranging gives:
dx=√2Pm⋅t1/2dt
Now we integrate both sides. The left side integrates to x, and the right side integrates as follows:
∫dx=∫√2Pm⋅t1/2dt
∫t1/2dt=23t3/2
Thus, we have:
x=√2Pm⋅23t3/2+C
Since the particle starts from rest at t=0, C=0. Therefore:
x=2√2P3√mt3/2
From the derived equation, we see that:
x∝t3/2
This indicates that the distance x varies with the time t in a non-linear fashion, specifically as a power function.
Since x varies as t3/2, the graph of x versus t will be a curve that starts at the origin and increases steeply as t increases. The correct graph will show this non-linear relationship.
The correct graph representing the relationship between distance and time for a particle under constant power is one that curves upwards, indicating that distance increases with the time raised to the power of 3/2.
Topper's Solved these Questions
Similar Questions
Knowledge Check
- Question 1 - Select One
A particle moves with constant acceleration a in the positive x-axis. At t=0 the particle is at origin is at rest , then correct graph between (velocity)2 and displacement is :
A B
B C
C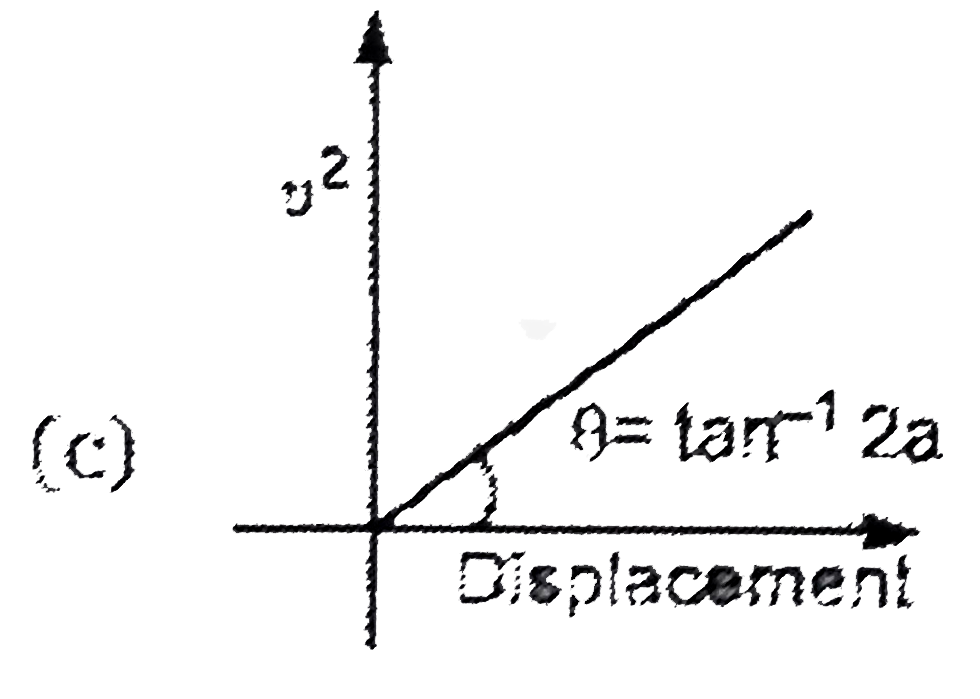 D
D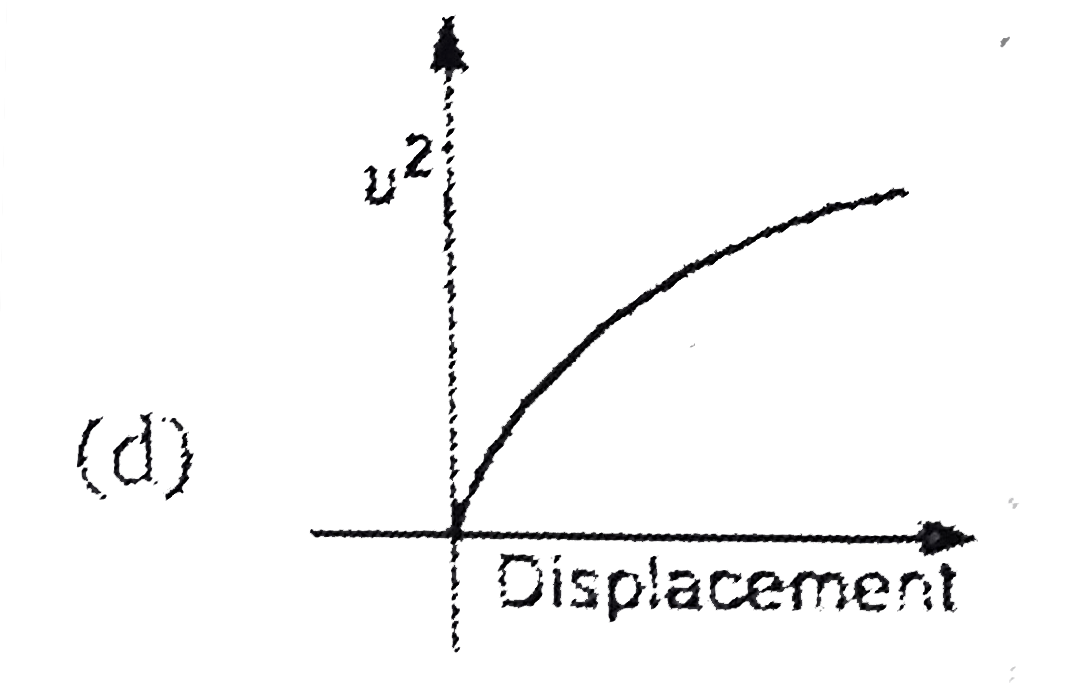
- Question 2 - Select One or More
A force given by the relation F = 8t, (F in Newton and t in sec.) acts on a body of mass 2kg. Initially at rest. Choose the correct option.
APower of force is continuous increasing.BThe work done by this force on the body during first 2 seconds of its motion is 64 J.CVelocity at 2 seconds after beginning of motion is 8 m/s.DPower of force is constant. - Question 3 - Select One
A particle of mass m moving with velocity →V makes a head on elastic collision with another particle of same mass initially at rest. The velocity of the first particle after the collision will be
A→VB−→VC−2→VDZero
A moving particle of mass 'm' makes head-on elastic collision with a particle of mass '2m' which is initially at rest.The fraction of K.E.lost by colliding particle is
View SolutionA moving particle of mass m' makes head-on elastic collision with a particle of mass '2m' which is initially at rest.The fraction of K.E.lost by colliding particle is
View SolutionA particle having charge +q and mass m is approaching (head on) a free particle having mass M and charge 10 q. Initially the mass m is at large distance and has a velocity V0, whereas the other particle is at rest.
(a) Find the final velocity of the two particles when M=20 m.
(b) Find the final state of the two particles if M=m.
 View Solution
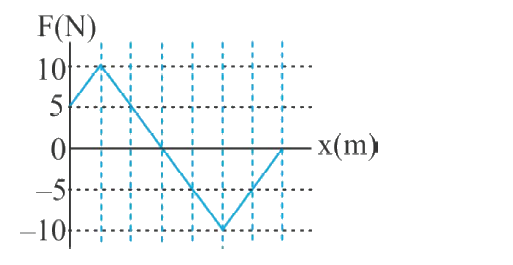
The figure shows the force (F) versus displacement (s) graph for a particle of mass m=2kg initially at rest.
(i) The maximum speed of the particle occurs at x = …..m
(ii) The maximum speed of the particle is ….ms−1
(iii) The particle once again has its speed zero at x =....m
 View Solution
A particle of mass m moving with velocity →V makes a head on elastic collision with another particle of same mass initially at rest. The velocity of the first particle after the collision will be
View Solution

