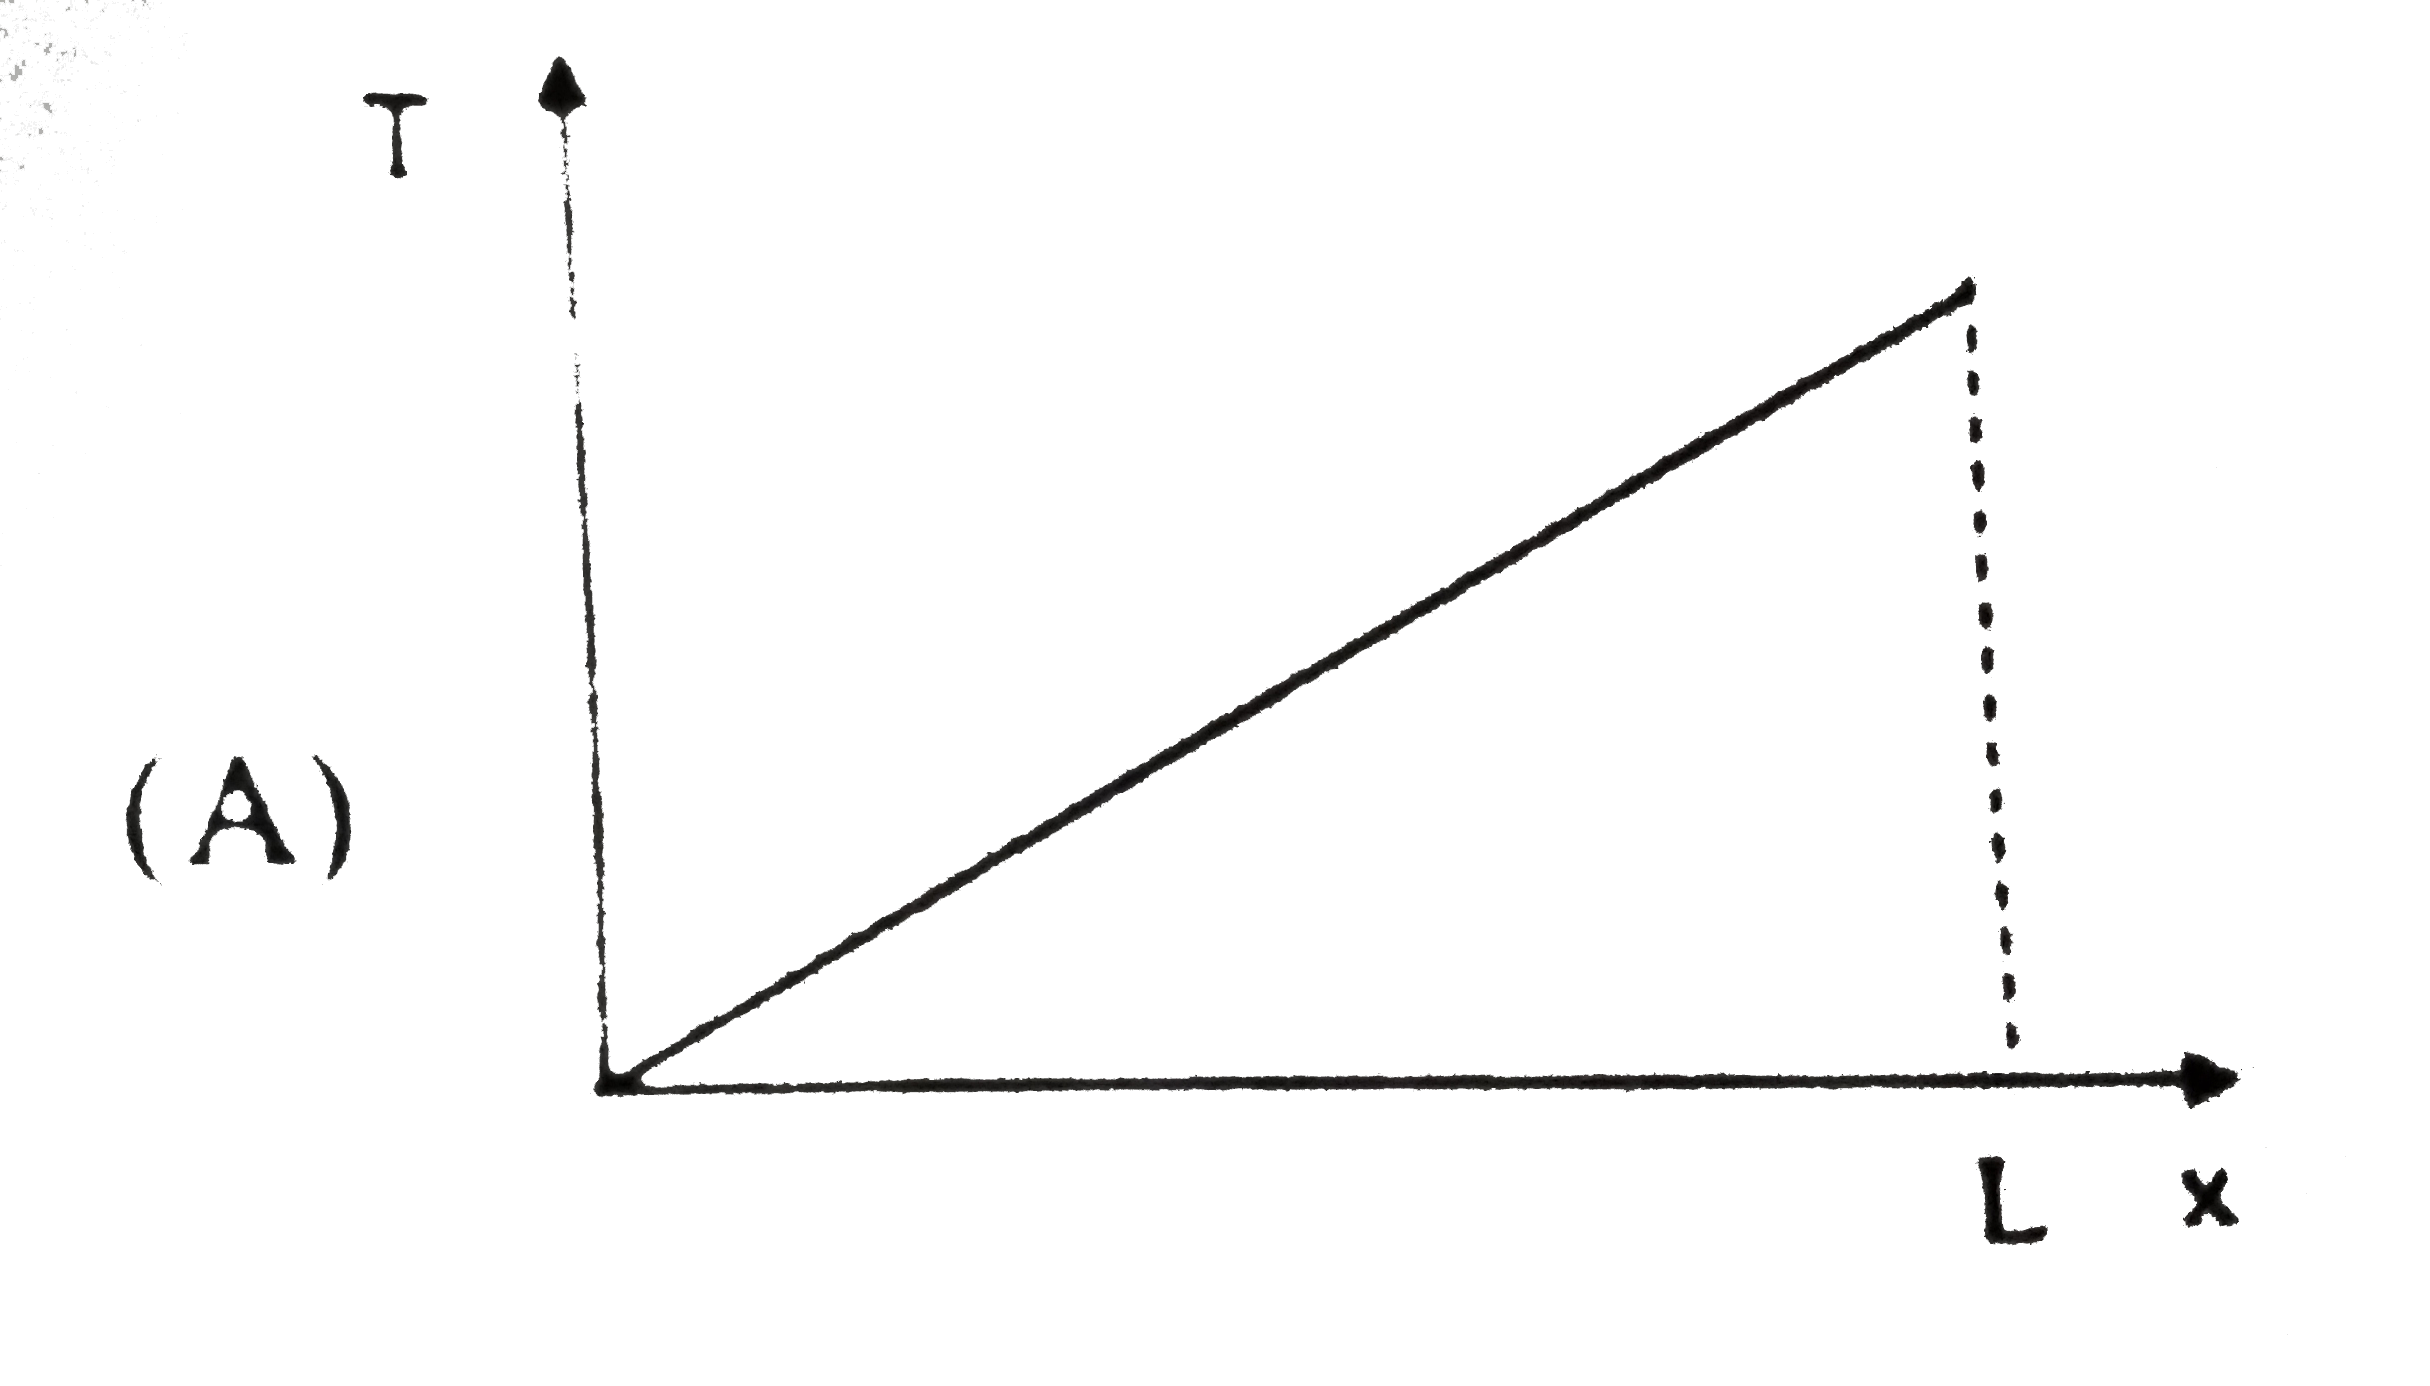
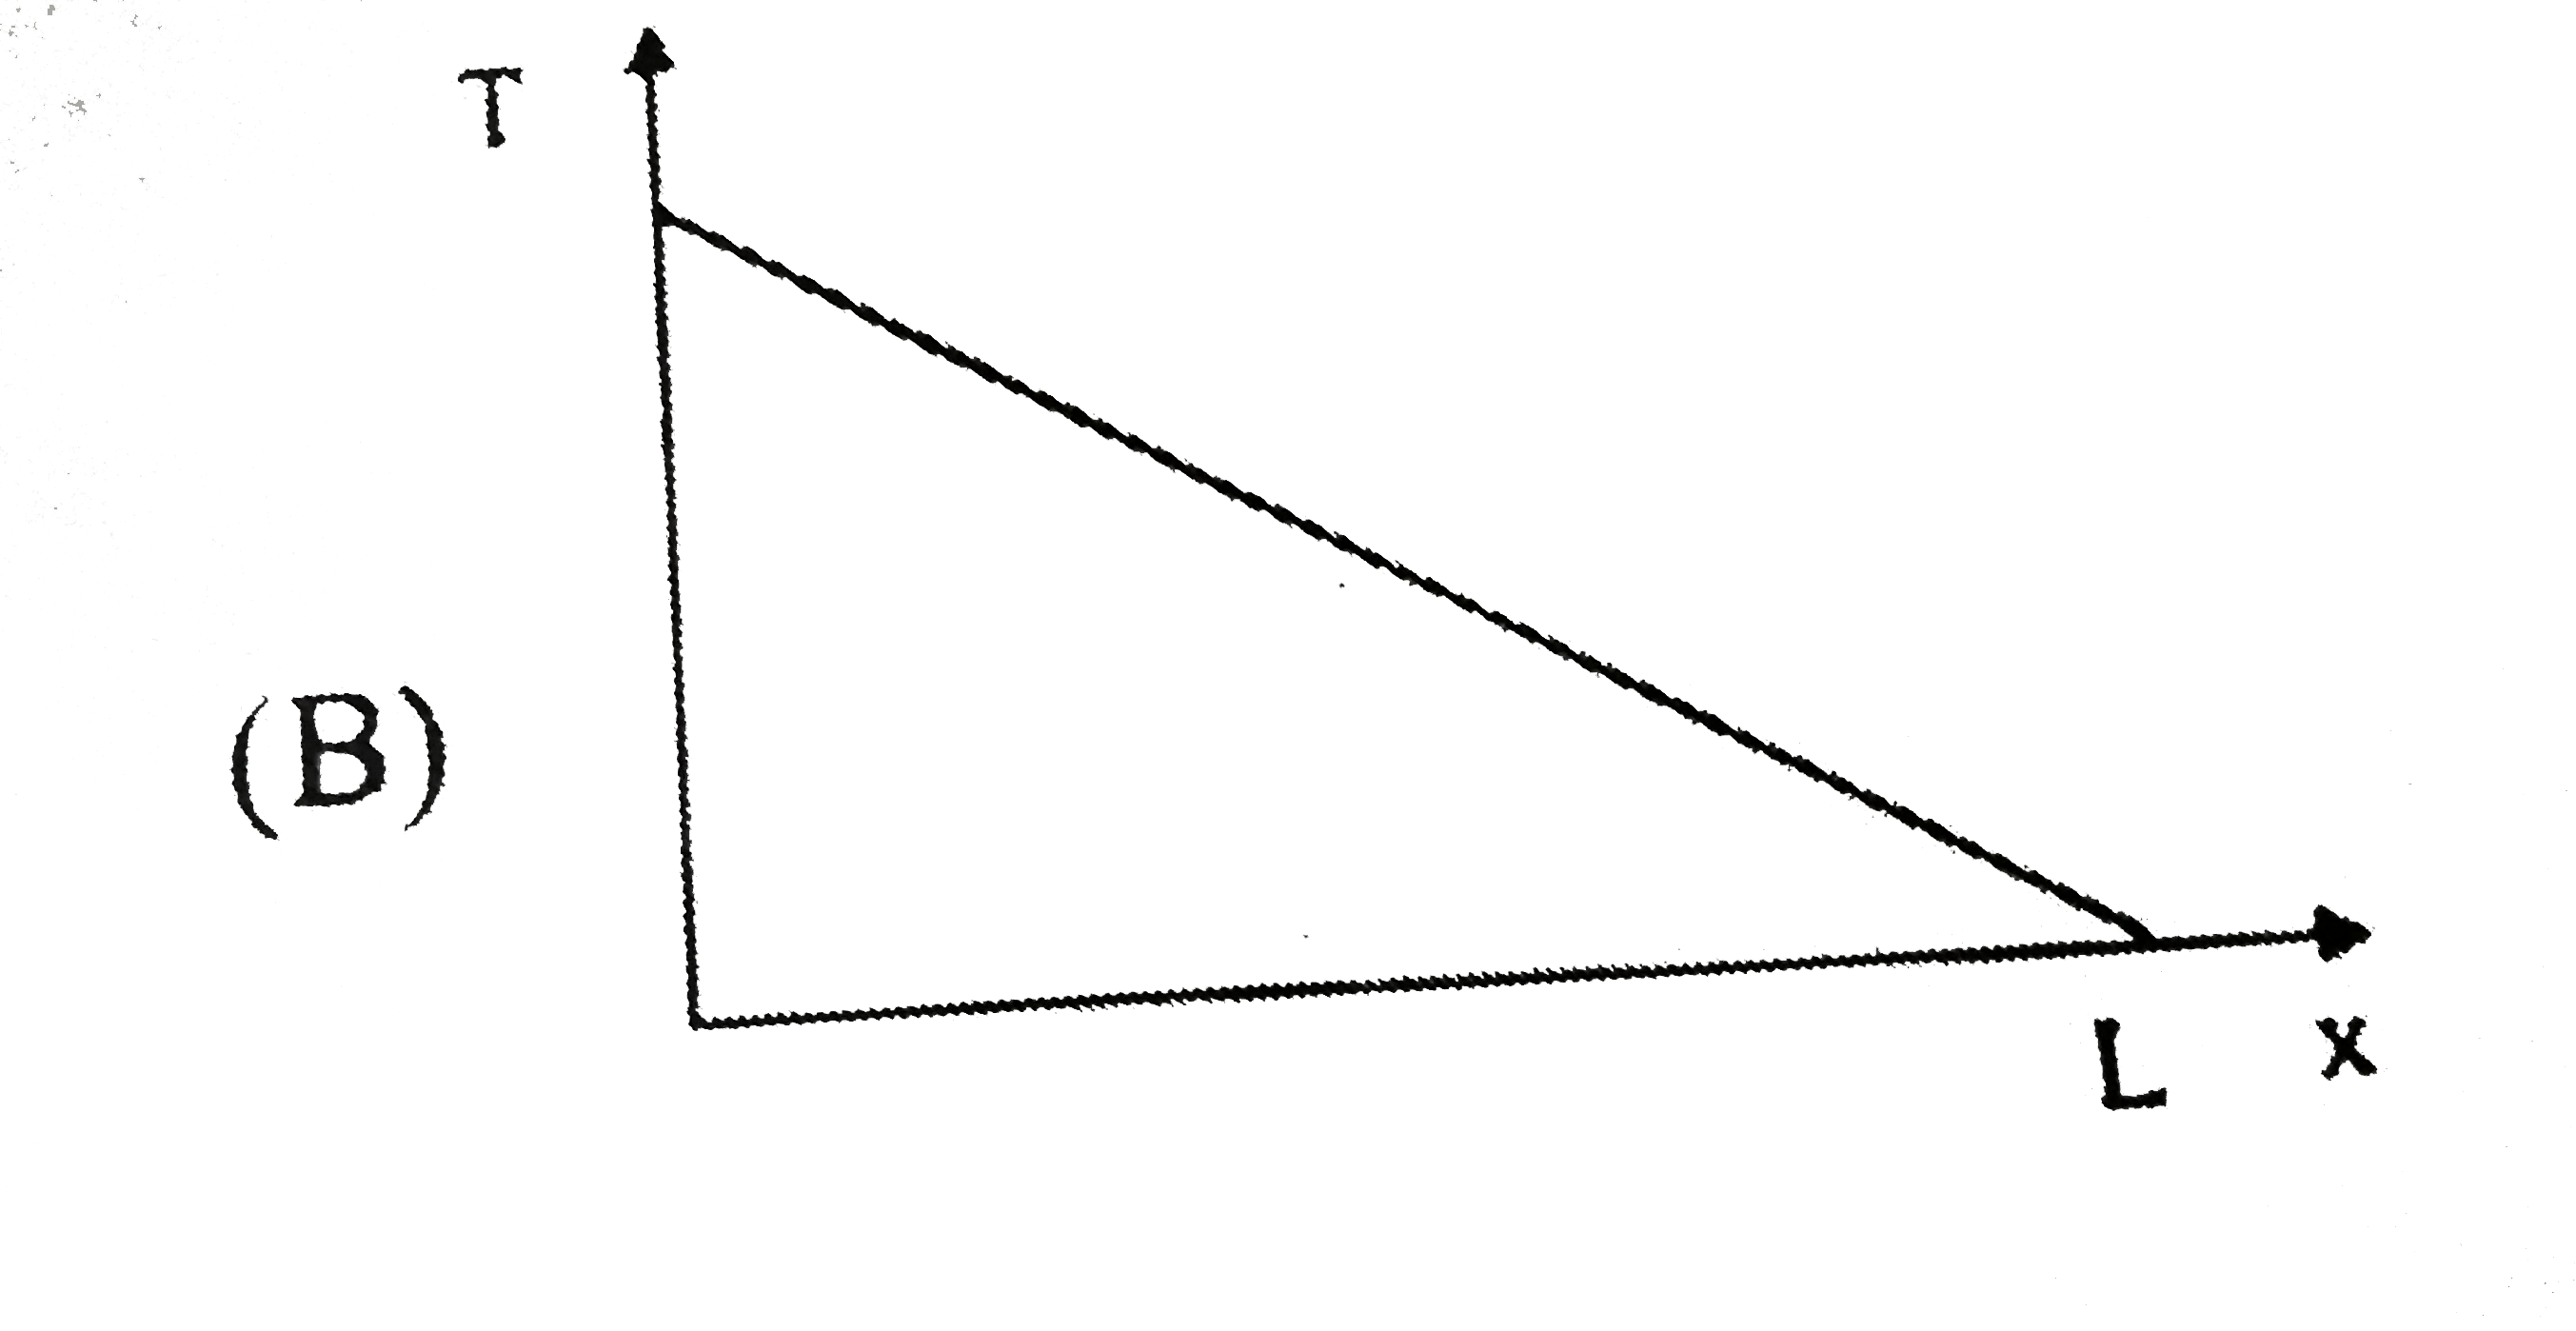
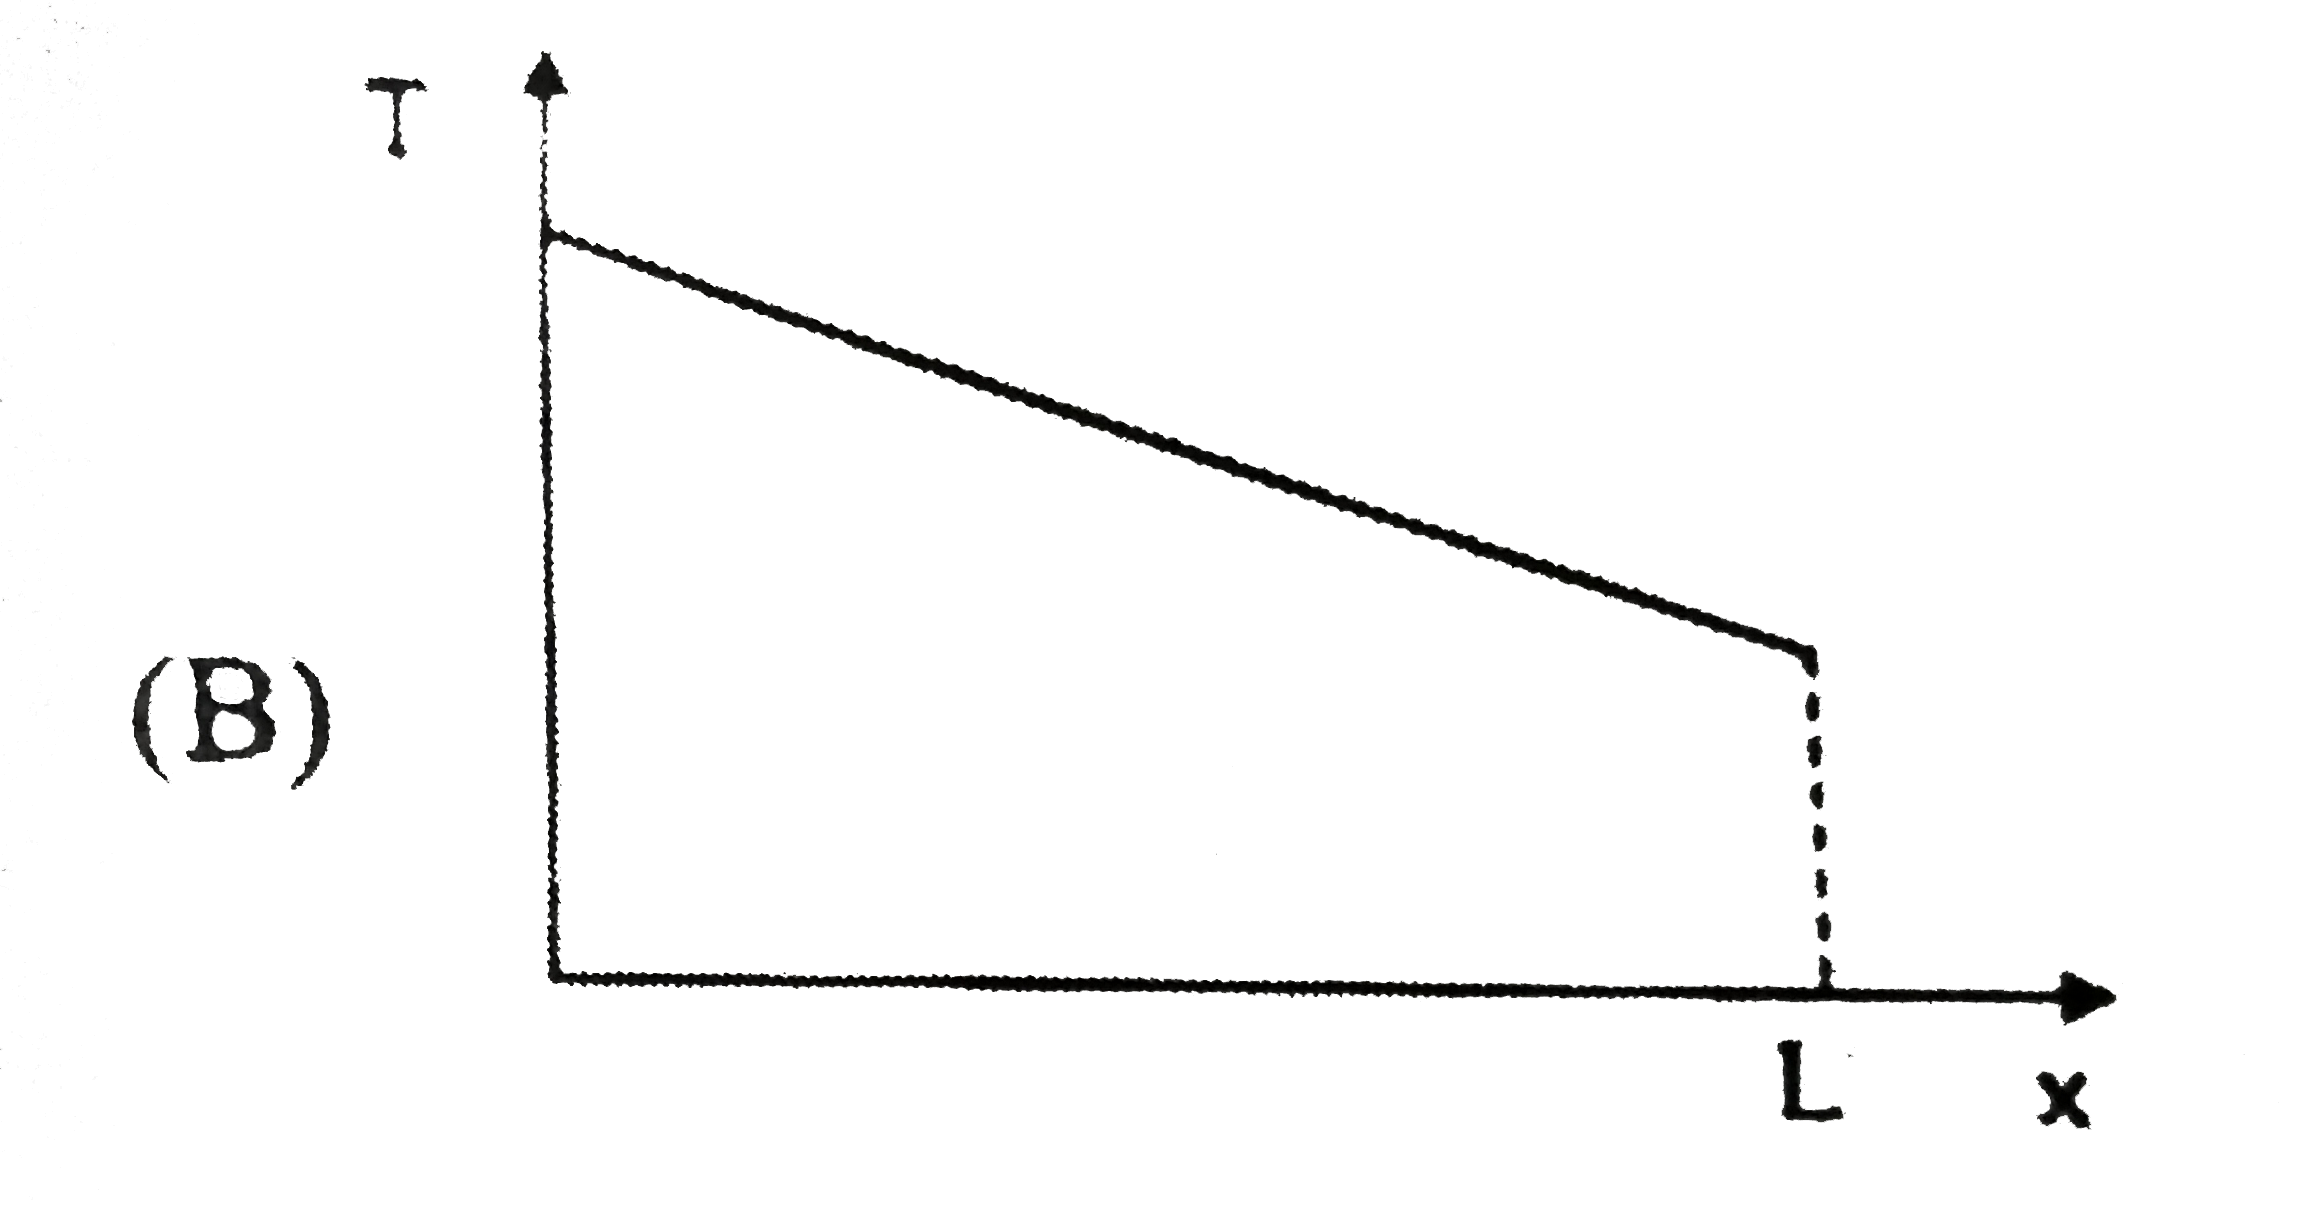
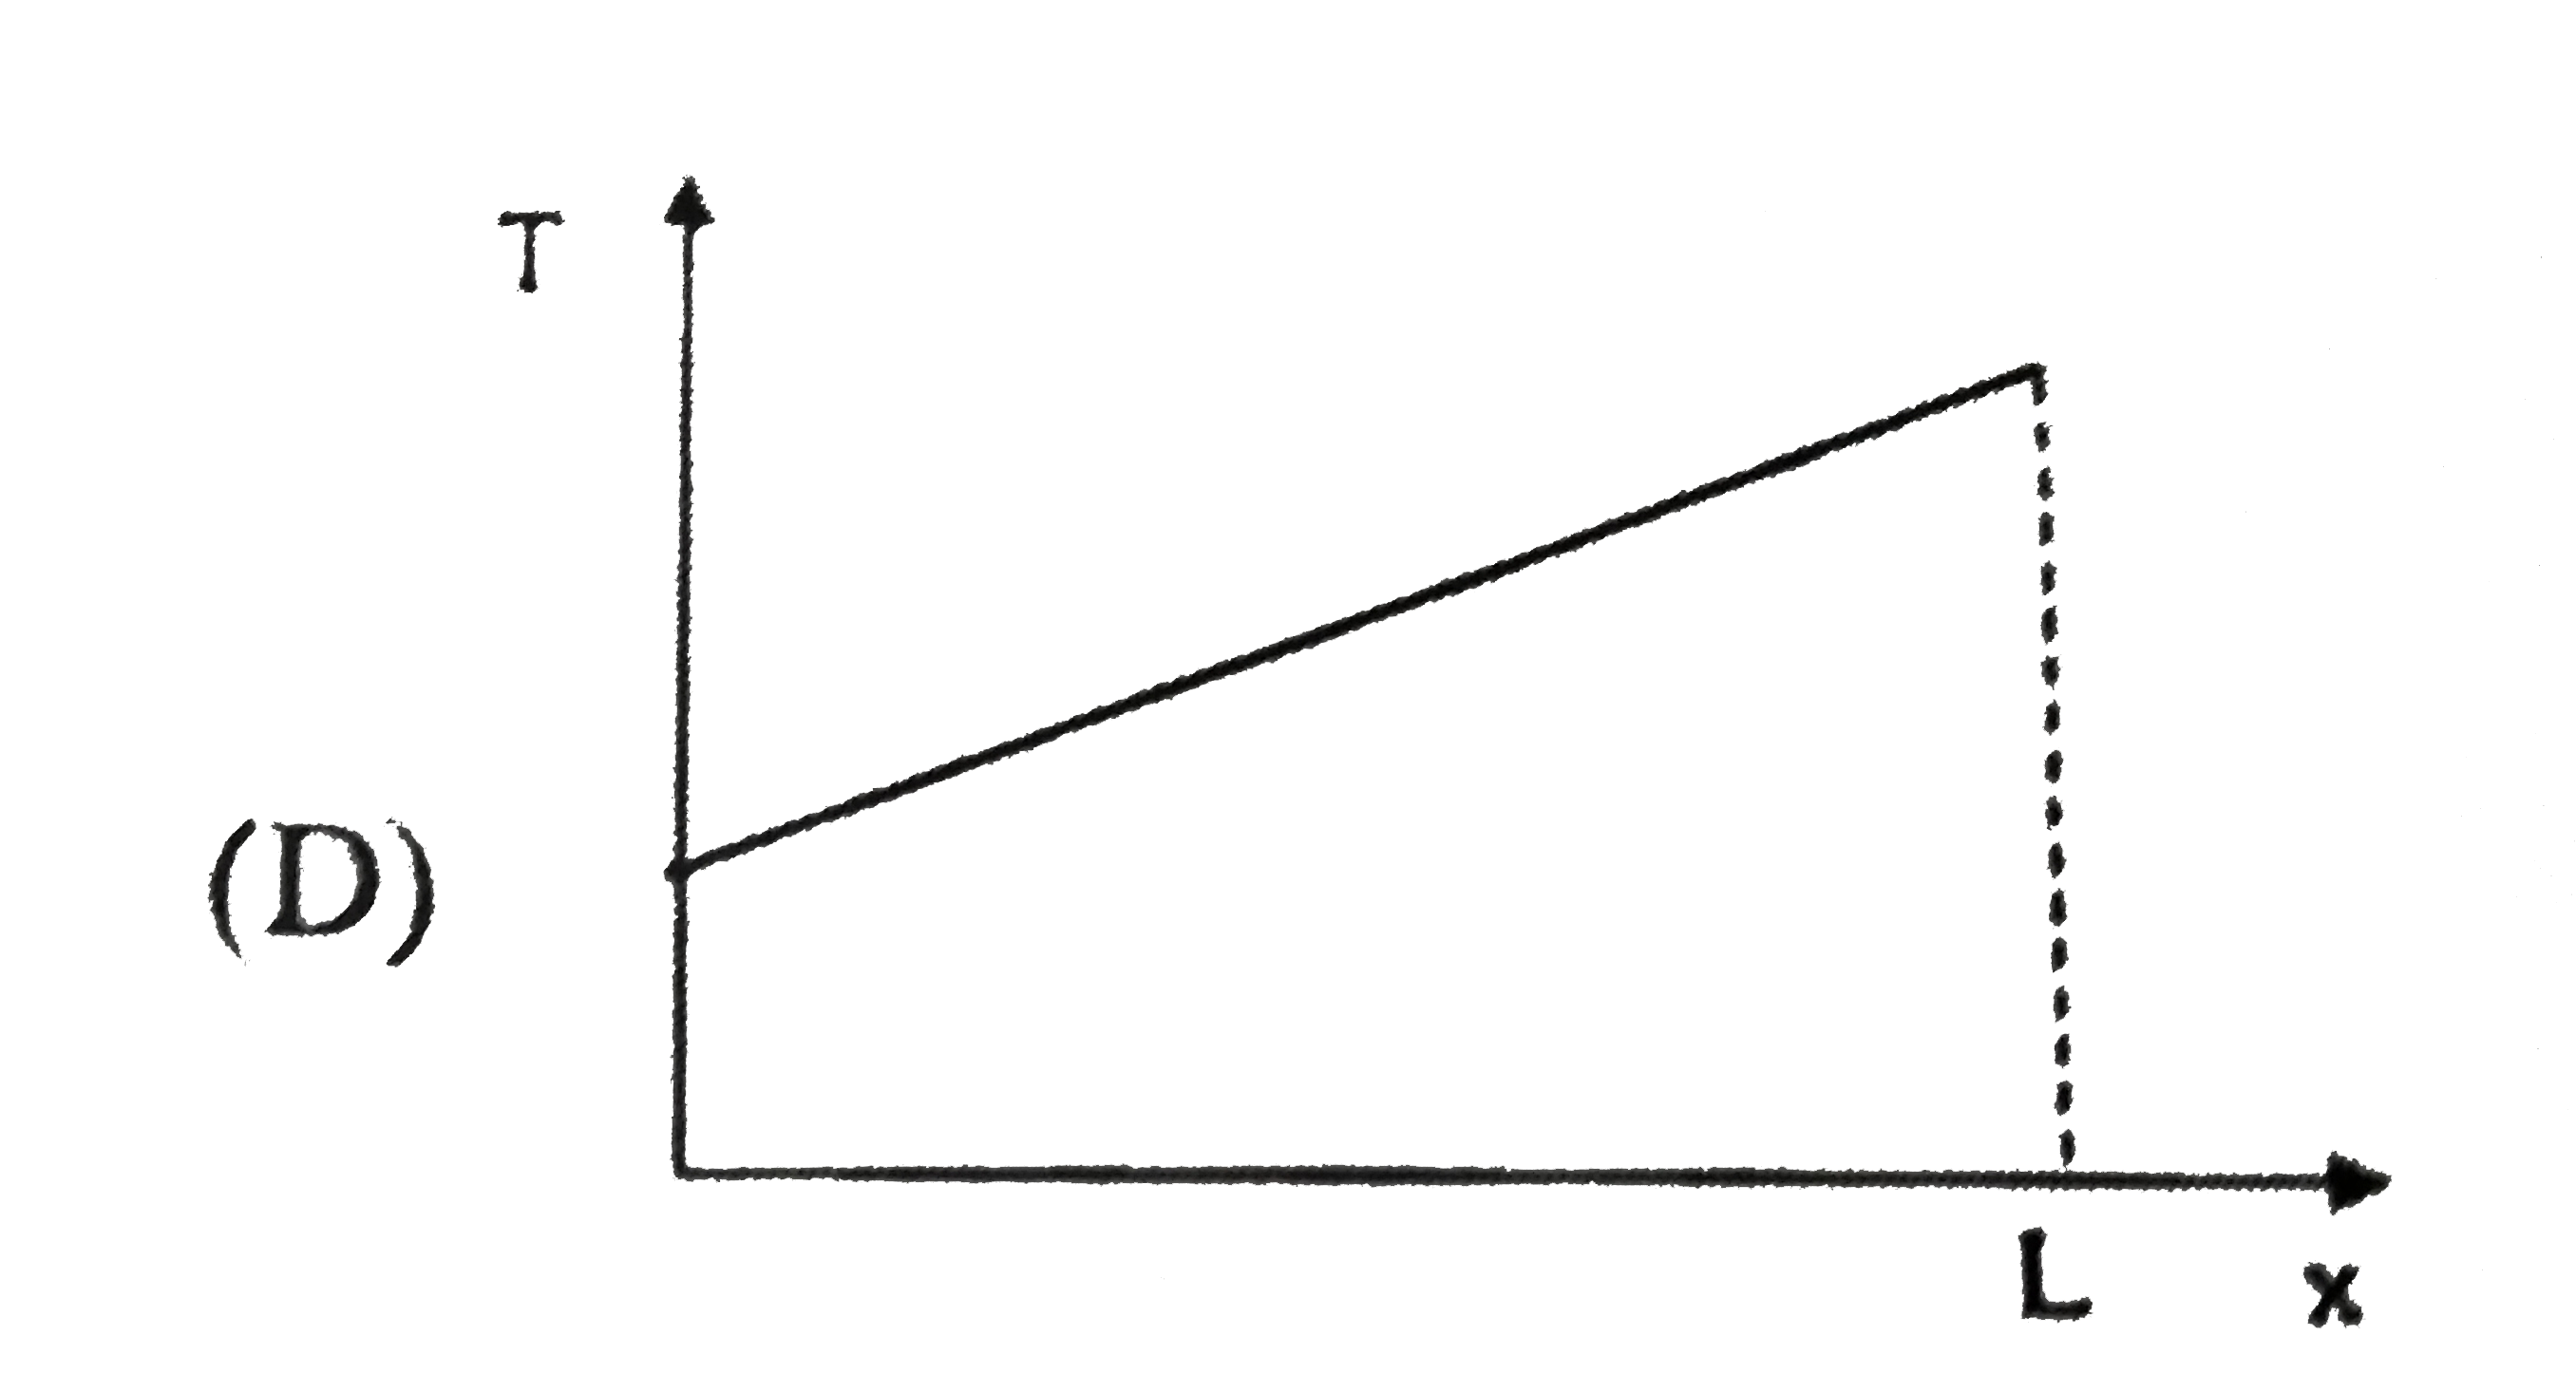
A uniform rope of mass (m) and length (L) placed on frictionless horizontal ground is being pulled by two forces FAandFB at its ends as shown in the figure. As a result, the rope accelerates toward the right.

Which of the following graph best represents variation in tension at a point on the rope with distance x of the point from the end A ?


The correct Answer is:D
Topper's Solved these Questions
- NEWTON'S LAWS OF MOTION & FRICTIONBOOK - ALLENCHAPTER - NEWTON'S LAWS OF MOTION & FRICTIONEXERCISE - EXERCISE (O-2)
31 Videos
- NEWTON'S LAWS OF MOTION & FRICTIONBOOK - ALLENCHAPTER - NEWTON'S LAWS OF MOTION & FRICTIONEXERCISE - EXERCISE (JM)
6 Videos
- NEWTON'S LAWS OF MOTION & FRICTIONBOOK - ALLENCHAPTER - NEWTON'S LAWS OF MOTION & FRICTIONEXERCISE - EXERCISE (S-2)
9 Videos
- MOTION IN A PALNEBOOK - ALLENCHAPTER - MOTION IN A PALNEEXERCISE - SOLVED EXAMPLE
28 Videos
- NEWTONS LAWS OF MOTIONBOOK - ALLENCHAPTER - NEWTONS LAWS OF MOTIONEXERCISE - EXERCISE-III
28 Videos
Similar Questions
A uniform rope of mass (m) and length (L) placed on frictionless horizontal ground is being pulled by two forces FAandFB at its ends as shown in the figure. As a result, the rope accelerates toward the right.

Acceleration (A) of the rope is
View SolutionA uniform rope of mass (m) and length (L) placed on frictionless horizontal ground is being pulled by two forces FAandFB at its ends as shown in the figure. As a result, the rope accelerates toward the right.

Tension (T) at the mid point of the pore is
View Solution
Knowledge Check
A uniform rope of mass (m) and length (L) placed on frictionless horizontal ground is being pulled by two forces FAandFB at its ends as shown in the figure. As a result, the rope accelerates toward the right.

Acceleration (A) of the rope isAzeroBa=FA+FBmCa=FA−FBmDa=FB−FAmA uniform rope of mass (m) and length (L) placed on frictionless horizontal ground is being pulled by two forces FAandFB at its ends as shown in the figure. As a result, the rope accelerates toward the right.

Tension (T) at the mid point of the pore isAT=FB−FABT=FA−FBCT=12(FB−FA)DT=12(FA−FB)A rope of length L is pulled by a constant force F. What is the tension in the rope at a distance x from the end where the force is applied ?
AFL/xBF(L−x)/LCFL/(L−x)DFx/(L−x)
A uniform rope of mass (m) and length (L) placed on frictionless horizontal ground is being pulled by two forces FAandFB at its ends as shown in the figure. As a result, the rope accelerates toward the right.

Expression Tx of tension at a point at distance x from the end A is
View SolutionA uniform rope of length L, resting on a frictionless horizontal table is pulled at one end by a force F. What is the tension in the rope at a distance x form the end where the force is applied?
View SolutionA horizontal uniform rope of length L, resting on a frictionless horizontal surface, is pulled at one end by force F. What is the tension in the rope at a distance l from the end where the force is applied?
View SolutionA uniform rope of length L , resting on frictionless horizontal table is pulled at one end by a force F . What is the tension in the rope at a distance x from the end where the force is applied ?
[ Hint : Consider the motion of the entire rope and the motion of x length of rope using P = ma formula and third law of motion ]
View SolutionA uniform rope of length 10m is on a smooth horizontal surface. It is being pulled by a horizontal force of 20N at one end. The ratio of tension at a distance of 4m from force end to tension at a distance of 4m from free end is
View Solution
