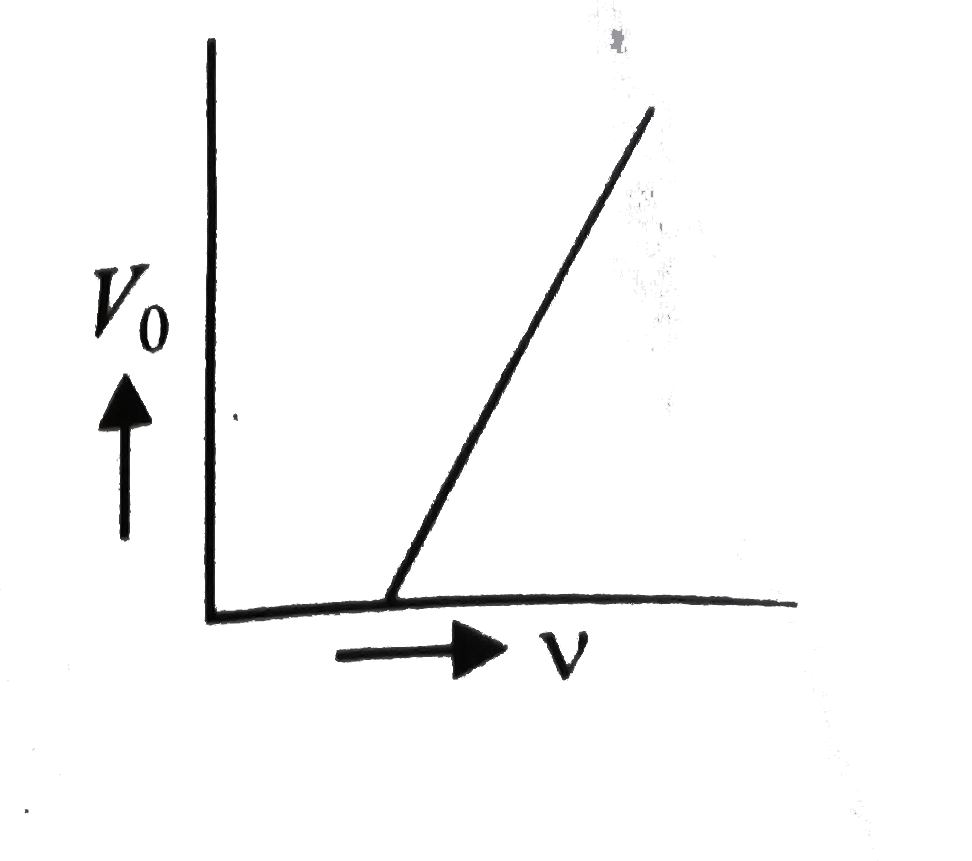
Why wave theory of light could not explain the photoelectric effect ? State two reasons. Draw graph between frequency vs stopping potential .
Step-by-Step Solution
1. Understanding the Photoelectric Effect: The photoelectric effect refers to the phenomenon where electrons are ejected from a metal surface when light of a certain frequency shines on it. This effect cannot be explained by the classical wave theory of light.
2. Reason 1 - Instantaneous Ejection of Electrons: According to wave theory, light is a wave that carries energy. If this were true, there would be a time delay between the incident light striking the metal and the ejection of electrons. However, experiments show that electrons are emitted almost instantaneously when light of sufficient frequency hits the metal surface. This absence of lag time contradicts the predictions made by wave theory.
3. Reason 2 - Threshold Frequency: Wave theory suggests that increasing the intensity of light (regardless of frequency) should eventually lead to the ejection of electrons. However, the photoelectric effect only occurs when the frequency of the incident light is above a certain threshold frequency specific to the material. If the frequency is below this threshold, no electrons are emitted, regardless of the intensity. This phenomenon cannot be explained by the wave theory, which does not account for a cutoff frequency.
4. Graph Between Frequency (ν) and Stopping Potential (V₀):
- The stopping potential (V₀) is the potential needed to stop the most energetic photoelectrons emitted from the metal surface.
- The graph of frequency (ν) versus stopping potential (V₀) is a straight line that shows a linear relationship. As the frequency increases, the stopping potential also increases.
- The graph can be represented as:
- X-axis: Frequency (ν)
- Y-axis: Stopping Potential (V₀)
- The slope of the line represents the proportionality constant (Planck's constant divided by the charge of the electron).
Graph Representation:
V₀∣∣|/||/|/∣∣|/|/∣∠____________ν
- The stopping potential (V₀) is the potential needed to stop the most energetic photoelectrons emitted from the metal surface.
- The graph of frequency (ν) versus stopping potential (V₀) is a straight line that shows a linear relationship. As the frequency increases, the stopping potential also increases.
- The graph can be represented as:
- X-axis: Frequency (ν)
- Y-axis: Stopping Potential (V₀)
- The slope of the line represents the proportionality constant (Planck's constant divided by the charge of the electron).
V₀∣∣|/||/|/∣∣|/|/∣∠____________ν
Topper's Solved these Questions
- DUAL NATURE OF MATTER AND RADIATION & ATOMS AND NUCLEIBook:CBSE COMPLEMENTARY MATERIALChapter:DUAL NATURE OF MATTER AND RADIATION & ATOMS AND NUCLEIExercise:NUMERICALS
Explore 6 Videos
- CBSE EXAMINATION PAPER, DELHI REGION - 2015 (CODE NO. 55/1/1/D)Book:CBSE COMPLEMENTARY MATERIALChapter:CBSE EXAMINATION PAPER, DELHI REGION - 2015 (CODE NO. 55/1/1/D)Exercise:SECTION E
Explore 6 Videos
- ELECTROMAGNETIC WAVES AND OPTICSBook:CBSE COMPLEMENTARY MATERIALChapter:ELECTROMAGNETIC WAVES AND OPTICSExercise:1 mark question
Explore 11 Videos
Similar Questions
Why wave theory of light could not explain the photoelectric effect ? State two reasons. Draw graph between Intensity vs photoelectric current.
View SolutionWhy wave theory of light could not explain the photoelectric effect ? State two reasons. Draw graph between anode potential vs photoelectric current .
View Solution
Knowledge Check
Choose the correct option for the graph between the frequency of incident light and the stopping potential.
AIt is a parabolaBIt is a straight lineCIt is a hyperbolaDIt is a circleThe emission of electrons from a metal surface exposed rto light radaition of appropriate wavelength is called photoelectroic effect .The emmited electron are called photo=-weklectron work function of threshold energy may be defined as the minimum amount of energy required to ejercted electron from a most surface .According to Einstein
Maximum kinetic energy of ejected electron = Aborbed energy - Work function
12mv2max=h(v)−h(vn)=hv[1λ−1λn]
Where vn and λ0 are thereshold frequency and threshold wavelength respectively
Sopping potential : it is the miximum potential at which the photoelectric current becomes zero if V0 is the stopping potential eV0=h(v−v0)
In the photoelectric currect effect the shape of strainght line graph between stopping potential (V0) and frequency of incident light (V) gves
 Acharge on electronBwork function of emitterCplak's constantDratio of plank's constyant to charge on electron
In photoelectric effect the slope of stop of stopping potential versus frequency of incident light for a given surface will be
A10−14B5×10−14C4×10−15D4×10−34
Write Einstein’s photoelectric equation. Define the threshold frequency v0 and stopping potential V0.
View Solutionthe photoelectric effect can not be explained by the wave theory of light because:
View SolutionThe wave theory of radiation cannot explain………. Existence of threshold frequency, dependent of photocurrent on intensity, dependence of stopping potential on frequency, that stopping potentila is independent of intensity?
View SolutionIn a photoelectric effect experiment, the slope of the graph between the stopping potential and the incident frequency will be :
View SolutionIn a photoelectric effect experiment, the slope of the graph between the stopping potential and the incident frequency will be :
View Solution