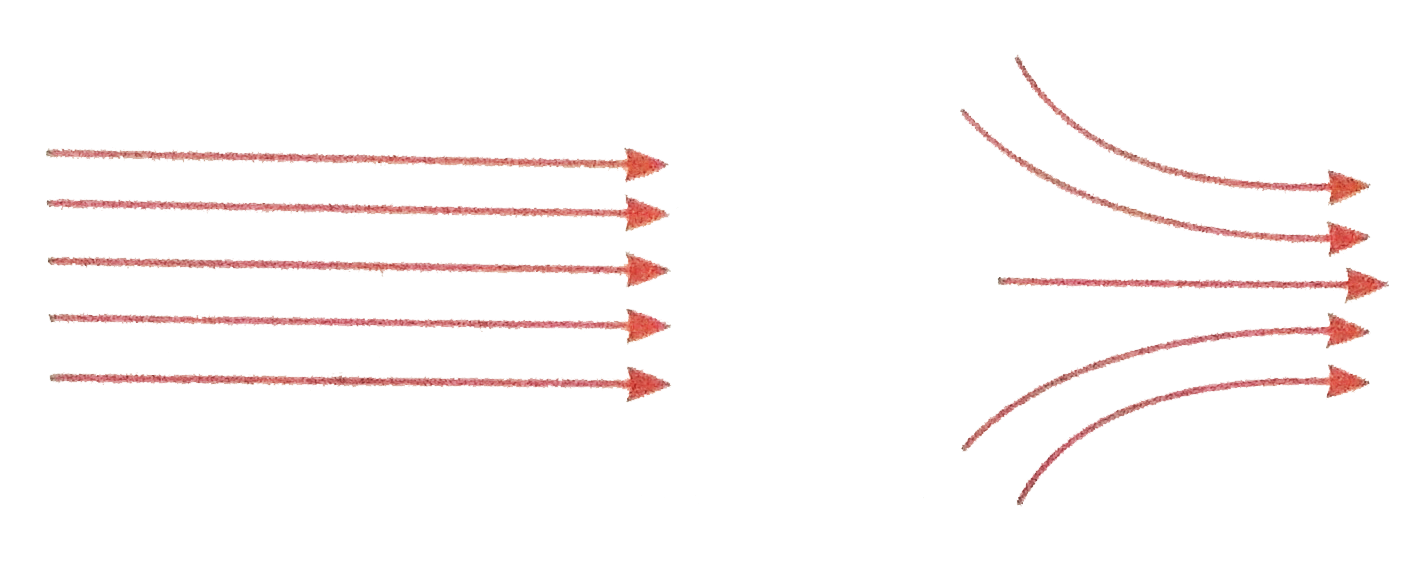
Drawings I and II show to samples of electric field lines

The electric fields in both I and I I are produced by negative charge located somewhere on the left and positive charges located somewhere on the right
In both I and II the electric field is the same every where
In both cases the field becomes stronger on moving form left to righ
The electric field in I is the same everywhere, but in II the electric field becomes stronger on moving from left to right.
The correct Answer is:D
Step by step video, text & image solution for Drawings I and II show to samples of electric field lines by Physics experts to help you in doubts & scoring excellent marks in Class 12 exams.
Topper's Solved these Questions
- BOOK - NARAYNACHAPTER - ELECTRIC CHARGES AND FIELDSEXERCISE - EXERCISE -1 (C.W)24videos
ELECTRIC CHARGES AND FIELDS
- BOOK - NARAYNACHAPTER - ELECTRIC CHARGES AND FIELDSEXERCISE - EXERCISE -1 (H.W)27videos
ELECTRIC CHARGES AND FIELDS
- BOOK - NARAYNACHAPTER - ELECTRIC CHARGES AND FIELDSEXERCISE - EVALUATE YOURSELF-46videos
ELECTRIC CHARGES AND FIELDS
- BOOK - NARAYNACHAPTER - DUAL NATUREEXERCISE - LEVEL-II (H.W)17videos
DUAL NATURE
- BOOK - NARAYNACHAPTER - ELECTRO MAGNETIC INDUCTIONEXERCISE - Level-II (H.W)23videos
ELECTRO MAGNETIC INDUCTION
Similar Questions
Knowledge Check
- Question 1 - Select One
Drawings I and II show two samples of electric field lines
 AThe electric fields in both I and II are produced .by negative charge located somewhere on the left and positive charges located somewhere on the rightBIn both I and II the electric field is same every whereCIn both cases the field becomes stronger on moving form left to rightDThe electric field in I is the same everywhere ,but in II the electric field becomes stronger on moving from left and right
 - Question 2 - Select One
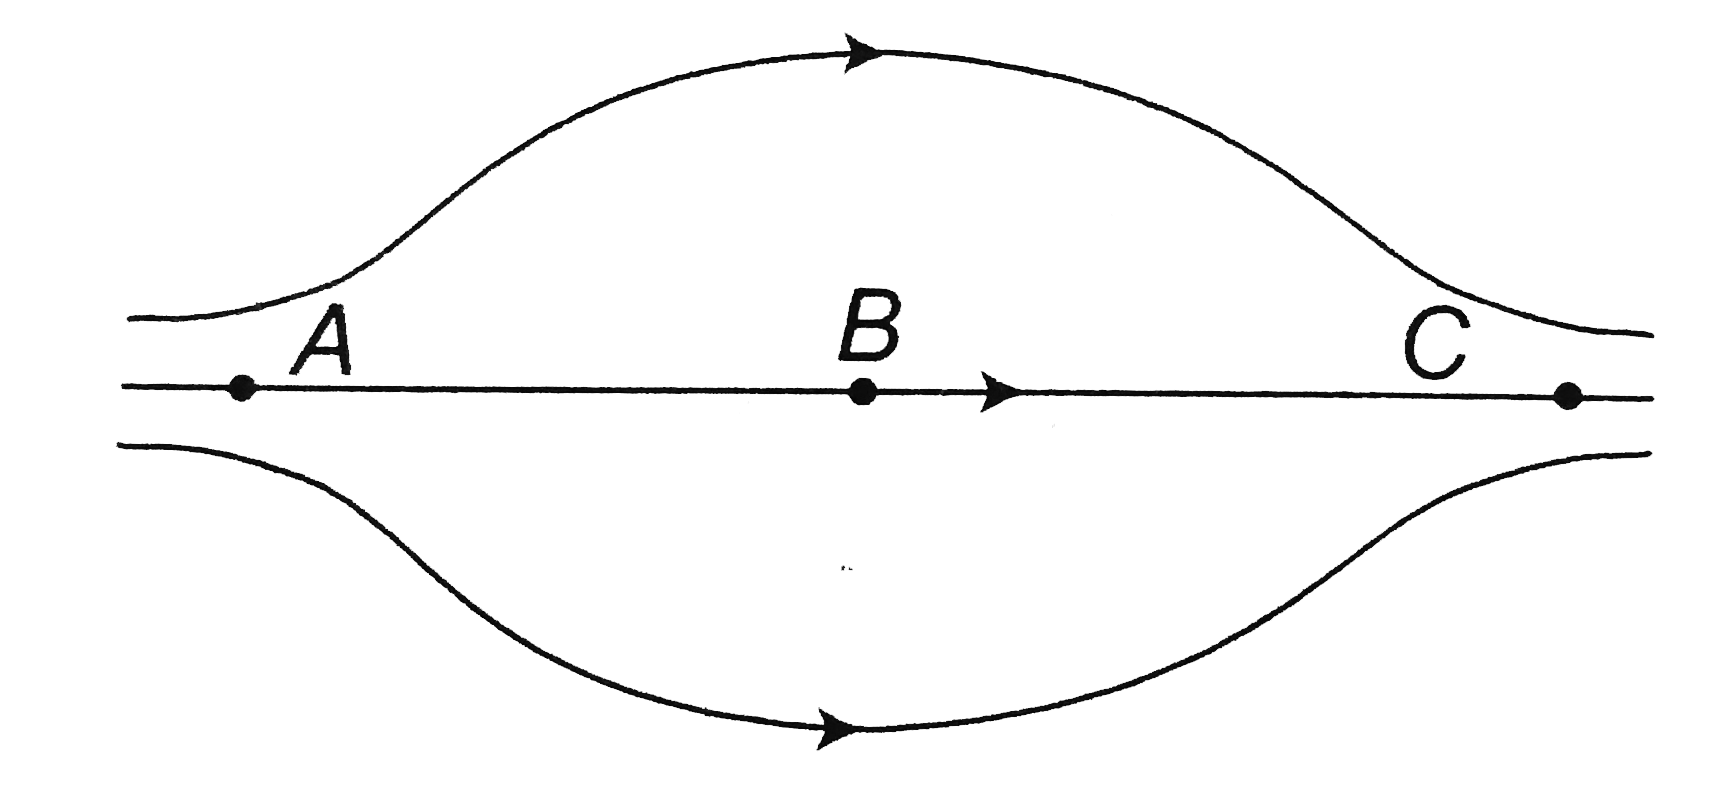
The figure shows some of the electric field lines corresponding to an electric field. The figure suggests
 AEa>EB>ECBEA=EB=ECCEa=EC>EBDEA>EC>EB
 - Question 3 - Select One
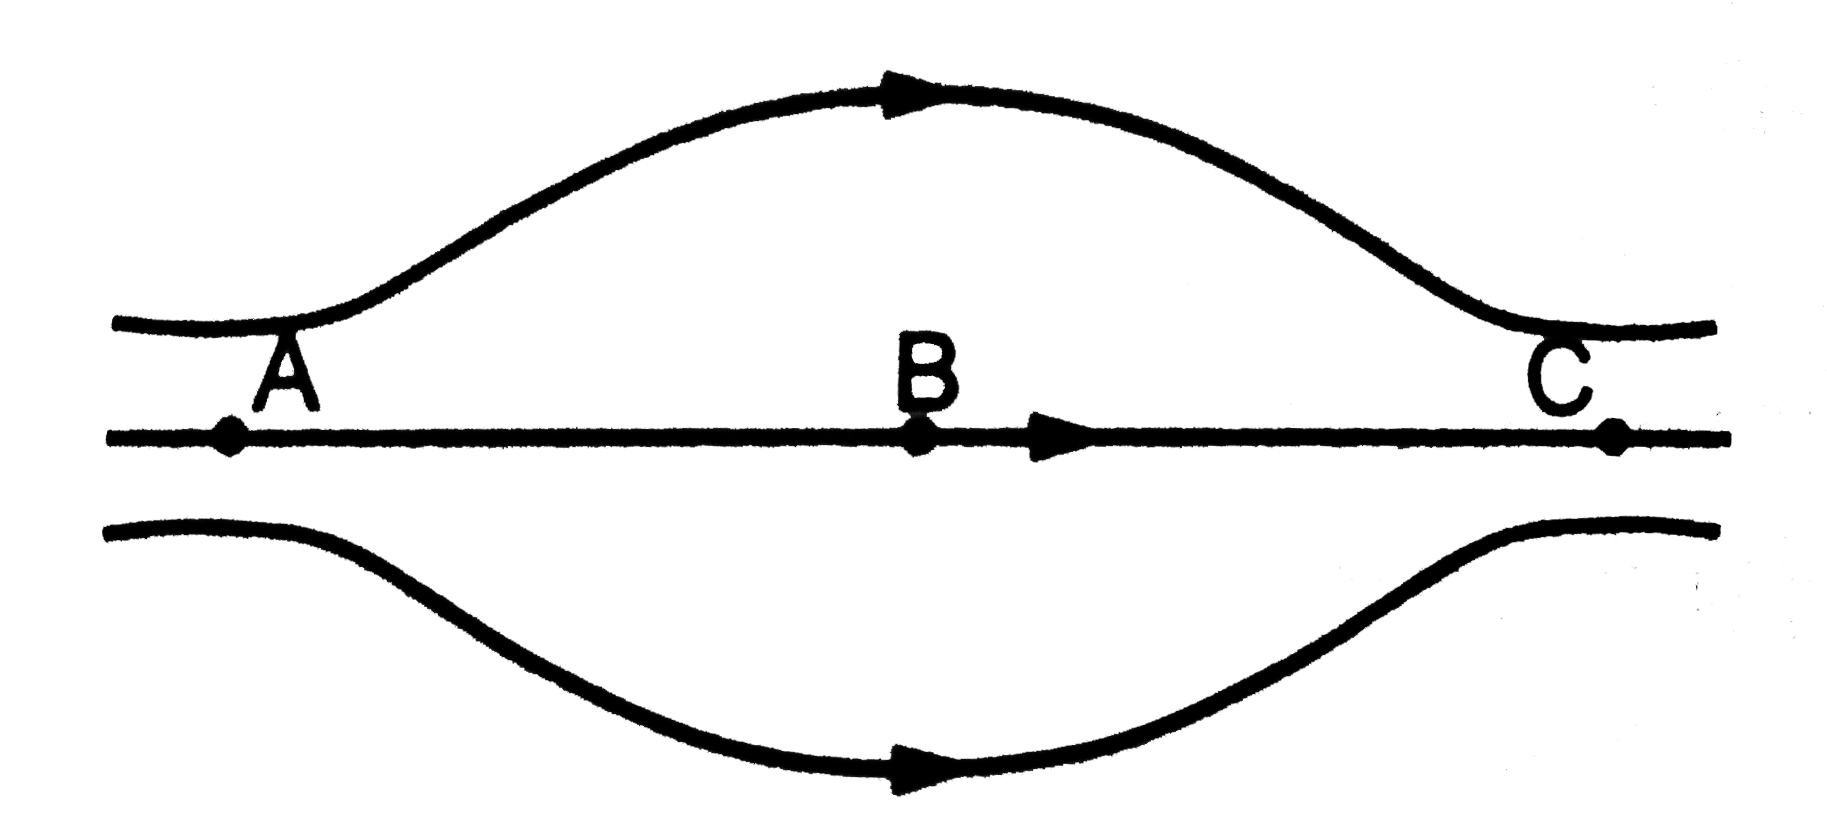
The figure shows some of the electric field lines corresponding to an electric field. The figure suggests
 AEA>EB>ECBEA=EB=ECCEA=EC>EBDEA>EC<EB
A thin long conductor has linear charge density of 20 μC/m. Calculate the electric field intensity at a point 5 cm from it. Draw a graph to show variation of electric field intensity with distance from the conductor.
View SolutionElectric field lines due to charge
View SolutionDraw a plot showing the variation of (i) electric field E, and (ii) electric potential V with distance 'r' due to a point charge Q.
View SolutionFigure shows some of the electric field lines correspoinding to an electric field. The figure suggests that
 View Solution
The figure shows some of the electric field lines corresponding to an electric field. The figure suggests
 View Solution

