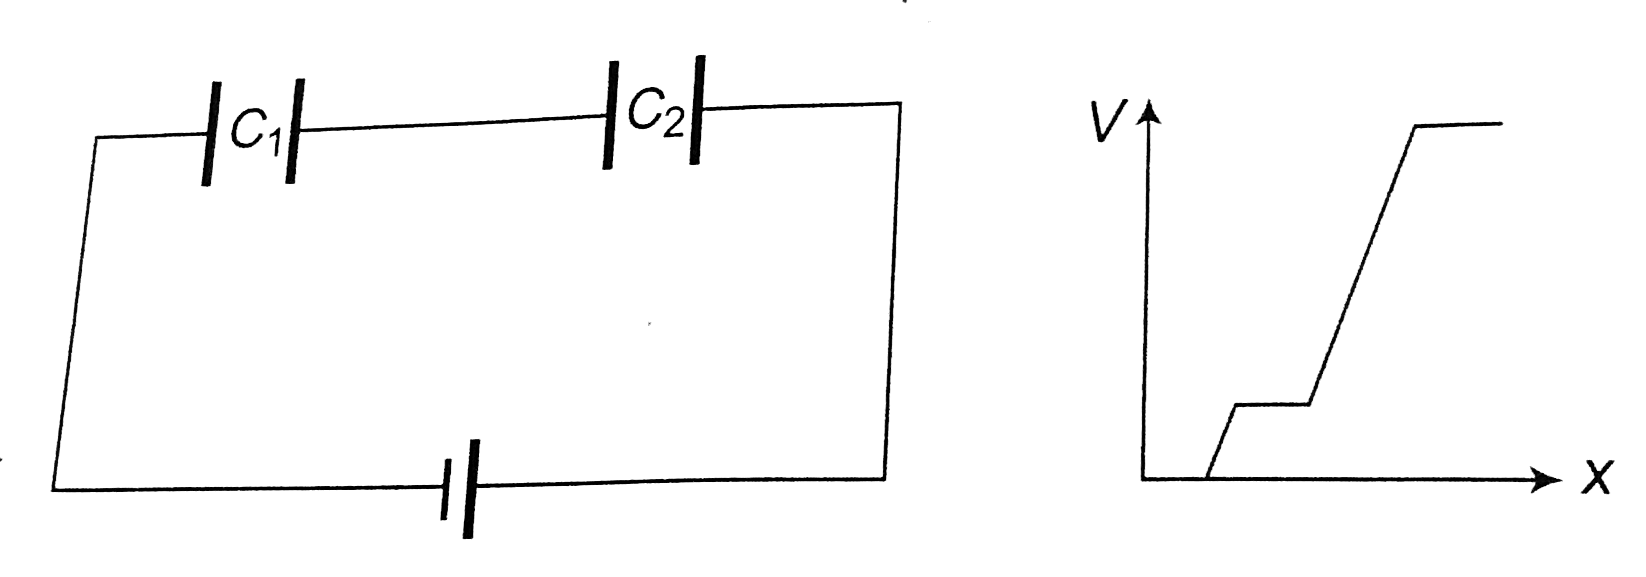
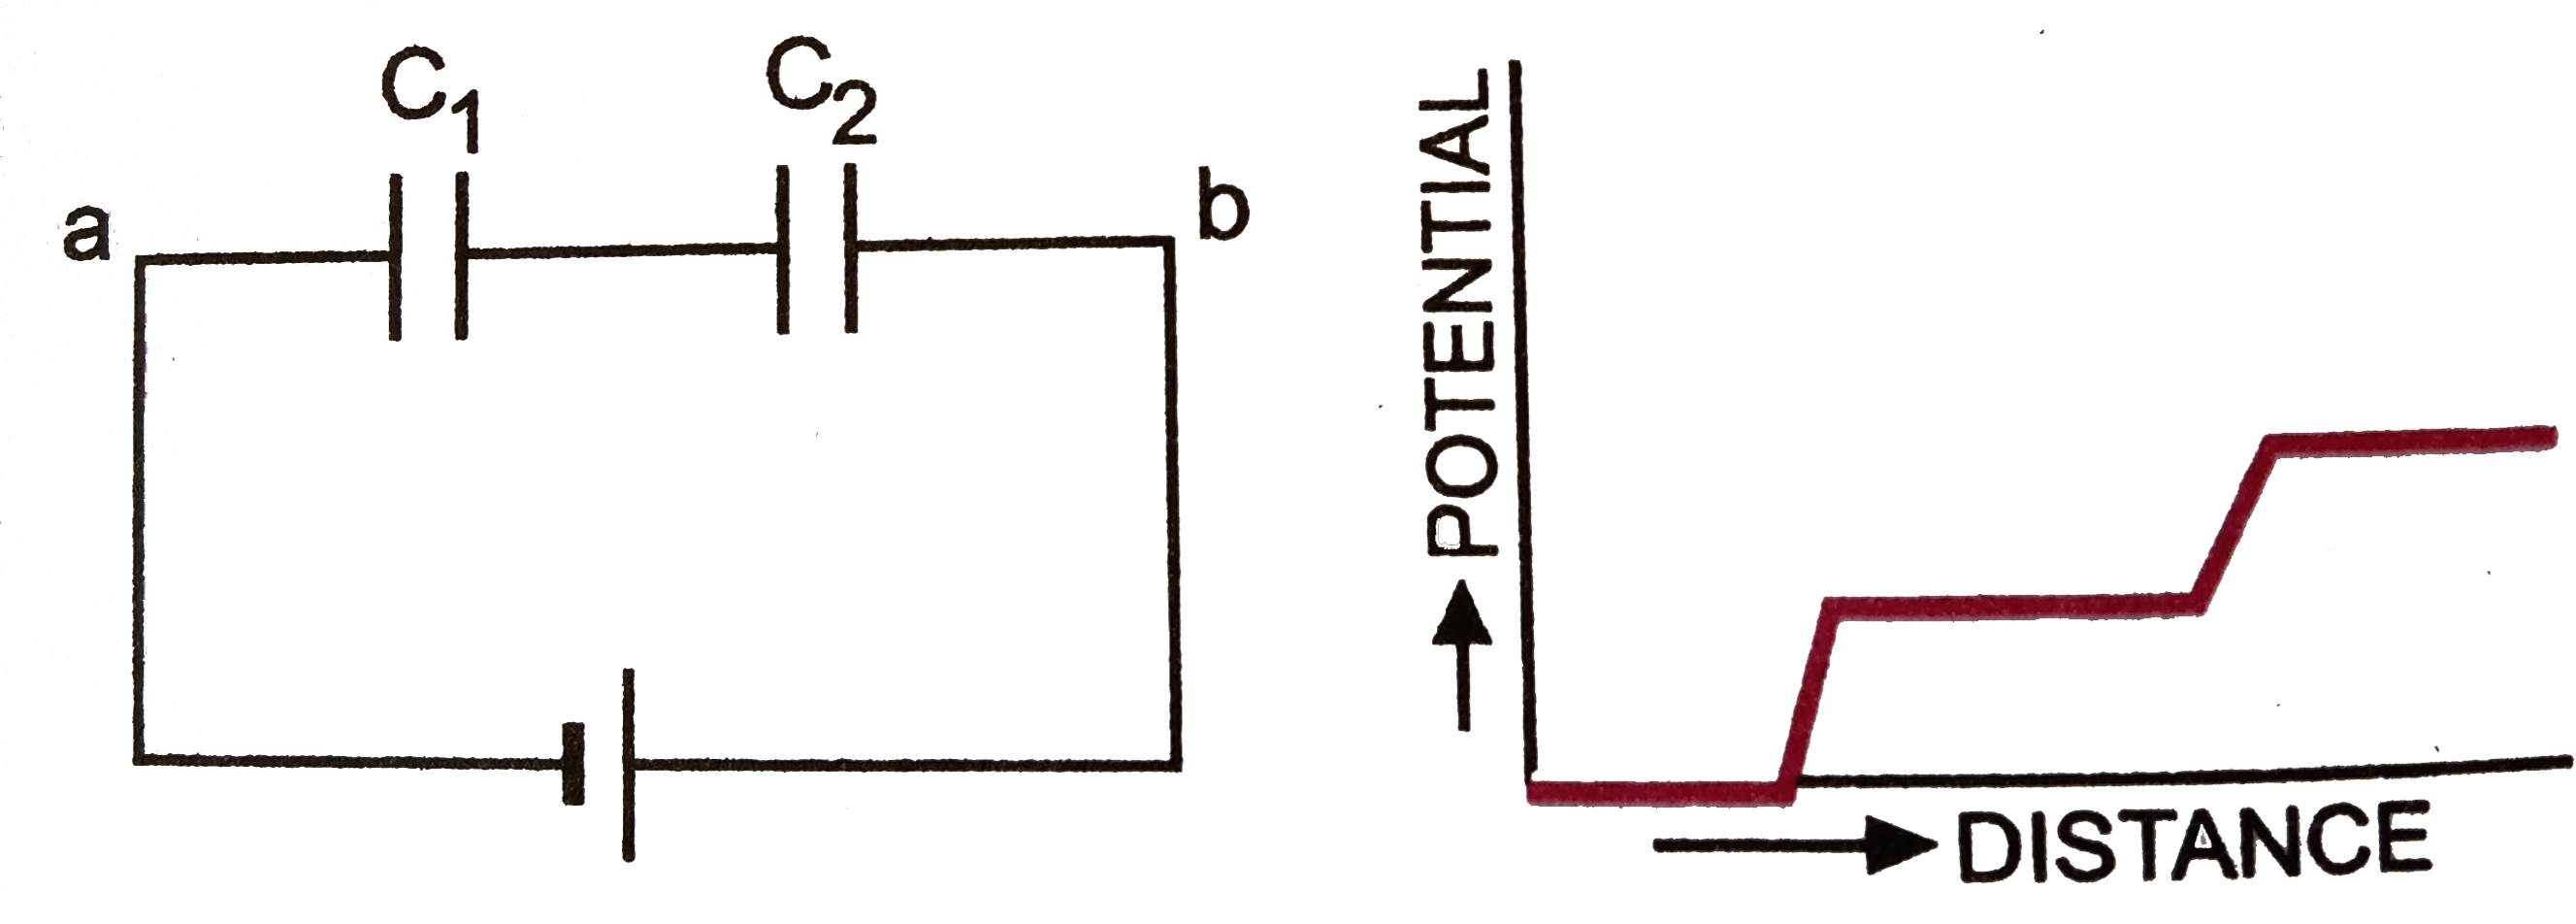
Figure shows two capacitors connected in series and joined to a battery . Draw the graph showing the variation in potential as one moves form left to ring on the branch containing the capacitors. Take C1>C2

Let V1 and V2 be potential drops across the capacitors C1 and C2 respectively.
Then by potential division rule , V1=V=C2C1+C2=(VC1+C2)C2
V2=VC1C1+C2=(VC1+C2)C1

As C1>C2, So V1<V2. Also there is no potential drop along the connecting wires, becuase no current flows through the wires in steady state. So the total available potential drop occurs across the plates of C1 and C2 only .
Topper's Solved these Questions
- ELECTROSTATIC POTENTIAL AND CAPACITANCEBOOK - NARAYNACHAPTER - ELECTROSTATIC POTENTIAL AND CAPACITANCEEXERCISE - Evaluate yourself-1
5 Videos
- ELECTROSTATIC POTENTIAL AND CAPACITANCEBOOK - NARAYNACHAPTER - ELECTROSTATIC POTENTIAL AND CAPACITANCEEXERCISE - Evaluate yourself-2
8 Videos
- ELECTROMAGNETIC WAVES BOOK - NARAYNACHAPTER - ELECTROMAGNETIC WAVES EXERCISE - EXERCISE -4
15 Videos
- ELECTROSTATICS AND GAUSS LAWBOOK - NARAYNACHAPTER - ELECTROSTATICS AND GAUSS LAWEXERCISE - Intergers type question
11 Videos
Similar Questions
Figure show two capacitors connected in series and joind to a bettery. The graph shows the variation in potential as one movies from left to right on the branch containing the capacitors.

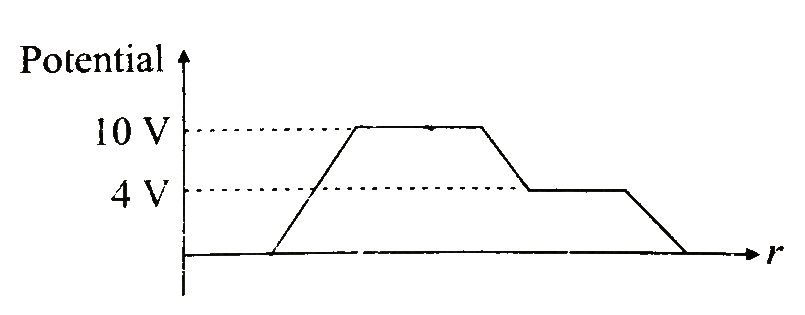
View SolutionFigure shows two capacitors C1andC2 connected with 10 V battery and terminal A and B are earthed. The graphs shows the variation of potential as one moves from left to right. Then the ratio C1/C2 is
View Solution
Knowledge Check
Figure show two capacitors connected in series and joind to a bettery. The graph shows the variation in potential as one movies from left to right on the branch containing the capacitors.
 AC1>CBC1=C2CC1<C2DThe information is not sufficient to decide the ralation between Q+ and Q.
Consider the situation as shown in figure. The variation of potential as one moves from left to right along branch containing the capacitors, if
 AC1=C2BC1<C2CC1>C2Dnone
Figure shows two capacitors C1andC2 connected with 10 V battery and terminal A and B are earthed. The graphs shows the variation of potential as one moves from left to right. Then the ratio C1/C2 is
 A5/2B2/3C2/5D4/3
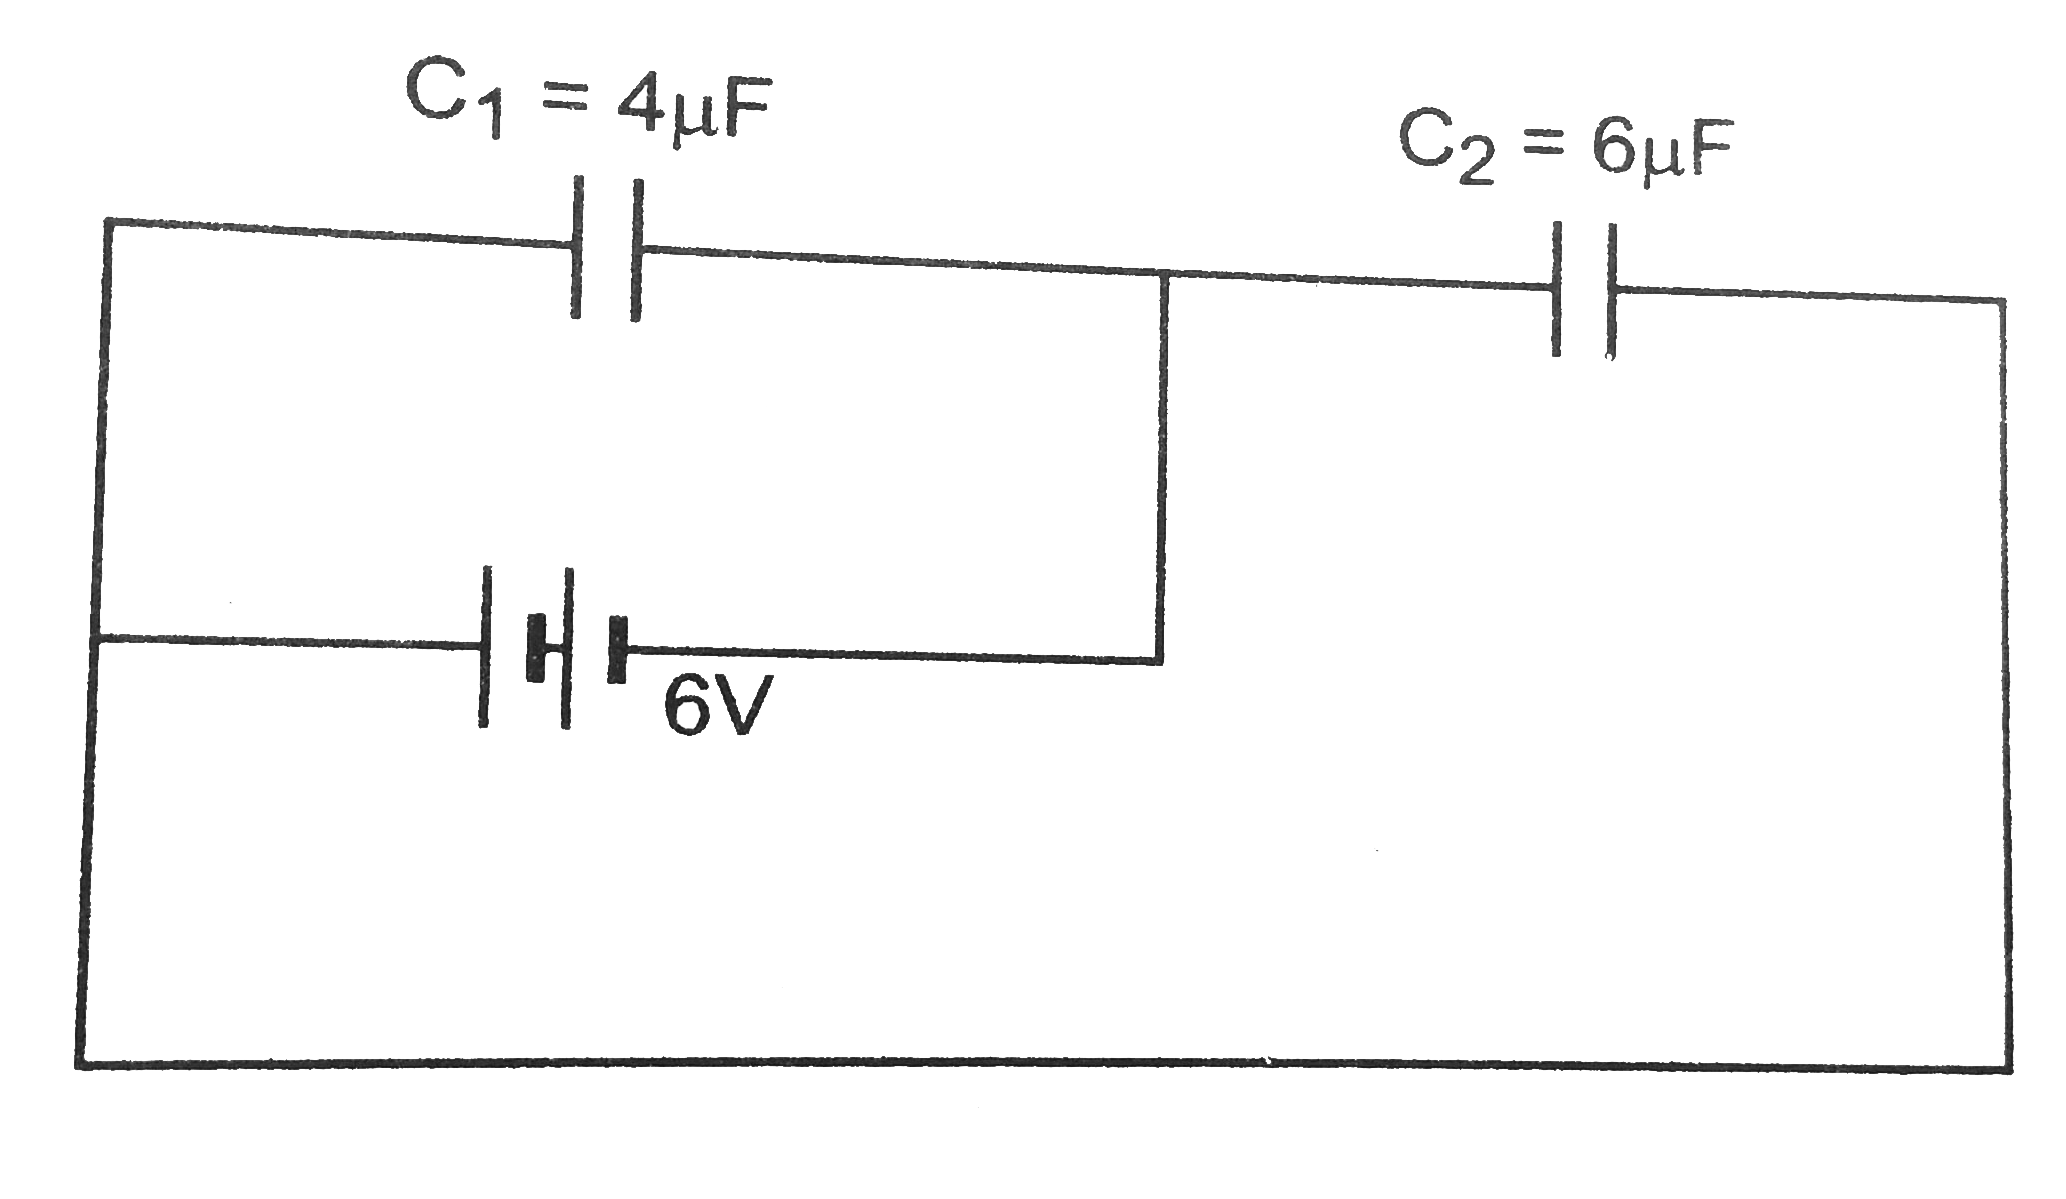
Two capacitors C1 and C2 are connected to a battery of 6V as shown in Fig. Find the charge on each capacitor.
View Solution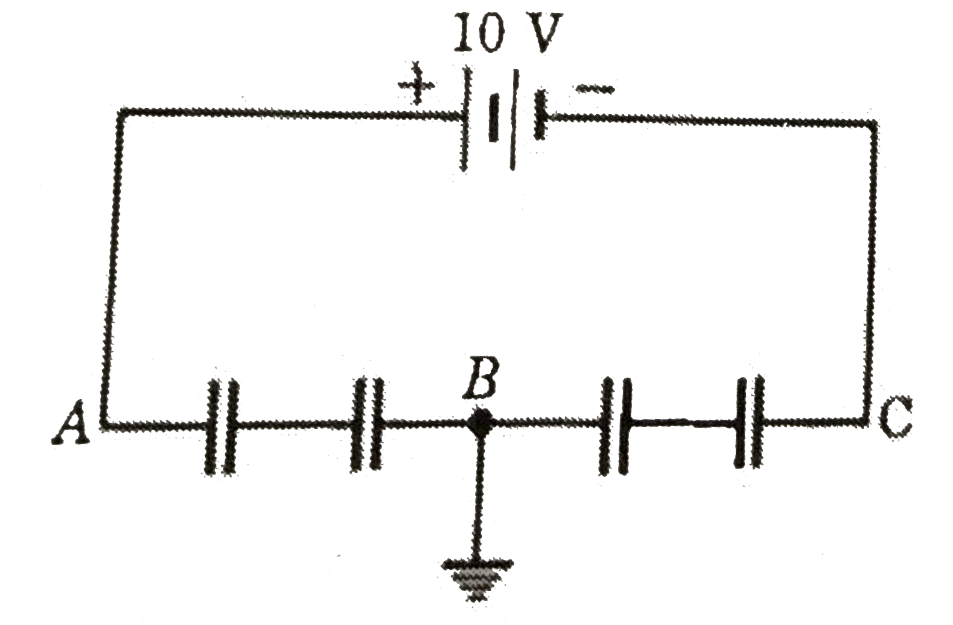
Four capacitors of equal cpacitances are connected in series with a battery of 10 V, as shown in figure. The middle point B is connected to the earth. What will be the potentials of the points A and C?
View SolutionThe figure shows a arrangement of capacitors and a battery.

If the potential of C is zero, then
View SolutionTwo condensers of capacity C1 and C2, are connected in series to a battery as shown in Fig. The adjoining graph shows the variraton of potential in going from a to b. Thereofore.
View SolutionTwo capacitors with CA greater than CB and are connected in series with a battery. Which of the following is true?
View Solution
