Match the following
Column I Column II(A)Work (p)Slope of (momentum- time)P-t graph(B) Power (q) Slope of W - t graph (C)Force(r) Area under F-s graph(D)Impulse (iv) Area under F- t graph
A -q, B - p, C -s, D - r
A-r, B-q,C-p, D-s
A-s, B-q,C-p, D-r
A-q, B-r,C-s, D-p
The correct Answer is:(2)
To solve the matching question, we need to analyze each term in Column I and find its corresponding term in Column II based on the definitions and relationships in physics.
1. Work (A):
- Work done is defined as the integral of force over displacement. Mathematically, it can be expressed as:
W=∫F⋅ds
- The work done by a force can also be represented as the area under the Force vs. Displacement graph. Therefore, we can match:
(A) Work →(r) Area under F-s graph
2. Power (B):
- Power is defined as the rate of doing work. It can be expressed as:
P=dWdt
- The slope of the Work vs. Time graph gives us power. Hence, we can match:
(B) Power →(q) Slope of W-t graph
3. Force (C):
- Force is defined as the rate of change of momentum. Mathematically, it can be expressed as:
F=dpdt
- The slope of the Momentum vs. Time graph gives us force. Therefore, we can match:
(C) Force →(p) Slope of (momentum-time) P-t graph
4. Impulse (D):
- Impulse is defined as the change in momentum, which can be expressed as:
Impulse=Δp=∫Fdt
- The area under the Force vs. Time graph gives us impulse. Thus, we can match:
(D) Impulse →(s) Area under F-t graph
Final Matches:
- (A) Work → (r) Area under F-s graph
- (B) Power → (q) Slope of W-t graph
- (C) Force → (p) Slope of (momentum-time) P-t graph
- (D) Impulse → (s) Area under F-t graph
Summary of Matches:
- A → r
- B → q
- C → p
- D → s
- Work done is defined as the integral of force over displacement. Mathematically, it can be expressed as:
W=∫F⋅ds
- The work done by a force can also be represented as the area under the Force vs. Displacement graph. Therefore, we can match:
(A) Work →(r) Area under F-s graph
- Power is defined as the rate of doing work. It can be expressed as:
P=dWdt
- The slope of the Work vs. Time graph gives us power. Hence, we can match:
(B) Power →(q) Slope of W-t graph
- Force is defined as the rate of change of momentum. Mathematically, it can be expressed as:
F=dpdt
- The slope of the Momentum vs. Time graph gives us force. Therefore, we can match:
(C) Force →(p) Slope of (momentum-time) P-t graph
- Impulse is defined as the change in momentum, which can be expressed as:
Impulse=Δp=∫Fdt
- The area under the Force vs. Time graph gives us impulse. Thus, we can match:
(D) Impulse →(s) Area under F-t graph
- (A) Work → (r) Area under F-s graph
- (B) Power → (q) Slope of W-t graph
- (C) Force → (p) Slope of (momentum-time) P-t graph
- (D) Impulse → (s) Area under F-t graph
- A → r
- B → q
- C → p
- D → s
Topper's Solved these Questions
- BOOK - NARAYNACHAPTER - WORK , ENERGY & POWER EXERCISE - EXERCISE -III54videos
WORK , ENERGY & POWER
- BOOK - NARAYNACHAPTER - WORK , ENERGY & POWER EXERCISE - EXERCISE IV43videos
WORK , ENERGY & POWER
- BOOK - NARAYNACHAPTER - WORK , ENERGY & POWER EXERCISE - EXERCISE -II (C.W)75videos
WORK , ENERGY & POWER
- BOOK - NARAYNACHAPTER - WAVESEXERCISE - Exercise-IV56videos
WAVES
- BOOK - NARAYNACHAPTER - WORK POWER AND ENERGYEXERCISE - Level-VI (Integer)12videos
WORK POWER AND ENERGY
Similar Questions
Match the following
Column-IColumn-II(A)unit of length in F.P.S(p)m(B)unit of mass in C.G.S(q)foot(C)unit of time(r)metre(s)gm(t)secondView SolutionMatch the following
Column-IColumn-II(A)Derived unit(p)Height(B)Fundamental unit(q)Thickness(C)Derived quantity(r)Area(D)Fundamental quantity(s)Newton(t)KilogramView Solution
Knowledge Check
- Question 1 - Select One
Match the columns
Column IColumn IIaCartilagepNeurilemmabBoneqSarcolemmacMuscle FibrerPerichondriumdNeuronsPeriosteumtPericardiumAa-r , b-s, c-q, d-pBa-r , b-t , c-q, d-pCa-r, b-s, c-q, d-tDa-r,b-s , c-p , d-q - Question 2 - Select One
For a particle executing SHM along a straight line (displacement is measured from mean position).
Column - IColumn - II(a) velocity-time graph will be(p) straight line(b) acceleration-velocity graph may be(q) circle(c) acceleration-displacement graph will be(r) ellipse(d) acceleration-time graph will be(s) sinusoidal curveAa - s, b - q, r, c - p, d - sBa - p, b - s, r, c - s, d - pCa - q, b - s, r, c - p, d - sDa - r, b - q, r, c - q, d - s - Question 3 - Select One
Match the Column - I with Column - II
Column-IColumn-II(a) P-wave(i) Depolarization of ventricles(b) QRS complex(ii) Repolarization of ventricles(c) T-Wave(iii) Coronary ischemia(d) Reduction in the size of T-wave(iv) Depolarization of atria(v) Repolarization of atria
Select the correct option:A(a)(b)(c)(d)(1)(ii)(iii)(v)(iv)B(a)(b)(c)(d)(2)(iv)(i)(ii)(iii)C(a)(b)(c)(d)(3)(iv)(i)(ii)(v)D(a)(b)(c)(d)(4)(ii)(i)(v)(iii)
Match the following column:
Column-IColumn-II(A) Plot of log P vs log V at const T(p) Linear with ve slope(B) Plot of log V vs log T at const P(q) Linear with negative slope(C) Plot of V ∝T at const T(r) Parabola(D) Plot of volume vs pressure at const temp(s) Linear passing through origin(t) Rectangular hyperbolaView SolutionFor the velocity -time graph shown in figure, in a time interval from t=0 to t=6s, match the following:

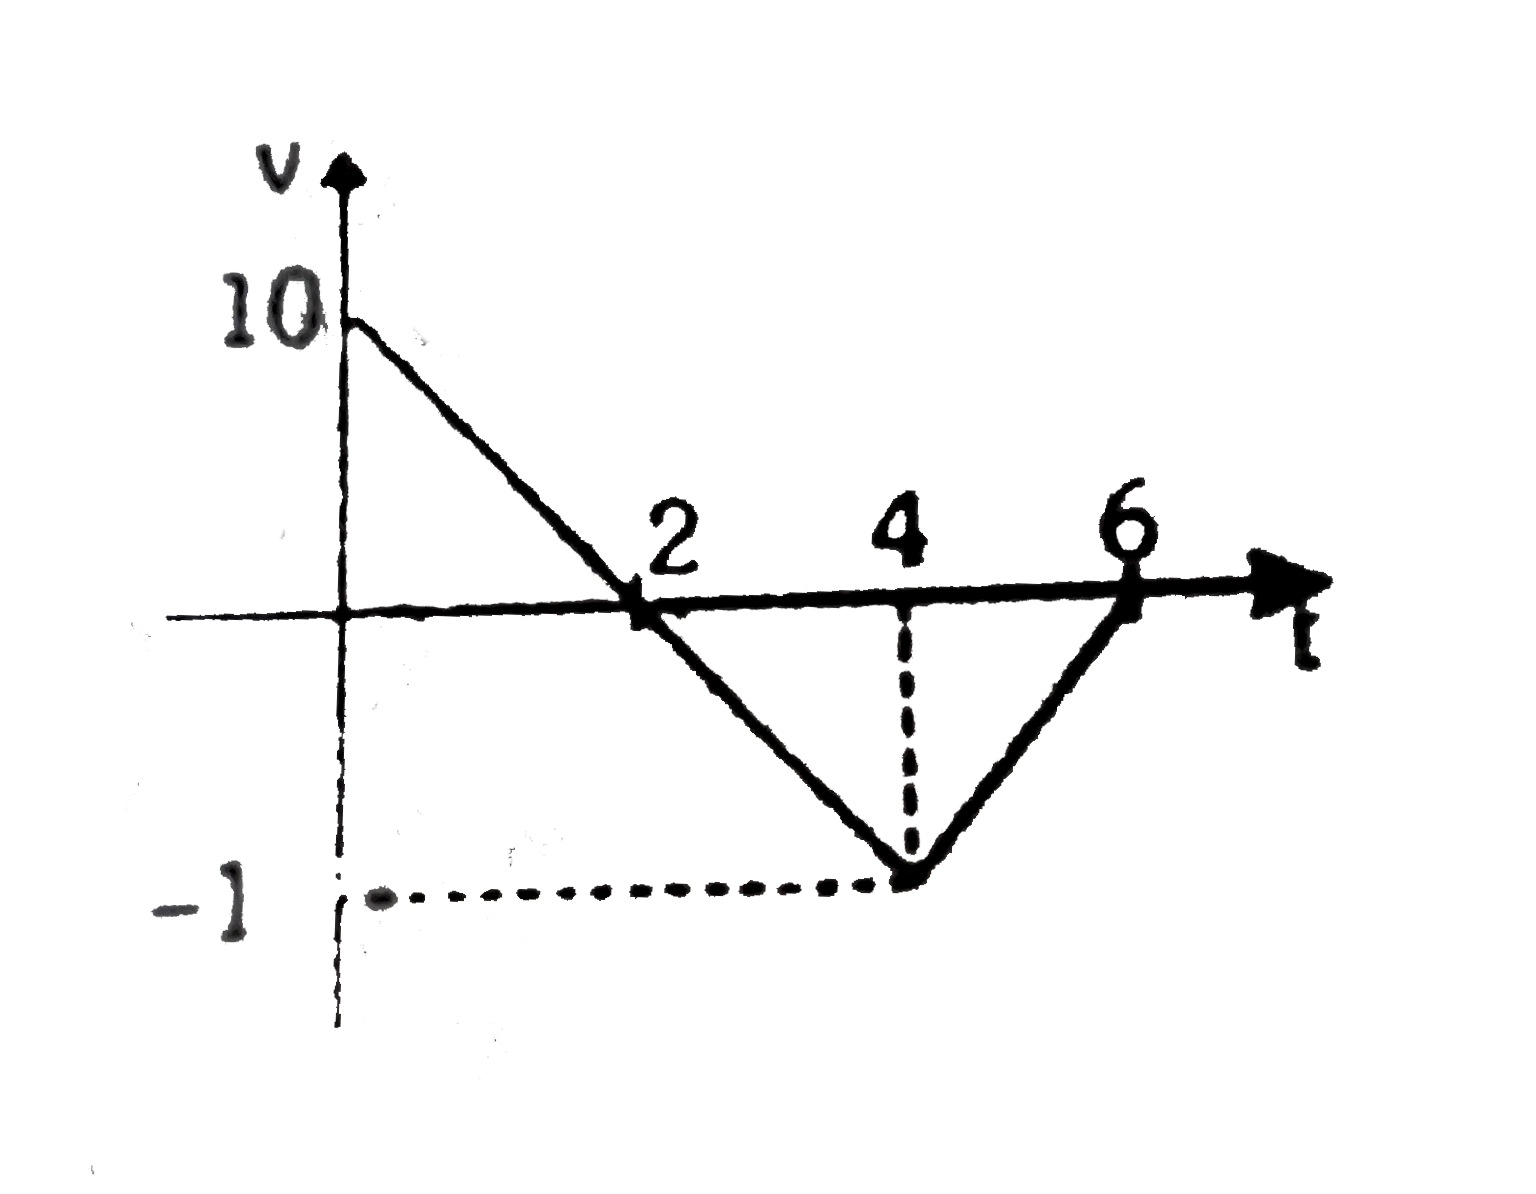
Column IColumn II(A)Change in velocity(p)−5/3SIunit(B)Average acceleration(q)−20SIunit(C)Total displacement(r)−10SIunit(D)Acceleration ay t=3s(s)−5SIunitView Solution[" The acceleration of a "],[" moving body can be found "],[" from "],[" (A) Area under velocity - time graph "],[" (B) Area under distance - time graph "],[" (C) Slope of the velocity - time graph "],[" (D) Slope of distance - time graph "]
View SolutionMatch the columns
Column I Column IIaHarversian CanalpKidneybDendritesqCartilagecSarcolemmarMuscledChondrocytes sNerve cells−−tBoneView SolutionMatch the columns
Column IColumn IIaErythrocytespBonebChondrocytesqNeuroncOsteocytesrCartilagedSchwann cellssBlood−−tAdipose TissueView Solution

