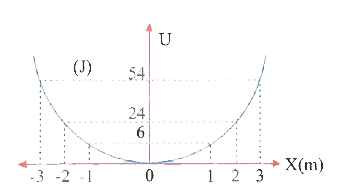
Figure given below shows the variation of potential energy function U(x), corresponding to one dimensional force field. The point on the graph representing the position of most stable equilibrium is :
(##NAR_NEET_PHY_XI_P2_C06_E09_112_Q01.png" width="80%">
A
B
C
D
The correct Answer is:
Conceptual
Topper's Solved these Questions
- WORK , ENERGY & POWER Book:NARAYNAChapter:WORK , ENERGY & POWER Exercise:EXERCISE -III
Explore 54 Videos
- WORK , ENERGY & POWER Book:NARAYNAChapter:WORK , ENERGY & POWER Exercise:EXERCISE IV
Explore 43 Videos
- WORK , ENERGY & POWER Book:NARAYNAChapter:WORK , ENERGY & POWER Exercise:EXERCISE -II (C.W)
Explore 75 Videos
- WAVESBook:NARAYNAChapter:WAVESExercise:Exercise-IV
Explore 56 Videos
- WORK POWER AND ENERGYBook:NARAYNAChapter:WORK POWER AND ENERGYExercise:Level-VI (Integer)
Explore 12 Videos
Similar Questions
The value of angle r in figure below is
(##AAK_MCP_36_NEET_PHY_E36_017_Q01.png" width="80%">
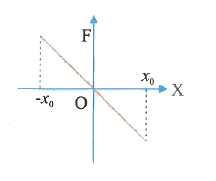
View SolutionFigure given below shows the plot of the conservative force F, in a unidimensional field. The plot representing the function corresponding to the potential energy (U) in the field is :

View Solution
Knowledge Check
Figure given below shows the variation of potential energy function U(x), corresponding to a particle lying in a one dimensional force field. The force acting on the particle at x = 2 m is:
 A−12NB−24NC−16ND−8N
The output across the load resistance R is
(##AAK_P7_NEET_PHY_SP7_C29_E04_031_Q01.png" width="80%">AHalf wave rectifiedBFull wave rectifiedCQuarter rectifiedDacFour masses are fixed on a mass less rod as shown in Fig . The moment of inertia about the axis P is about :
(##NAR_NEET_PHY_XI_P2_C05_E06_024_Q01.png" width="80%">A2 kg m2B1 kg m2C0.5 kg m2D0.3 kg m2
Three rings each of mass M and radius R are arranged as shown in the figure . The moment of inertia of the system about AB is
(NAR_NEET_PHY_XI_P2_C07_E11_036_Q01.png" width="80%">
View SolutionThe potential difference between point A and B adjoining figure is<br> (##VMC_NEET_XII_PHY_MOD_04_C13_E05_001_Q01.png" width="80%">
View SolutionIn the figure shown all the surfaces are frictionless, and mass of the block 'm' is 1 kg. The block and wedge are held initially at rest. Now wedge is given a horizontal acceleration of 5ms2 by applying a force on the wedge, so that the block does not slip on the wedge. Then work done by the normal force in ground frame on the block in 2 sec is :
(##NAR_NEET_PHY_XI_P2_C06_E09_012_Q01.png" width="80%">
View SolutionPotential difference across AB i.e., VA−VB is
(##AAK_P5_NEET_PHY_SP5_C18_E04_027_Q01.png" width="80%">)
View SolutionThe p.m.f. of a random variable X is
(# TRG_MAT_MCQ_XII_P2_C08_E02_009_Q 01.png" width="80%">
If b= 2a, then
View Solution
