which one of the following graph is not correct for ideal gas ?
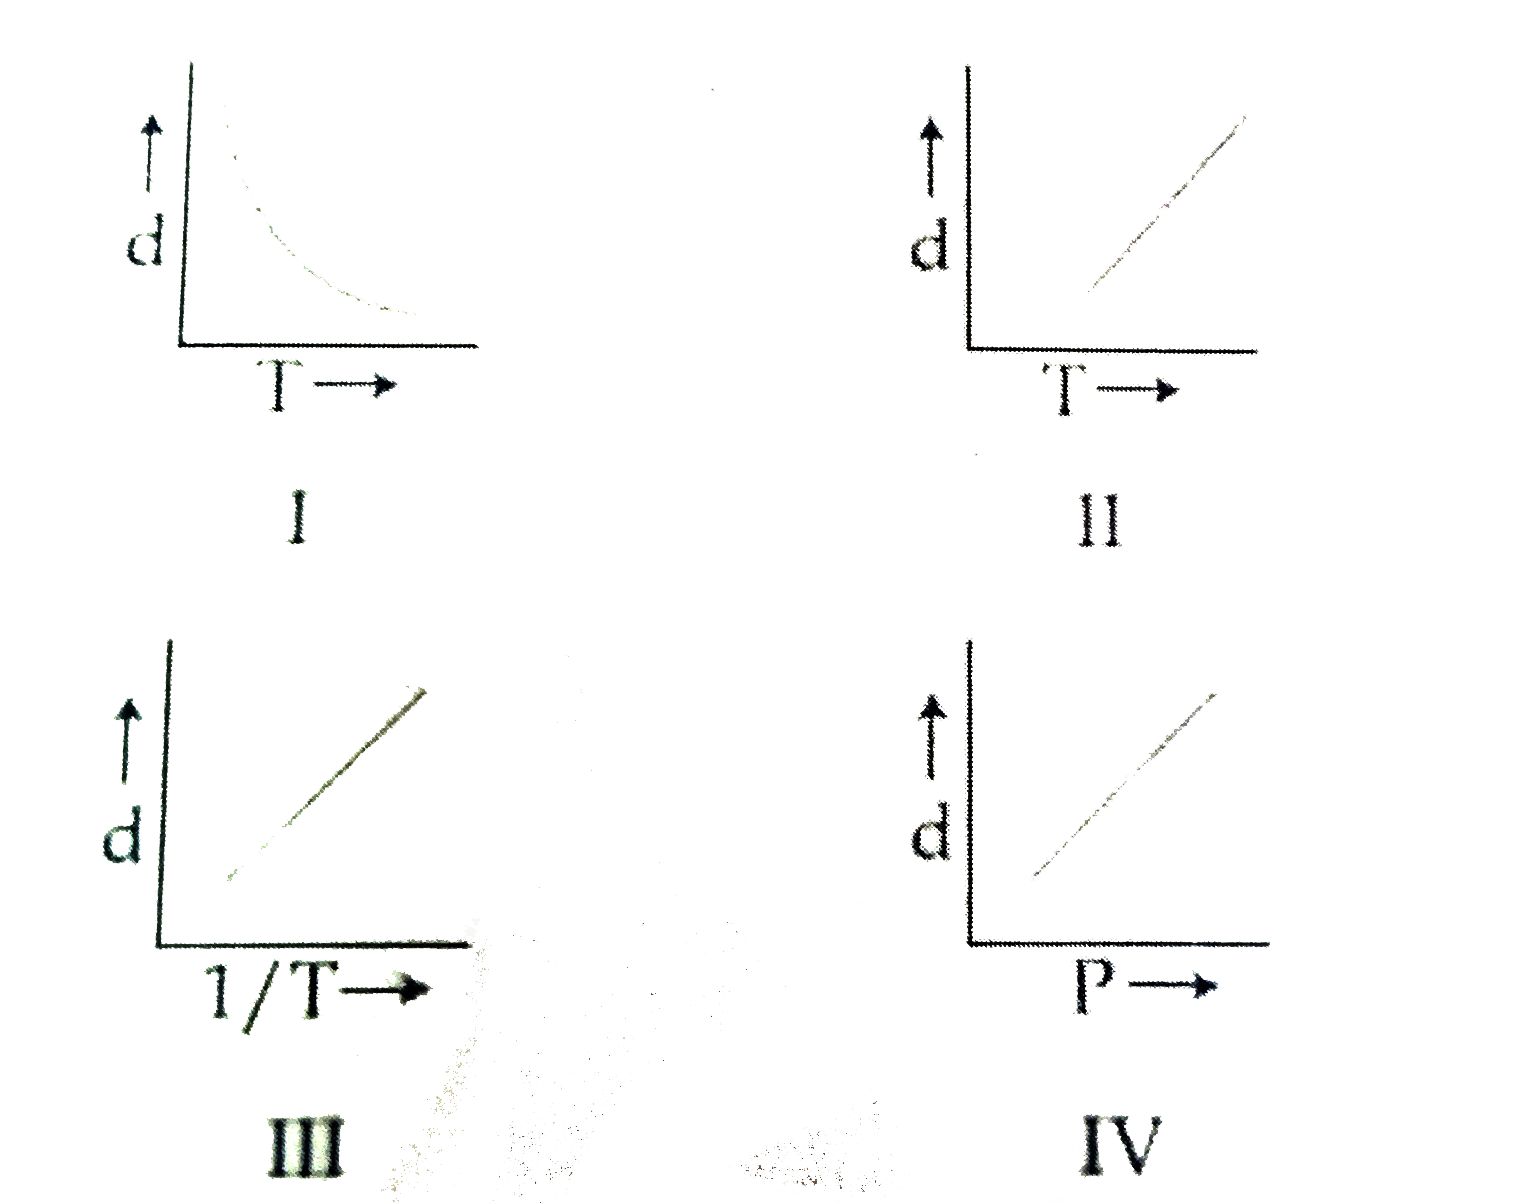
d=density ,P=pressure,T=Temperature
IV
III
I
II
Step by step video & image solution for which one of the following graph is not correct for ideal gas ? d=density ,P=pressure,T=Temperature by Chemistry experts to help you in doubts & scoring excellent marks in Class 12 exams.
Updated on:21/07/2023Topper's Solved these Questions
Similar Questions
Which one of the following is the correct PV vs P plot at constant temperature for an ideal gas ? (P and V stand for pressure and volume of the gas respectively)
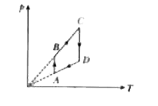
View SolutionPressure temperature (p-1) graph of n moles of an ideal gas is shown in the figure. Among the following four graphs, which are the corresponding pressure volume (p-V) and density pressure (p-p) graphs?
View Solution
Knowledge Check
Which of the following graph is correct reversible adiabatic process for an ideal gas:
A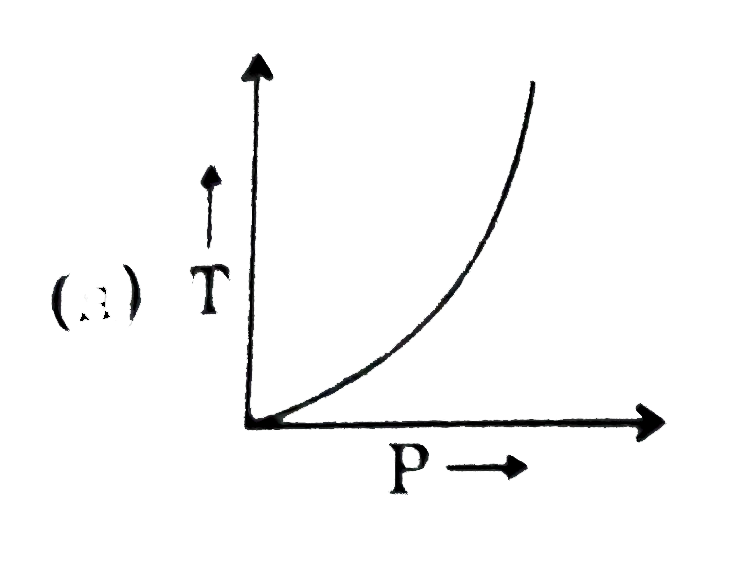 B
B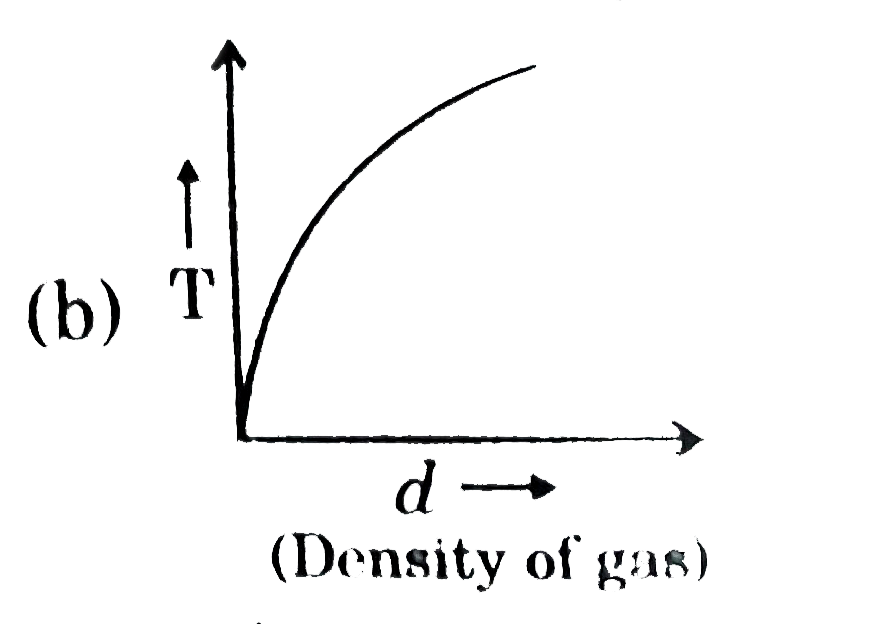 C
C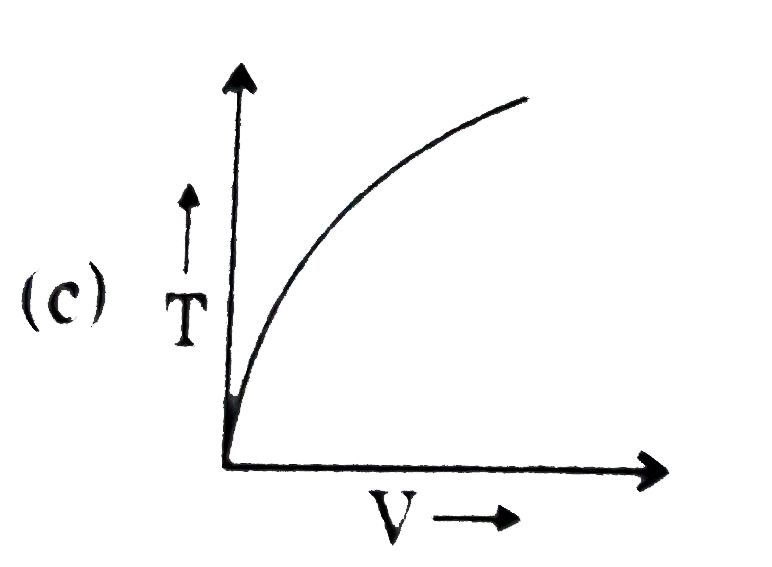 D
D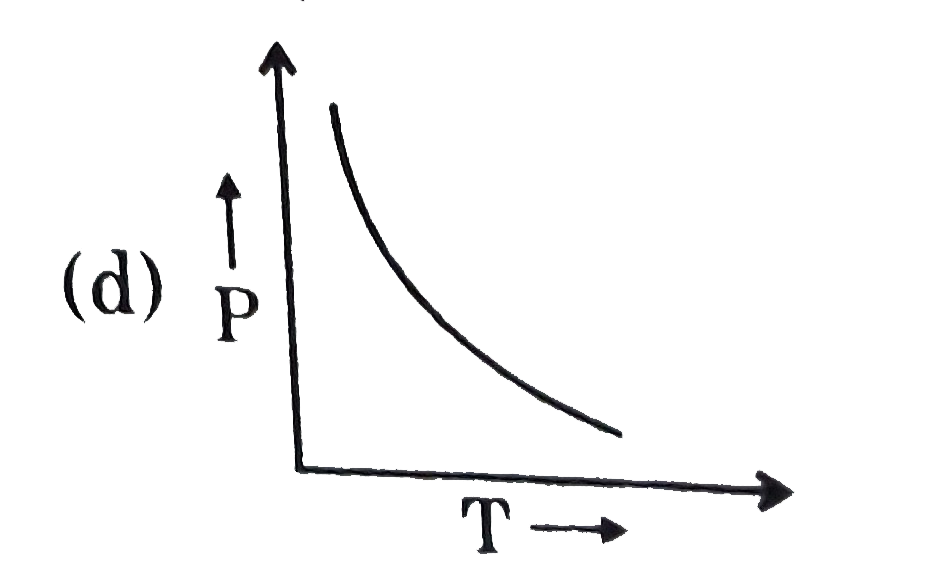
For the given graph which of the following is correct : (n = mole of gas and P = Pressure)
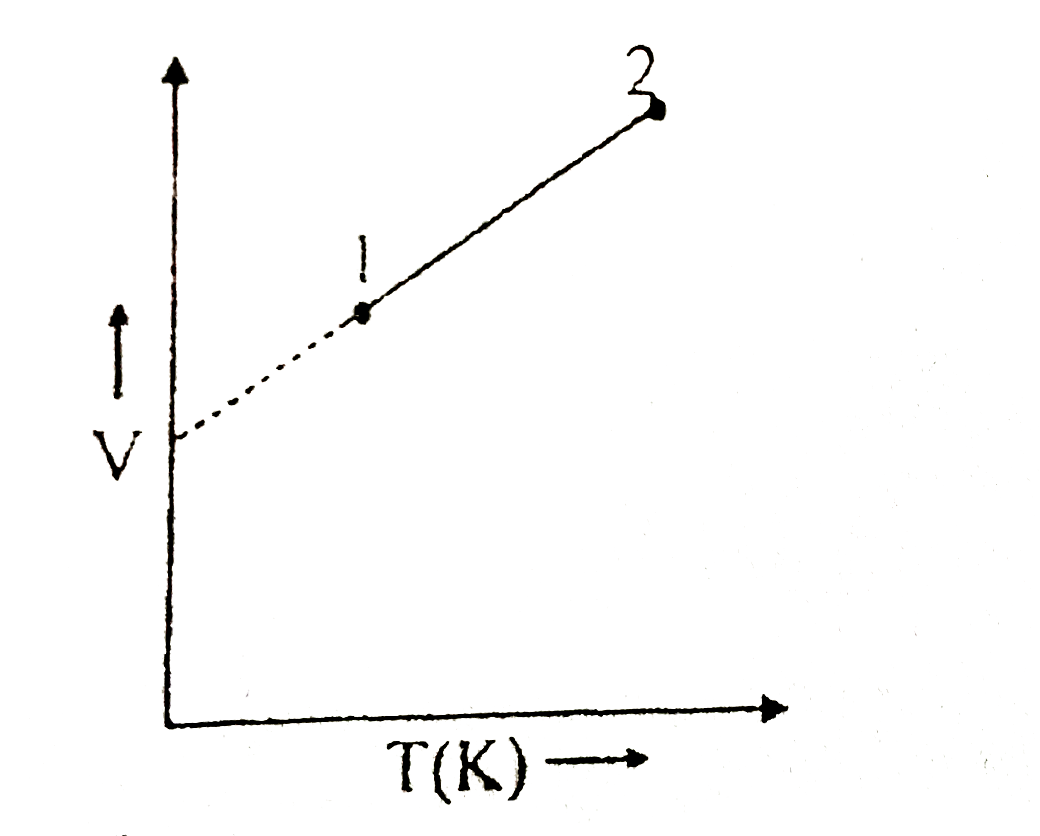 AP2>P1 with n is constantBP2<P1 with n is constantCP2=P1 with n is constantDcan't compare P1 and P2
Which of the following is a correct plot of the volume of fixed amount of ideal gas as a function of temperature (at constant pressure)
A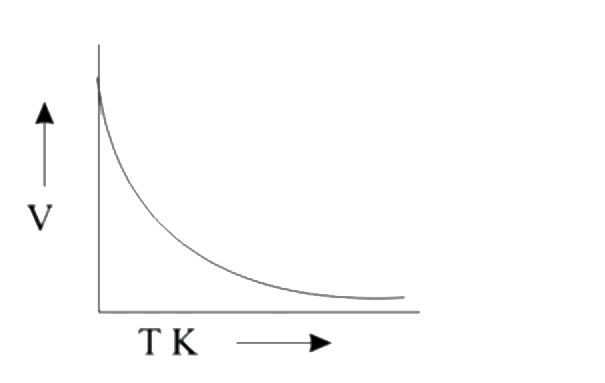 B
B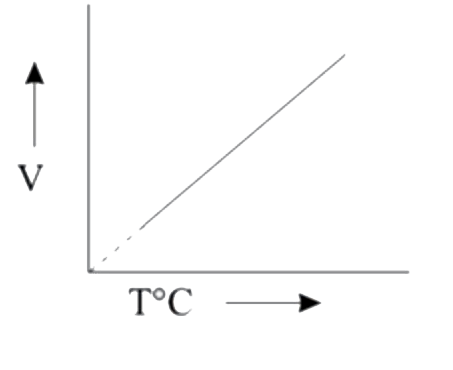 C
C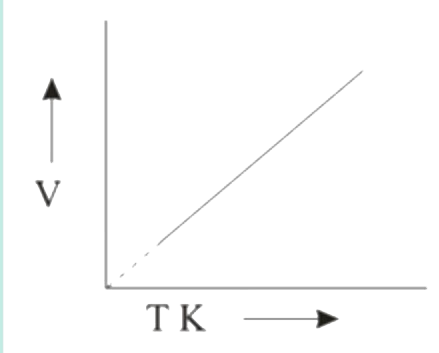 D
D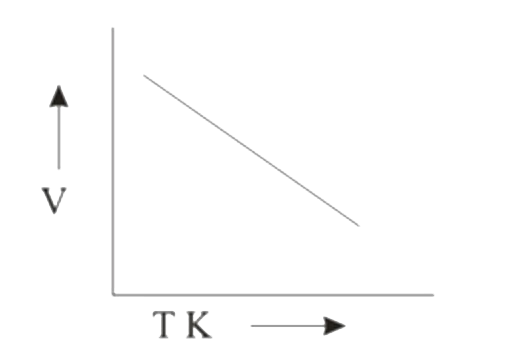
Choose the correct graph between pressure and volume of ideal gas.
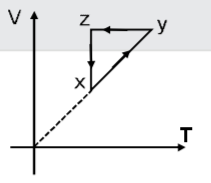
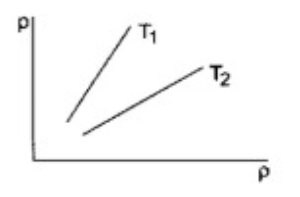
View SolutionShows graphs of pressure vs density for an ideal gas at two temperaturesT1andT2
View SolutionAn inflated rubber ballon contains one mole of an ideal gas , has a pressure P, volume V and temperature T. If the temperature rises to 1.1 T, and the volume isincreased to 1.05 V, the final pressure will be
View SolutionIfcpandcv are the principal specific heats of an ideal gas in cal/gm .∘C,ρ is the density, P is the pressure and T is the temperature of the gas, then Mayer's relation is
View SolutionAn inflated rubber balloon contains one mole of an ideal gas has a pressure p, volume V and temperature T. if the temperature rises to 1.1 T, and the volume is increased to 1.05 V, the final pressure will be
View Solution
