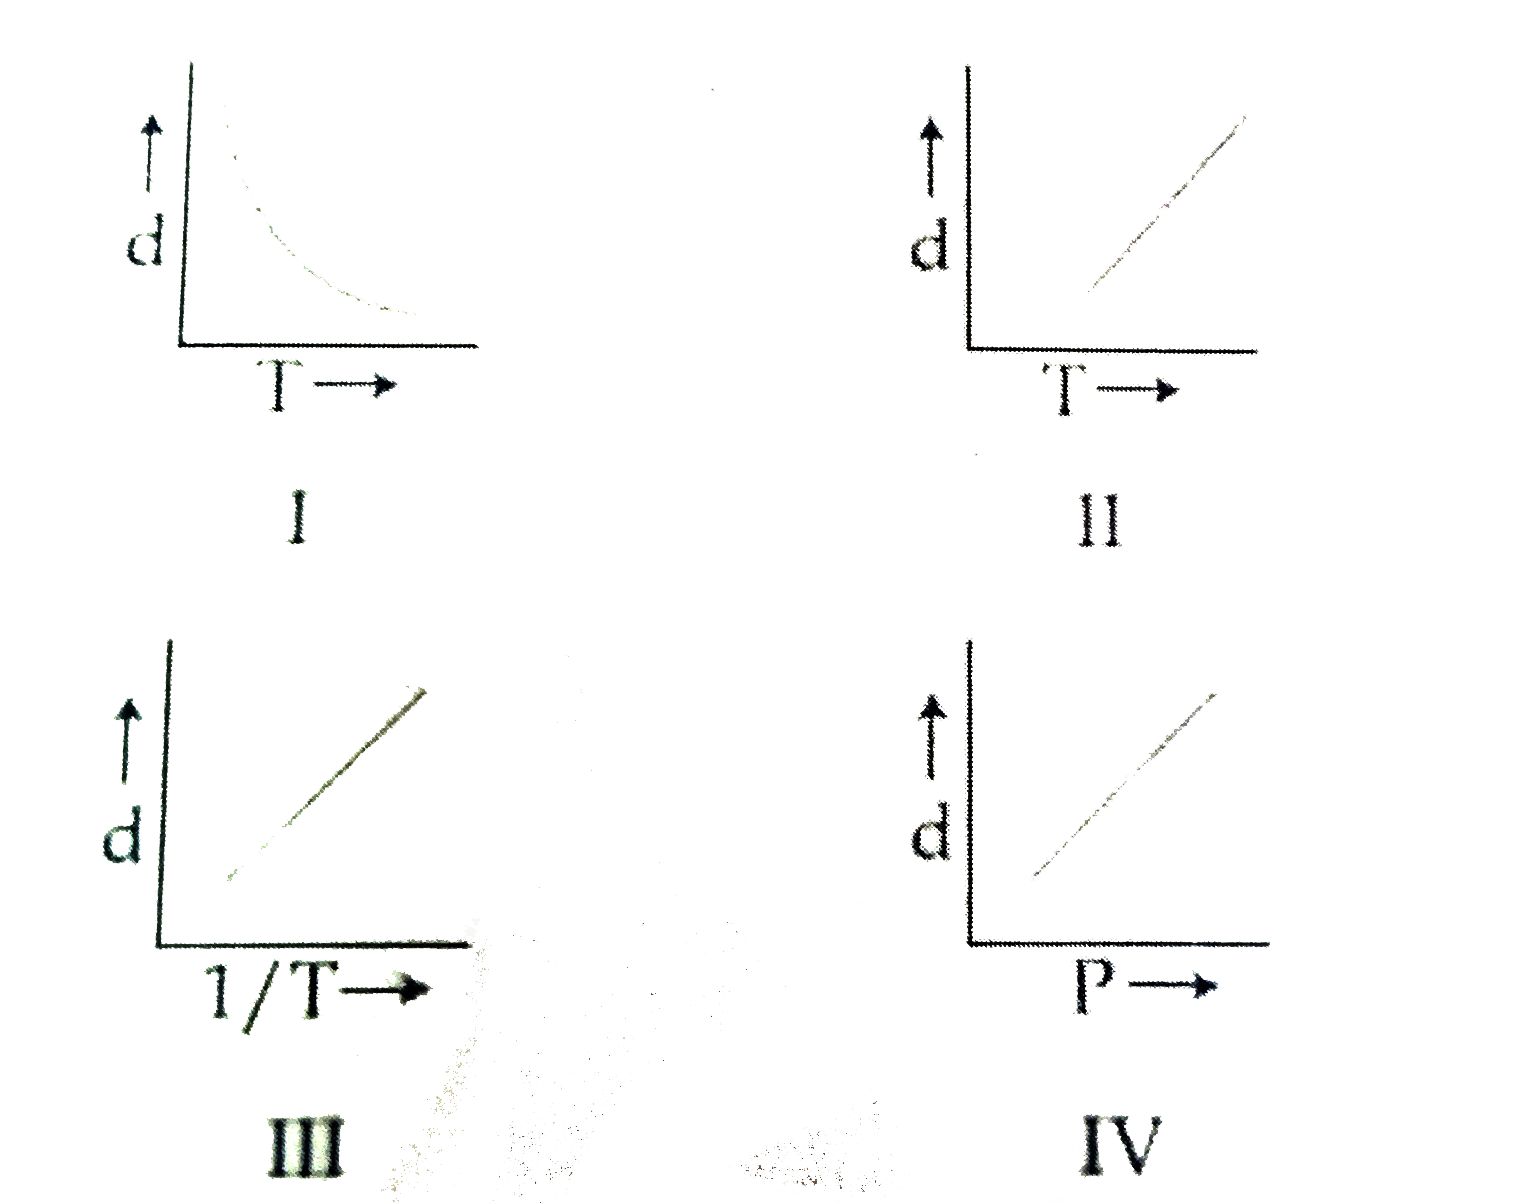
Which one of the following is the correct PV vs P plot at constant temperature for an ideal gas ? (P and V stand for pressure and volume of the gas respectively)
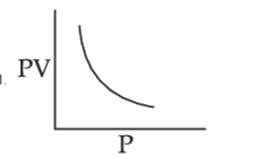
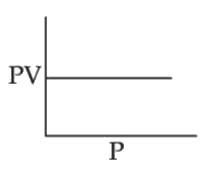
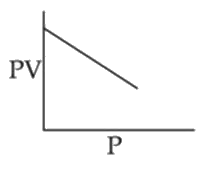
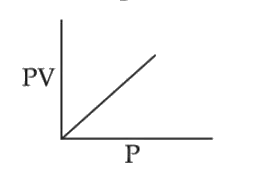
The correct Answer is:D
To solve the question regarding the correct PV vs P plot at constant temperature for an ideal gas, we can follow these steps:
1. Understand the Ideal Gas Law: The ideal gas law is given by the equation:
PV=nRT
where P is the pressure, V is the volume, n is the number of moles, R is the universal gas constant, and T is the temperature.
2. Identify Constants: In this scenario, we are told that the temperature is constant and the amount of gas (number of moles) is also constant. Therefore, n, R, and T are constants.
3. Determine the Implication of Constants: Since n, R, and T are constant, the product PV must also be constant. This means that as the pressure P changes, the volume V must change in such a way that the product PV remains the same.
4. Graphical Representation: When plotting PV against P (or V), we need to recognize that if PV is constant, the graph will reflect a hyperbolic relationship. Specifically, if we plot PV on the y-axis and P on the x-axis, the graph will be a horizontal line at the value of the constant PV.
5. Conclusion: The correct graph for PV vs P at constant temperature for an ideal gas will be a horizontal line, indicating that PV does not change with varying pressure P.
Final Answer:
The correct plot of PV vs P at constant temperature for an ideal gas is a horizontal line.
---
PV=nRT
where P is the pressure, V is the volume, n is the number of moles, R is the universal gas constant, and T is the temperature.
The correct plot of PV vs P at constant temperature for an ideal gas is a horizontal line.
Topper's Solved these Questions
Similar Questions
Knowledge Check
Which of the following is a correct plot of the volume of fixed amount of ideal gas as a function of temperature (at constant pressure)
A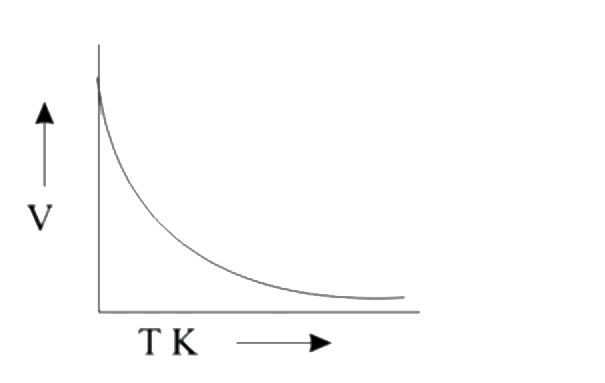 B
B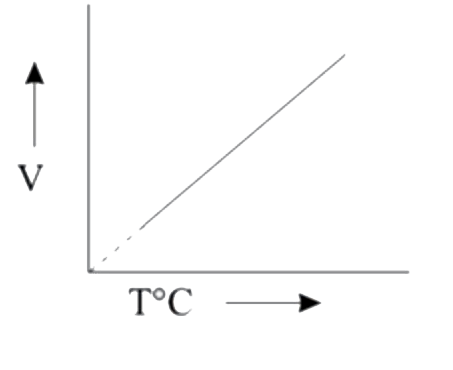 C
C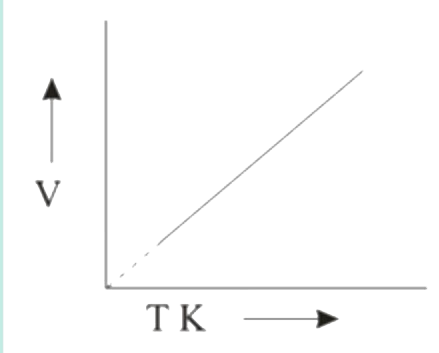 D
D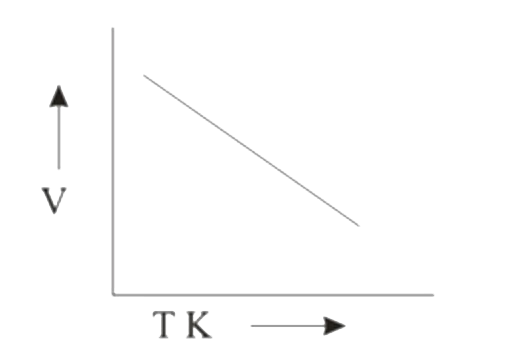
Which one of the following volume (V)- temperature (T) plots represents the behaviour of one mole of an ideal gas at one atmosphere?
A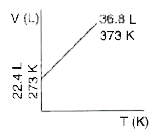 B
B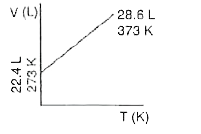 C
C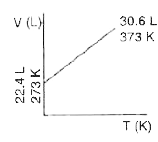 D
D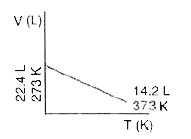
Which of the following volume-temperature (V−I) plots represents the behaviour of 1mole of an ideal gas at the atmospheric pressure?
A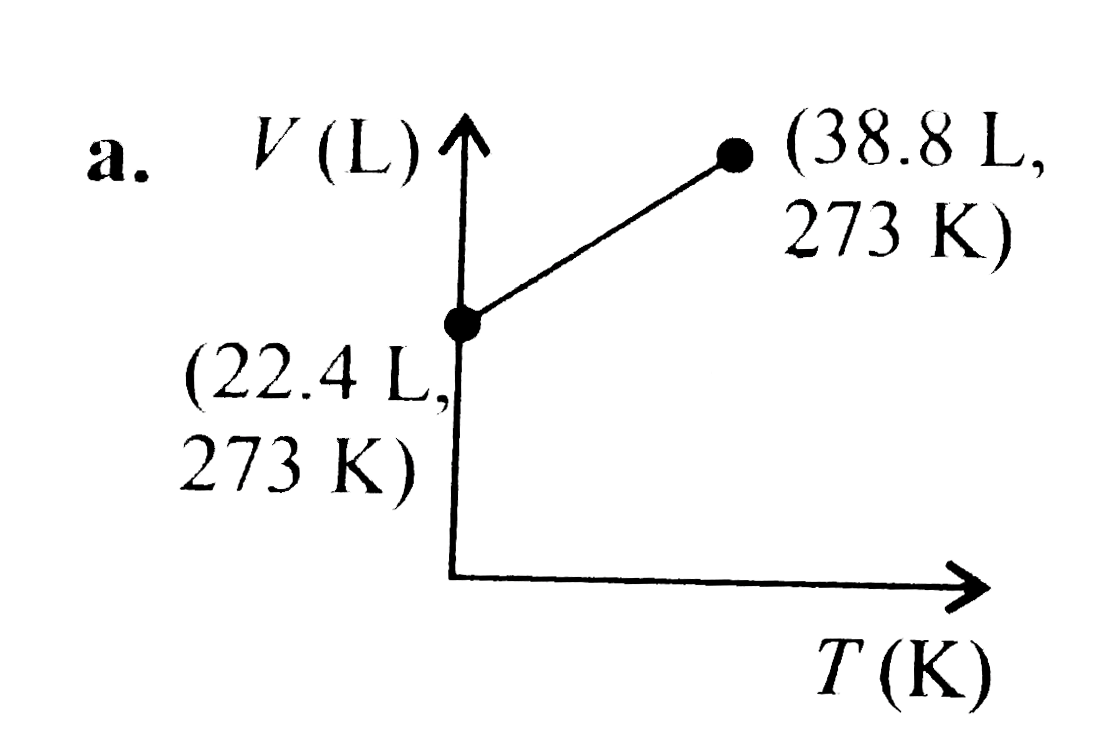 B
B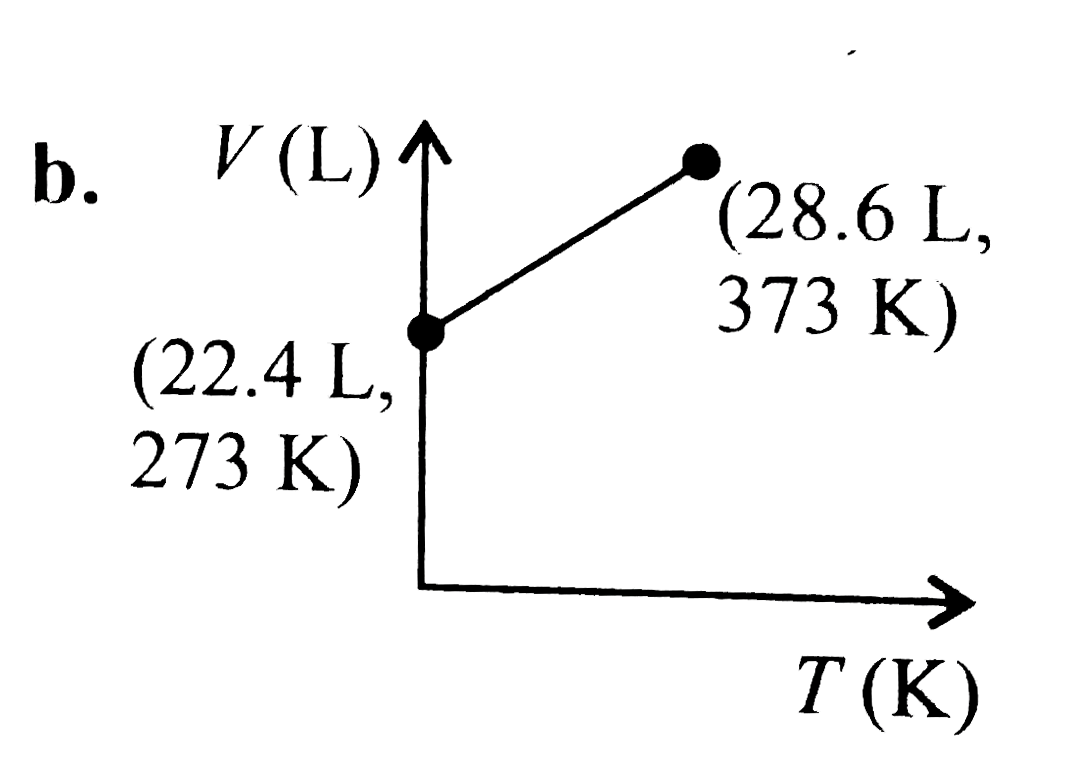 C
C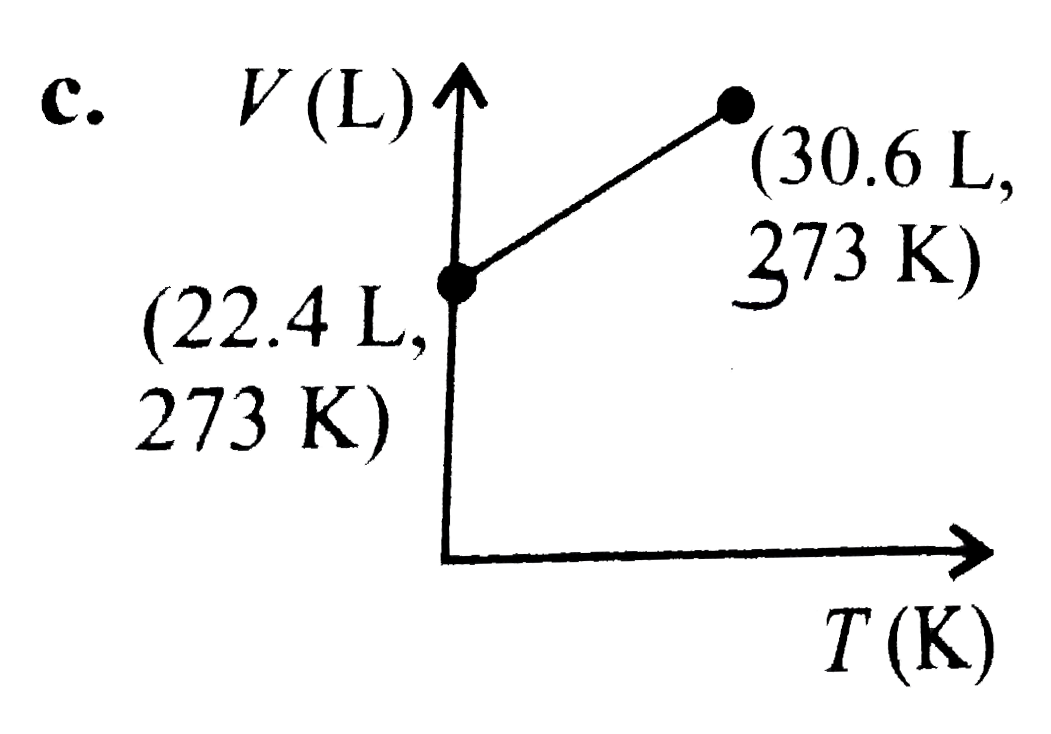 D
D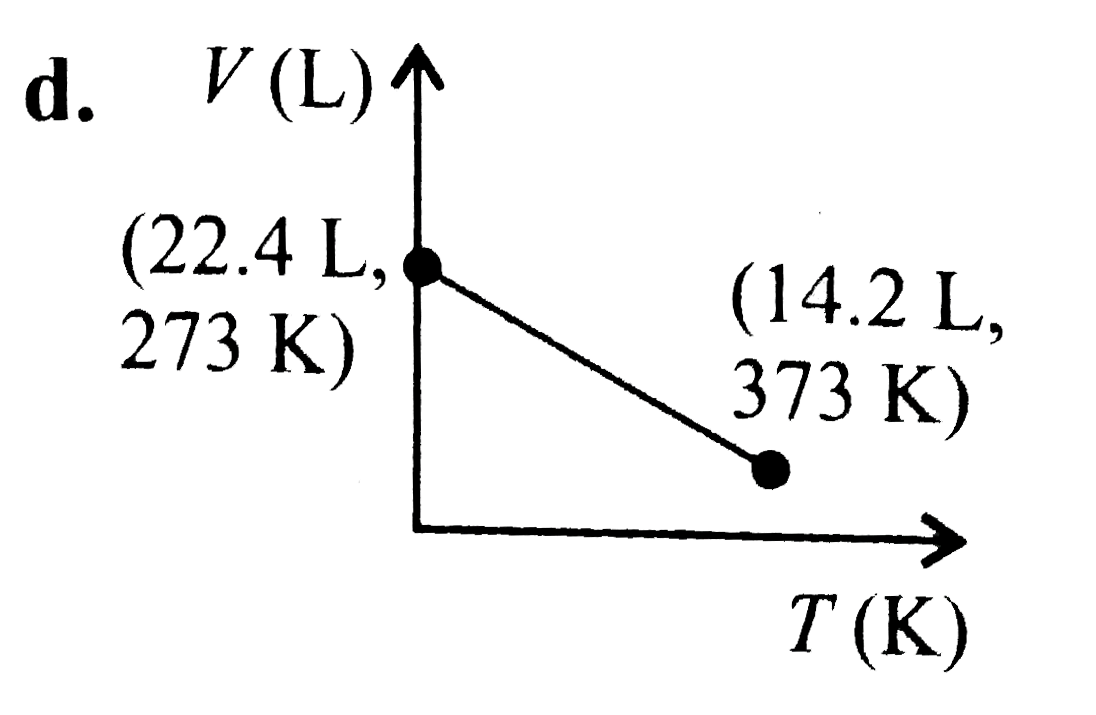
The plot of PV vs P at particular temperature is called isovbar.
View SolutionWhat is the nature of curve by plotting P against PV at constant temperature for a gas ? What is the name assigned to this curve ?
View SolutionAt low pressure, the graph of PVvs1V for a given amount at a constant temperature for a real gas is:
View SolutionWhich of the following volume-temperature (V−I) plots represents the behaviour of 1mole of an ideal gas at the atmospheric pressure?
View SolutionWhich one of the following volume (V)- temperature (T) plots represents the behaviour of one mole of an ideal gas at one atmosphere?
View Solution

