100 mL of 0.1 HCl is taken in a beaker and to it 100 mL of 0.1 M NaOH is added in steps of 2ml and the pH is continuously measured . Which of the following graphs correctly depicts the change in pH
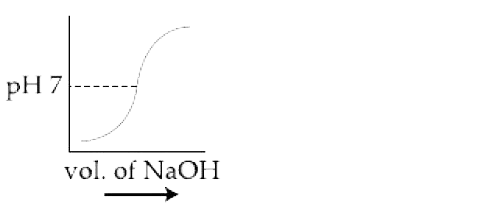
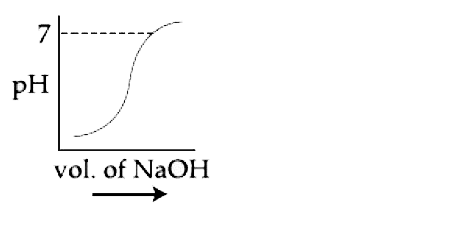
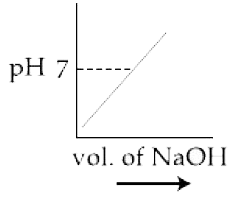
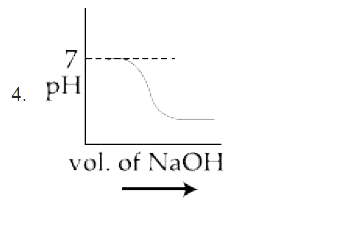
To solve the problem of determining the correct graph that depicts the change in pH when 100 mL of 0.1 M HCl is titrated with 0.1 M NaOH, we can follow these steps:
Step 1: Understand the Initial Conditions
- We start with 100 mL of 0.1 M HCl.
- The initial pH of the HCl solution can be calculated using the formula:
pH=−log(H+)
Since HCl is a strong acid, it dissociates completely:
(H+)=0.1M⟹pH=−log(0.1)=1
Step 2: Adding NaOH
- As we start adding 0.1 M NaOH in increments of 2 mL, we need to analyze how the pH changes.
- The reaction that occurs is:
HCl+NaOH→NaCl+H2O
- Initially, the solution is acidic (pH = 1).
Step 3: Determine the Equivalence Point
- The equivalence point occurs when the moles of HCl equal the moles of NaOH.
- Moles of HCl in 100 mL of 0.1 M solution:
Moles of HCl=0.1M×0.1L=0.01mol
- To reach the equivalence point, we need to add 100 mL of 0.1 M NaOH (which also contains 0.01 mol of NaOH).
Step 4: Analyze pH Changes Before and After the Equivalence Point
- Before reaching the equivalence point (before adding 100 mL of NaOH), the pH will gradually increase from 1 towards 7.
- At the equivalence point (when 100 mL of NaOH has been added), the solution will be neutral (pH = 7).
- After the equivalence point, as more NaOH is added, the pH will rise sharply above 7, moving towards 14.
Step 5: Graph Characteristics
- The graph will start at pH 1 and gradually rise as NaOH is added.
- At the equivalence point (100 mL NaOH added), there will be a steep increase in pH.
- After the equivalence point, the pH will continue to rise but at a slower rate, approaching a plateau as it nears pH 14.
Conclusion
- The correct graph will show a gradual increase in pH from 1 to 7, a sharp increase around the equivalence point, and then a leveling off as it approaches pH 14.
- We start with 100 mL of 0.1 M HCl.
- The initial pH of the HCl solution can be calculated using the formula:
pH=−log(H+)
Since HCl is a strong acid, it dissociates completely:
(H+)=0.1M⟹pH=−log(0.1)=1
- As we start adding 0.1 M NaOH in increments of 2 mL, we need to analyze how the pH changes.
- The reaction that occurs is:
HCl+NaOH→NaCl+H2O
- Initially, the solution is acidic (pH = 1).
- The equivalence point occurs when the moles of HCl equal the moles of NaOH.
- Moles of HCl in 100 mL of 0.1 M solution:
Moles of HCl=0.1M×0.1L=0.01mol
- To reach the equivalence point, we need to add 100 mL of 0.1 M NaOH (which also contains 0.01 mol of NaOH).
- Before reaching the equivalence point (before adding 100 mL of NaOH), the pH will gradually increase from 1 towards 7.
- At the equivalence point (when 100 mL of NaOH has been added), the solution will be neutral (pH = 7).
- After the equivalence point, as more NaOH is added, the pH will rise sharply above 7, moving towards 14.
- The graph will start at pH 1 and gradually rise as NaOH is added.
- At the equivalence point (100 mL NaOH added), there will be a steep increase in pH.
- After the equivalence point, the pH will continue to rise but at a slower rate, approaching a plateau as it nears pH 14.
- The correct graph will show a gradual increase in pH from 1 to 7, a sharp increase around the equivalence point, and then a leveling off as it approaches pH 14.
Topper's Solved these Questions
Similar Questions
Knowledge Check
100mL of 0.2NNaOH is mixed with 100 mL 0.1NHCl and the solution is made 1L. The pH of the solution is :
A4B8C10D12100 mL of 0.04 N HCl aqueous solution is mixed with 100 mL of 0.02 N NaOH solution. The pH of the resulting solution is :
A1B1.7C2D2.33100 mL of 0.04 N HCl aqueous solution is mixed with 100 mL of 0.02 N NaOH solution. The pH of the resulting solution is :
A1B1.7C2D2.33
100mL of 0.15MHCl is mixed with 100mL of 0.005MHCl , what is the pH of the following solution approxmately
View Solution100ml of 0.2MH2SO4 is added to 100ml of 0.2MNaOH. The resulting solution will be
View Solution100ml of 0.2MH2SO4 is added to 100ml of 0.2MNaOH. The resulting solution will be
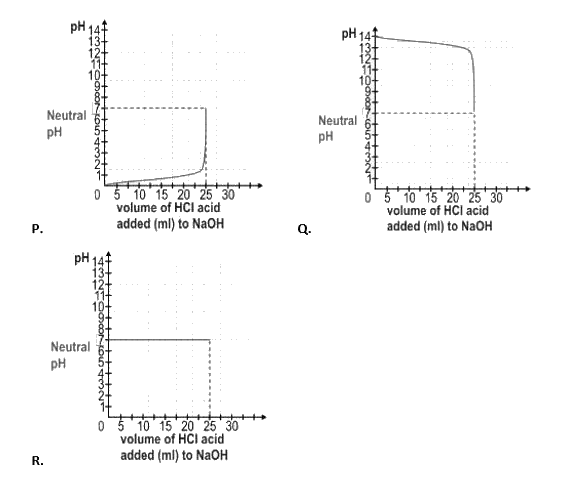
View SolutionAditi adds dropwise 25 ml of concentrated HCl to 25 ml of concentrated NaOH and continuously monitors the pH in the mixture. She finds that the pH of the mixture at the end of the experiment is 7.
Which of the following graph correctly demonstrates the change in pH in the mixture during the experiment?
View Solution100ml of 0.1MCH3COOH are mixed with 100ml of 0.1MNaOH, the pH of the resulting solution would be
View Solution