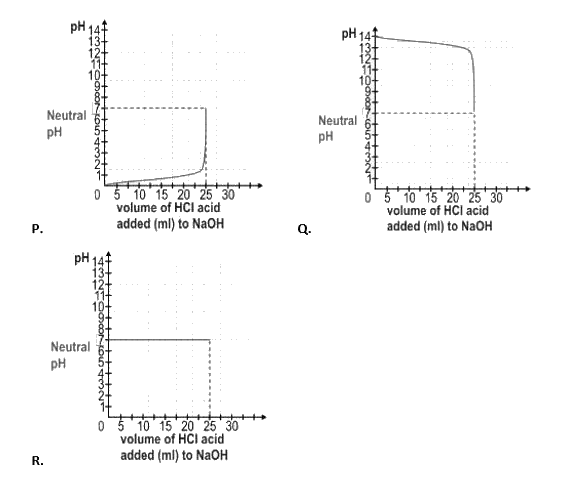
Aditi adds dropwise 25 ml of concentrated HCl to 25 ml of concentrated NaOH and continuously monitors the pH in the mixture. She finds that the pH of the mixture at the end of the experiment is 7.
Which of the following graph correctly demonstrates the change in pH in the mixture during the experiment?

only P
only Q
either P or Q
any of them - P, Q or R
The correct Answer is:B
Step by step video, text & image solution for Aditi adds dropwise 25 ml of concentrated HCl to 25 ml of concentrated NaOH and continuously monitors the pH in the mixture. She finds that the pH of the mixture at the end of the experiment is 7. Which of the following graph correctly demonstrates the change in pH in the mixture during the experiment? by Physics experts to help you in doubts & scoring excellent marks in Class 10 exams.
Topper's Solved these Questions
- BOOK - CBSE MODEL PAPERCHAPTER - PRACTICE PAPER 2022EXERCISE - Multiple Choice Questions60videos
PRACTICE PAPER 2022
- BOOK - CBSE MODEL PAPERCHAPTER - CASE STUDY QUESTIONS CLASS 10TH EXAM 2020-21EXERCISE - MCQs239videos
CASE STUDY QUESTIONS CLASS 10TH EXAM 2020-21
- BOOK - CBSE MODEL PAPERCHAPTER - QUESTION BANK 2021EXERCISE - QUESTIONS60videos
QUESTION BANK 2021
Similar Questions
In an acid base titration, 0.1 M HCI solution was added to the NaOH solution of unknown strength. Which of the following correctly shows the change of pH of the titration mixture in this experiment?
 View Solution
100 mL of 0.1 HCl is taken in a beaker and to it 100 mL of 0.1 M NaOH is added in steps of 2ml and the pH is continuously measured . Which of the following graphs correctly depicts the change in pH
View Solution
Knowledge Check
- Question 1 - Select One
Which of the following does not make any change in pH when added to 10 mL dilute HCl
A5 ml pure waterB20 ml pure waterC10 ml HClDSame 20 ml dilute HCl - Question 2 - Select One
Which one of the following curves represents the graph pH during the titration of NaOH and HCl(aq)
A B
B C
C D
D
- Question 3 - Select One
While demonstrating acid-base reactions, Ms. Prabha, a science teacher added sodium oxide to HCl until it was in excess. Which of the following graphs correctly represents the change in pH?
A B
B C
C D
D
A weak base BOH of concentration 0.02 mole/litre has a pH value of 10.45. If 100 mL of this base is mixed with 10 mL of 0.1 M HCI, what will be the pH of the mixture?
View Solutionwhich one of the following curves represents the graph of pH during titration of NaOH and HCl (aq).?
View SolutionWhich of the following on adding will not change the pH of 100mL x M HCl (dil) solution:
View SolutionWhich one of the following mixtures will give a solution with pH greater than 7 ?
View Solution5 mL each of concentrated HCl, HNO3 and a mixture of concentrated HNO3 (5 mL) were taken in test tubes labelled as A, B and C. A small piece of metal was put in each test tube. No change occurred in test tubes A and B but the metal got dissolved in test tube. The metal could be
View Solution

