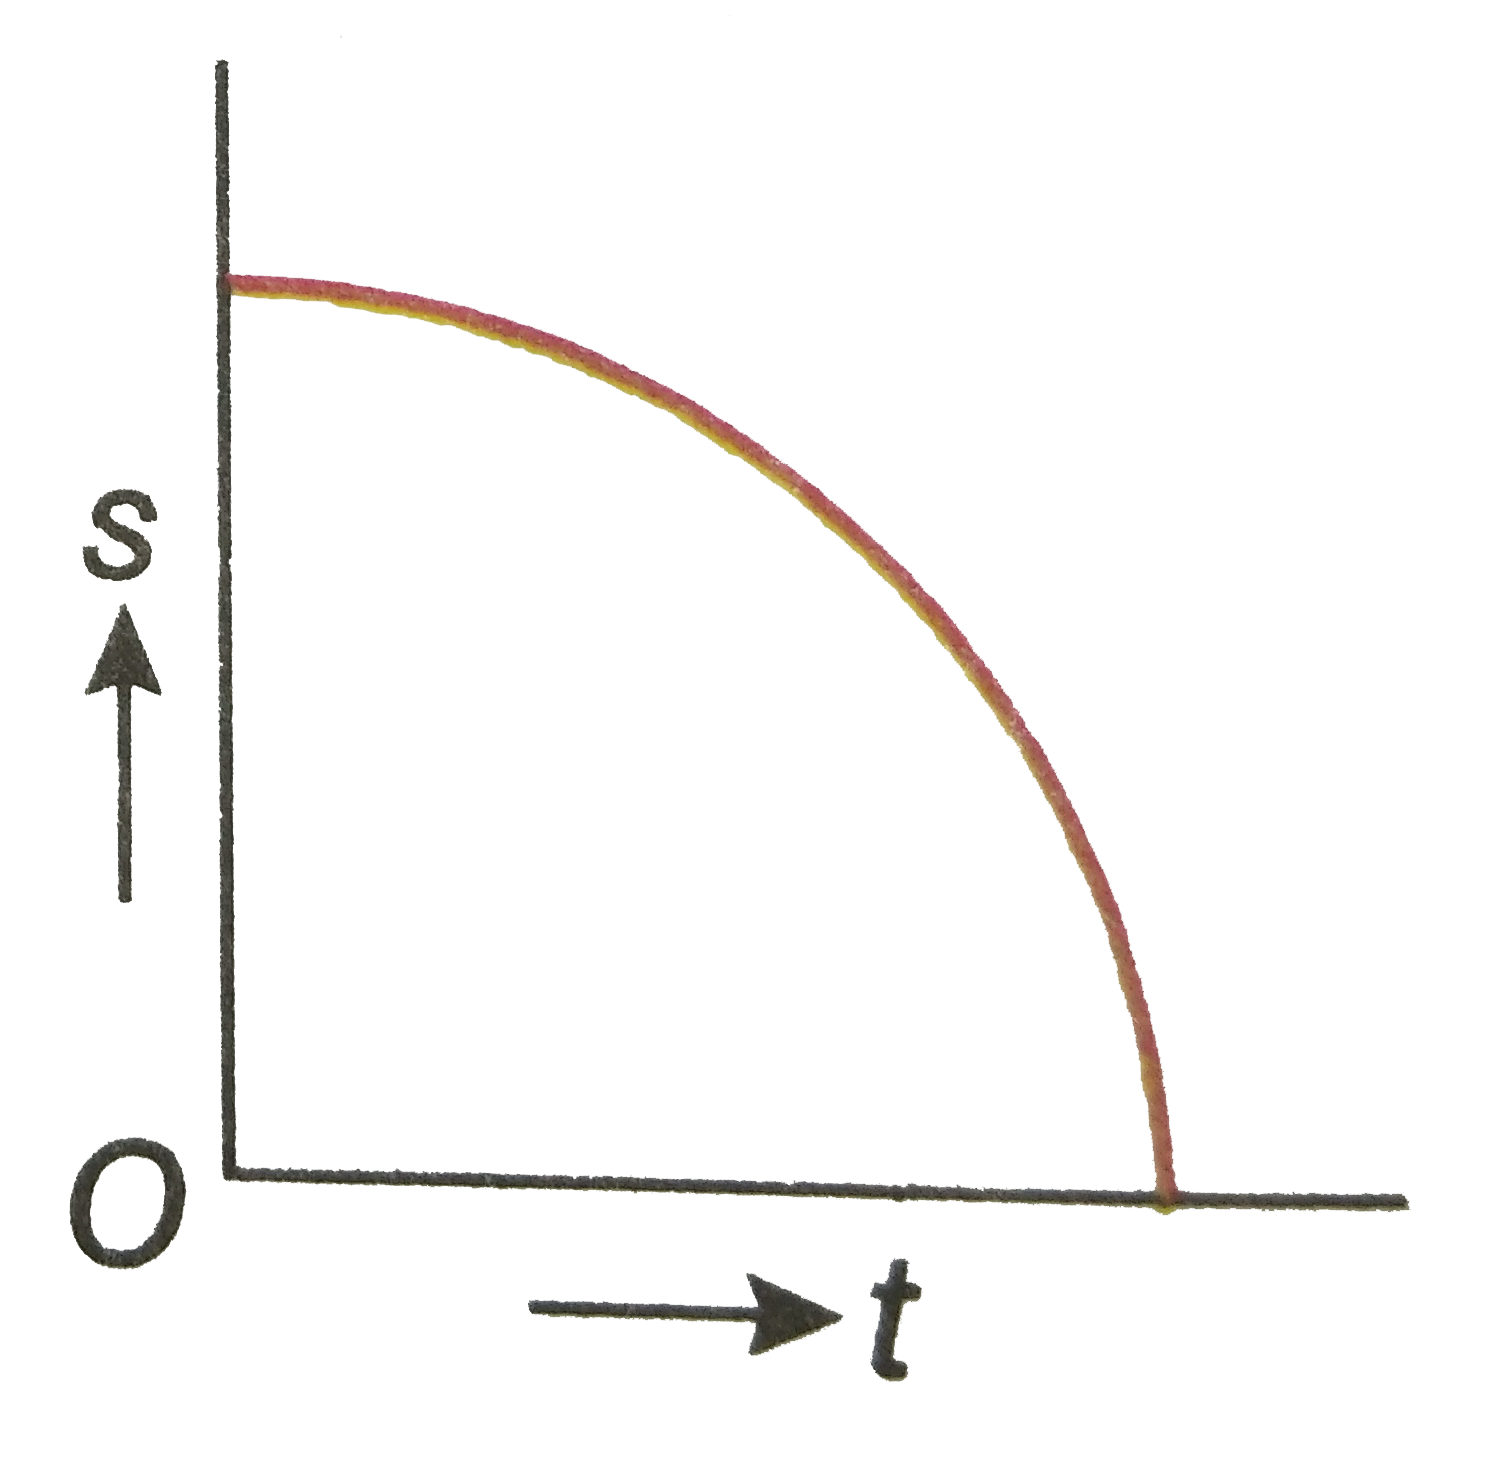
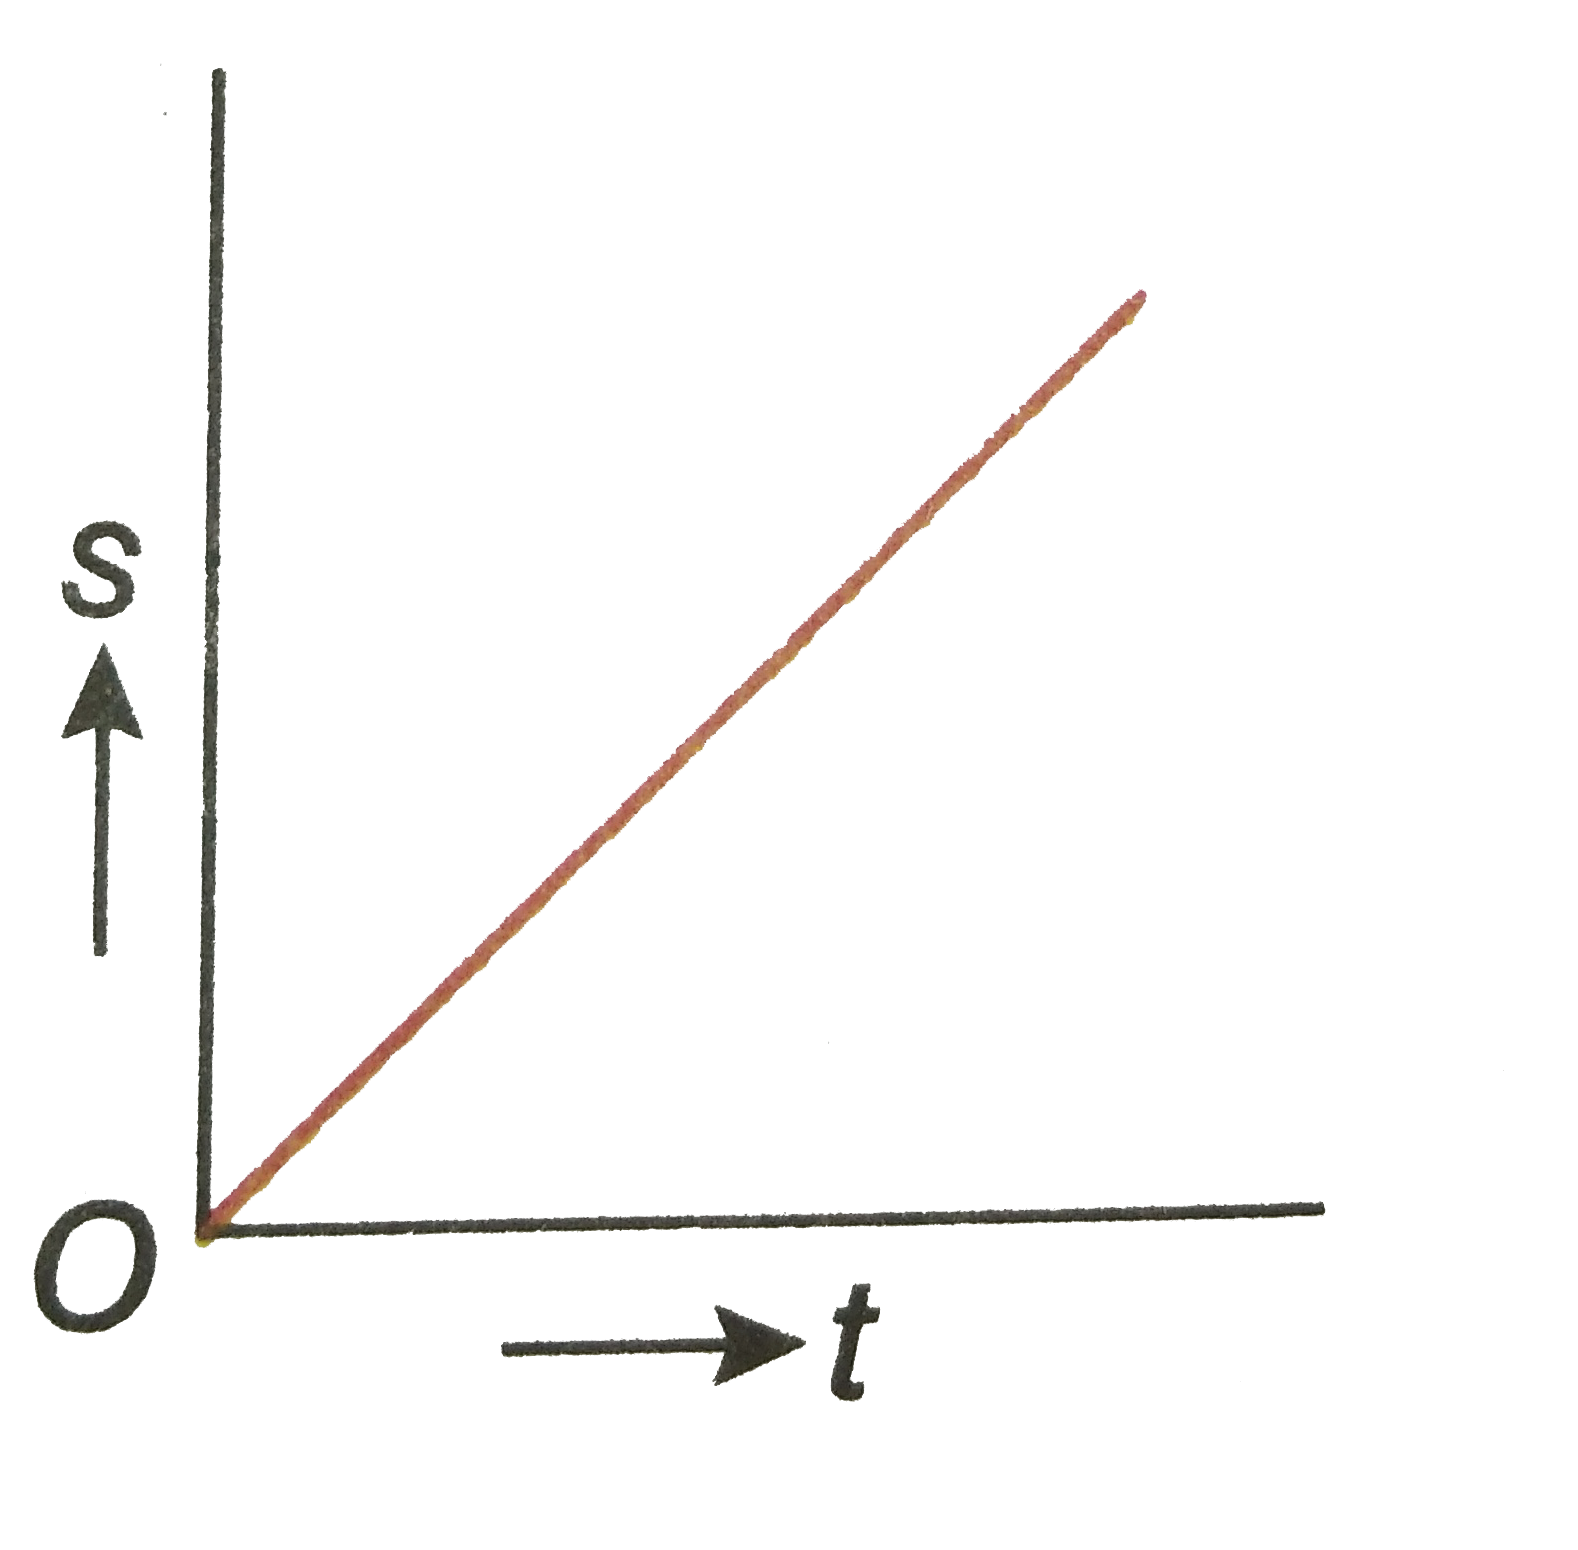
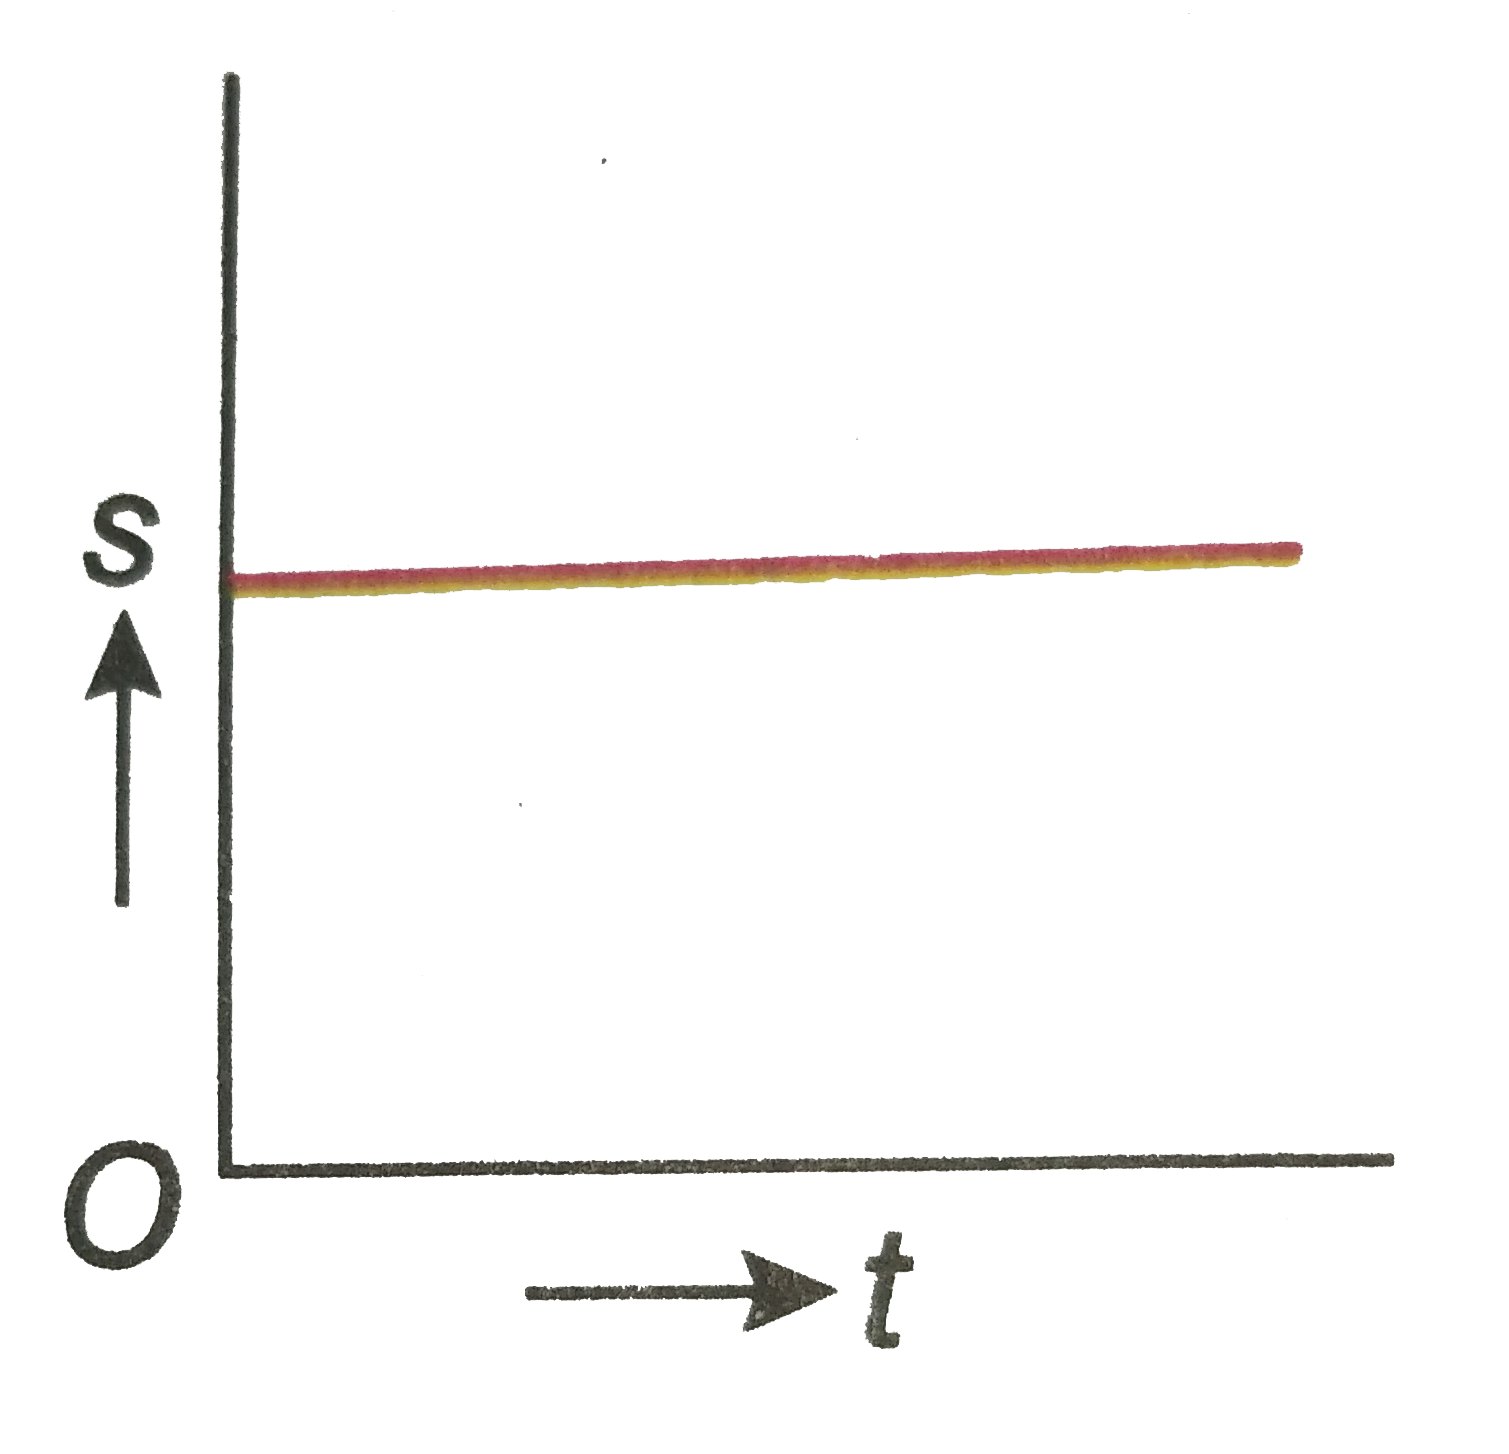
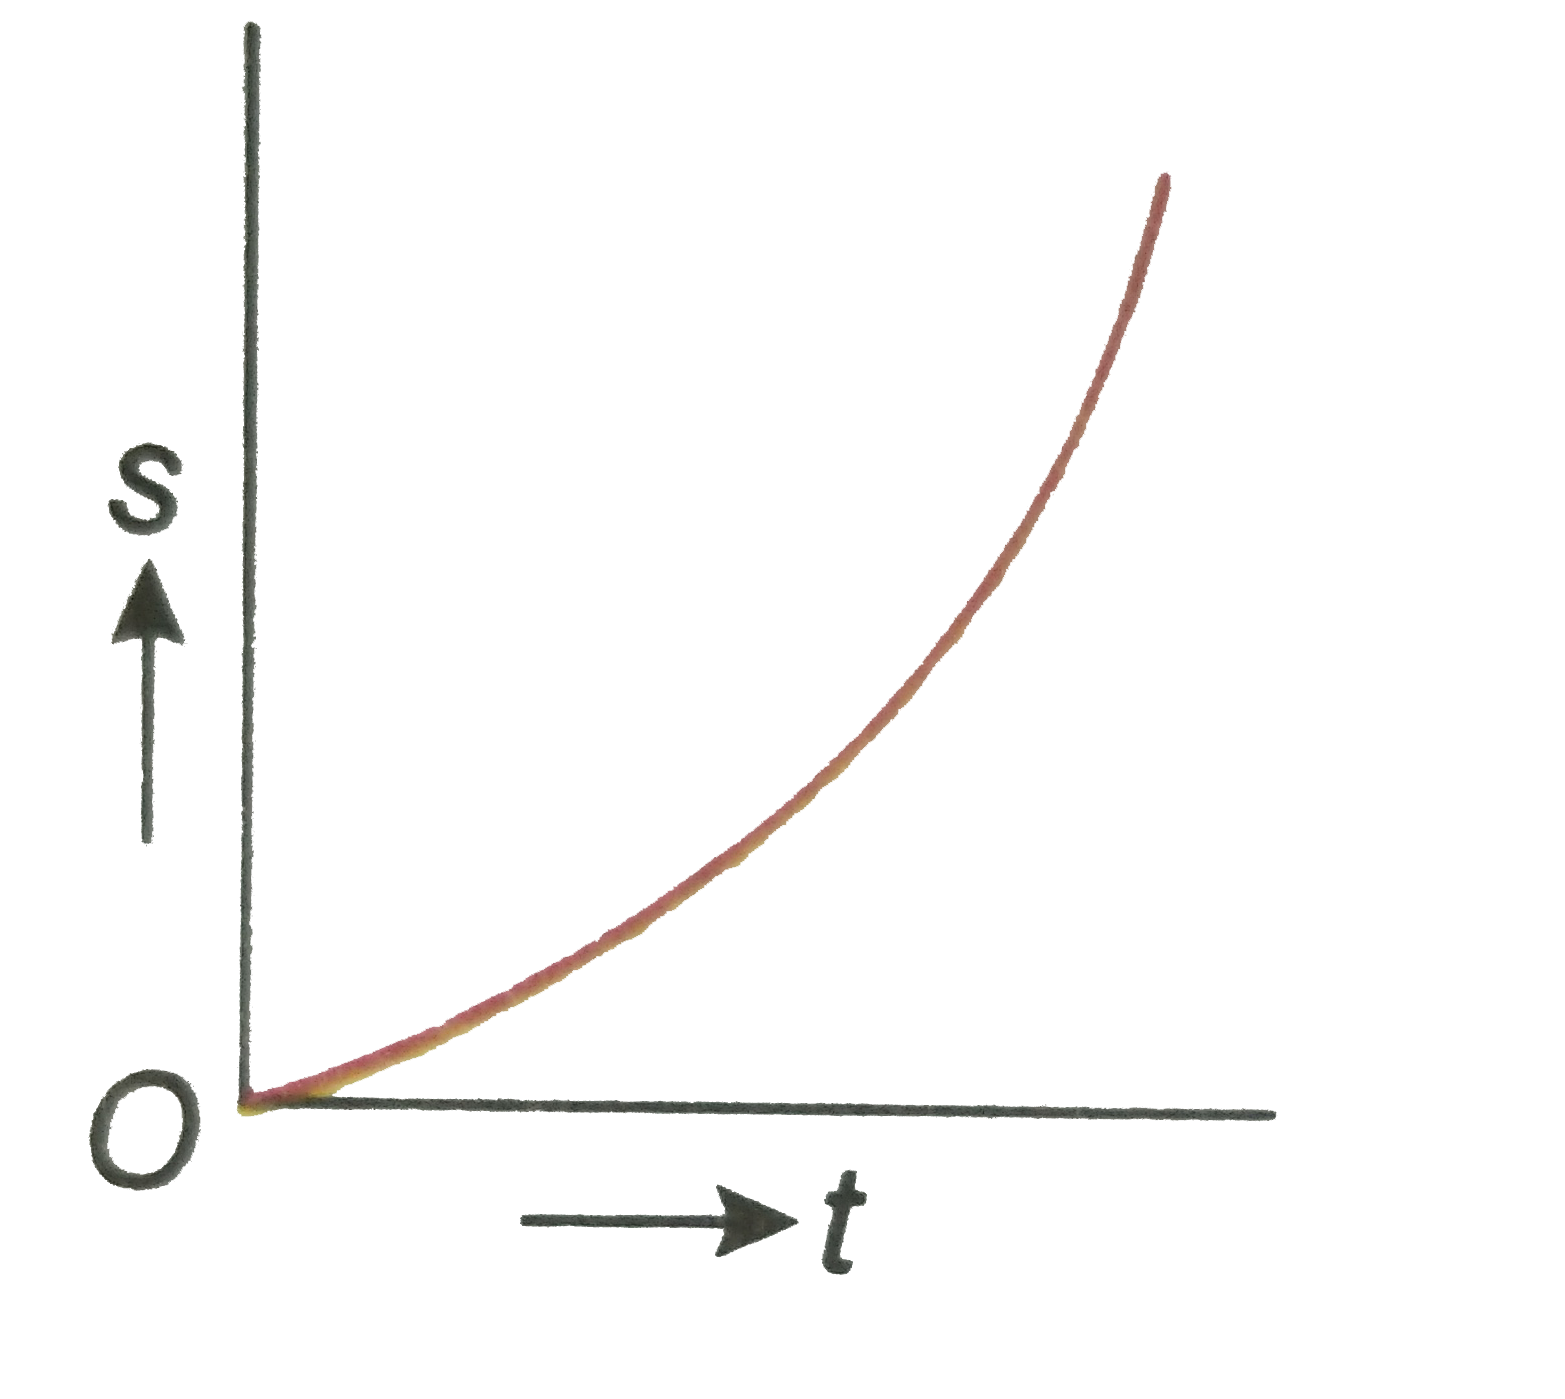
A body starts moving unidirectionally under the influence of a source of constant power . Which one of the graph corectly shows the variation of displacement (s) with time (t)?Solution in Bengali


Step by step video & image solution for A body starts moving unidirectionally under the influence of a source of constant power . Which one of the graph corectly shows the variation of displacement (s) with time (t)? by Physics experts to help you in doubts & scoring excellent marks in Class 12 exams.
Updated on:21/07/2023Topper's Solved these Questions
- QUESTION PAPER OF NEET 2017Book:CHHAYA PUBLICATIONChapter:QUESTION PAPER OF NEET 2017Exercise:QUESTION PAPERS OF (JEE MAIN) (2017)
Explore 28 Videos
- QUANTUM THEORYBook:CHHAYA PUBLICATIONChapter:QUANTUM THEORYExercise:CBSE Scanner
Explore 29 Videos
- QUESTION PAPER OF NEET 2018Book:CHHAYA PUBLICATIONChapter:QUESTION PAPER OF NEET 2018Exercise:QUESTIONS
Explore 58 Videos
Similar Questions
A man grows into a giant such that his linear dimensions increase by a factor of 9. Assuming that his density remains same, the stress in the leg will change by a factor of
View SolutionDefine the terms (i) 'cut-off voltage' and (ii) 'threshold frequency' in relation to phenomenon of photoelecric effect.
Using Einstein's photoelectric equation show how the cutt-off voltage and threshold frequency for a given photosensitive material can be determined with the help of a suitable plot/graph.
View SolutionIt is found that if a neutron suffers an elastic collinear collision with deuterium at rest, fractional loss of its energy is pd, while for its similar collision with carbon nucleus at rest, fractional loss of energy is pc. The values of pd and pc are respectively
View SolutionA body is moving unidirectionally under the influence of a source of constant power supplying energy. Which of the diagrams shown in figure. Correctly shows the displacement-time curve for its motion ?
View SolutionA body starts moving unidirectionally under the influence of a source of constant power . Which one of the graph correctly shows the variation of displacement (s) with time (t) ?
View SolutionA body is moving unidirectionally under the influence of a source of constant power. Its displacement in time t is proportional to
View SolutionA body is moving unidirectionally under the influence of a source of constant power. Its displacement in time t is proportional to
View SolutionA body is moving unidirectionally under the influence of a source of constant power. Its displacement in time t is proportional to
View SolutionA body is moving unidirectionally under the influence of a source of constant power. Its displacement in time t is proportional to
View SolutionA body is moving unidirectionally under the influence of a source of constant power supplying energy. Which of the diagrams shown below correctly shows the displacement time curve for its motion ?
View SolutionA body is moving unidirectionally under the influence of a source of constant power. It displacement in time t is proportional to
View Solution. A body is moving unidirectionally under the influence of a source of constant power supplying energy. Which of the diagrams shown below correctly shows the displacement time curve for its motion ?
View SolutionA body is moving indirectionally under the influence of a source of constant power . Its displacement in time t is proportional to
View SolutionUnder the source of constant power a body start to move . Which one of following graph truly represents the change of displacement (s) with time (t) ?
View SolutionA body is moving undirectionally under the influence of a source of constant power. It displacement in time t is proportional to
View Solution
