A body starts moving unidirectionally under the influence of a source of constant power . Which one of the graph correctly shows the variation of displacement (s) with time (t) ?


The correct Answer is:D
We know, power =work done per second
=increase in kinetic energy per second = costant
So, velocity of the body increases with time.
Therefore , slope (dsdt=v) of the s-t graph increases with time.
Topper's Solved these Questions
- WORK AND ENERGYBOOK - CHHAYA PUBLICATIONCHAPTER - WORK AND ENERGYEXERCISE - CBSE SCANNER
27 Videos
- WORK AND ENERGYBOOK - CHHAYA PUBLICATIONCHAPTER - WORK AND ENERGYEXERCISE - EXAMINATION ARCHIVE WITH SOLUTIONS (AIPMT)
3 Videos
- WBCHSE QUESTION PAPER -2019BOOK - CHHAYA PUBLICATIONCHAPTER - WBCHSE QUESTION PAPER -2019EXERCISE - SECTION - II ( GROUP -D)
10 Videos
Similar Questions
A body is moving unidirectionally under the influence of a source of constant power supplying energy. Which of the diagrams shown in figure. Correctly shows the displacement-time curve for its motion ?
View SolutionA body is moving undirectionally under the influence of a source of constatn power. It displacement in time t is proportional to (i) t1/2 (ii) t (iii) t3/2 (iv) t2
View Solution
Knowledge Check
A body is moving unidirectionally under the influence of a source of constant power supplying energy. Which of the diagrams shown in figure. Correctly shows the displacement-time curve for its motion ?
A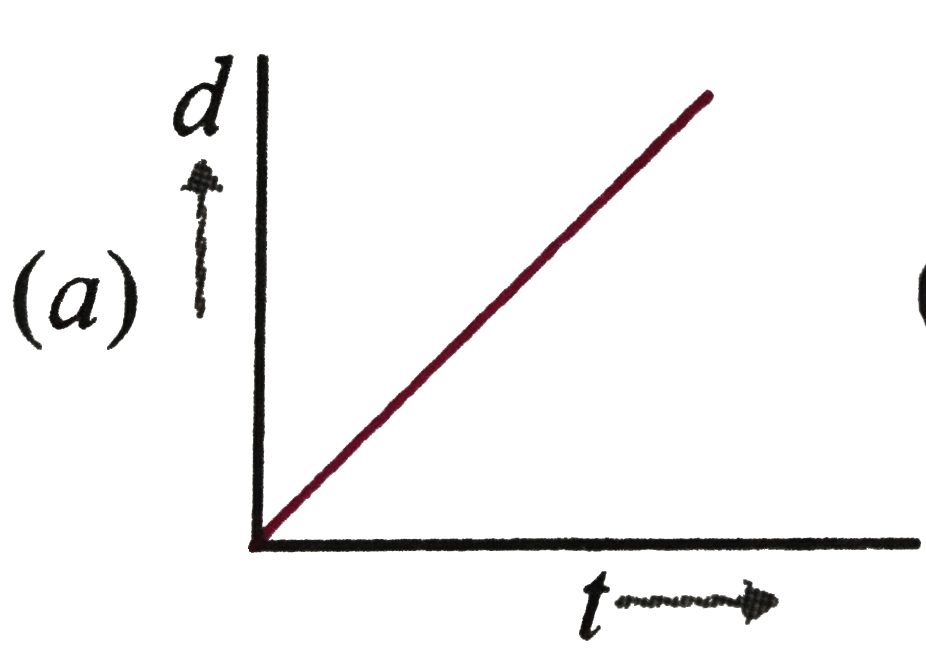 B
B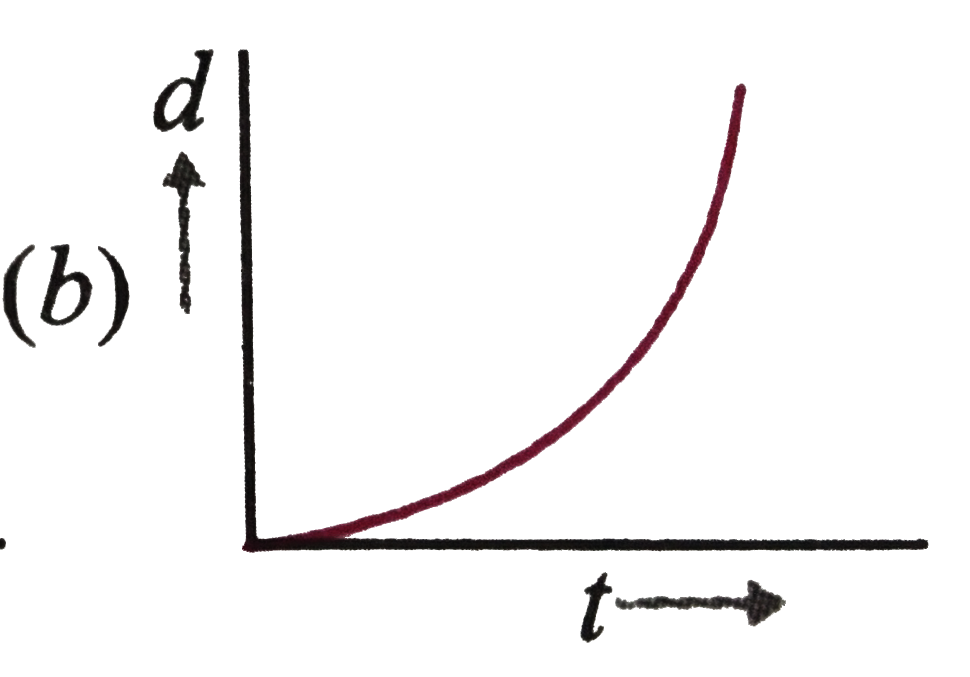 C
C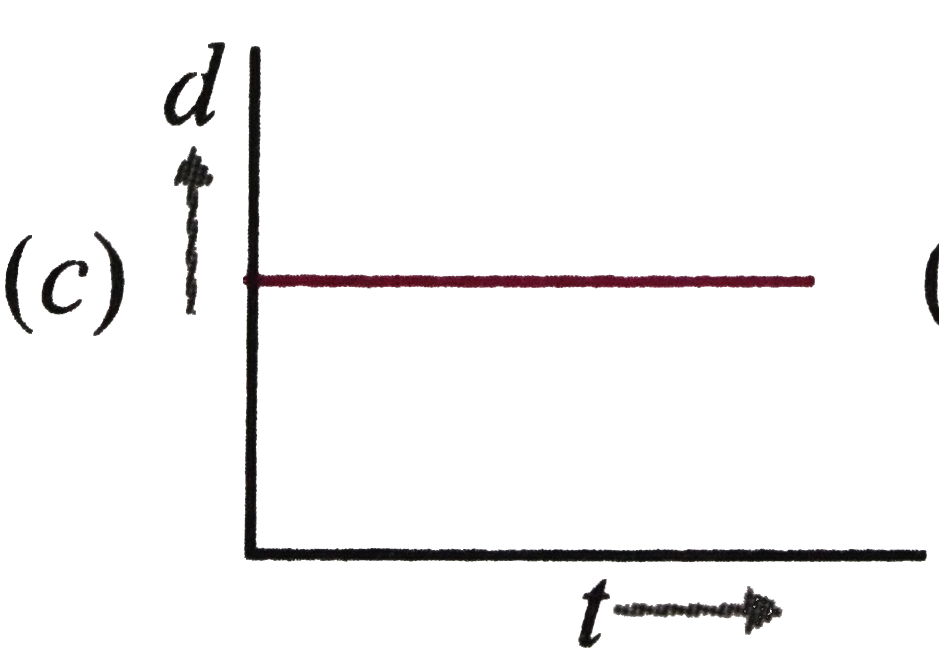 D
D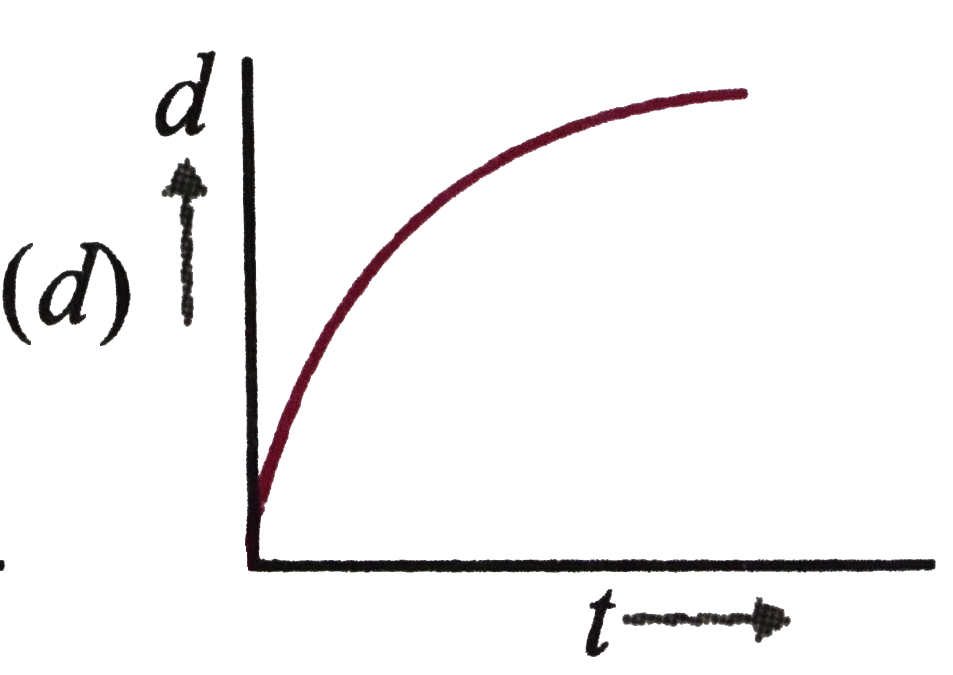
A body is moving unidirectionally under the influence of a source of constant power supplying energy. Which of the diagrams shown in figure. Correctly shows the displacement-time curve for its motion ?
A B
B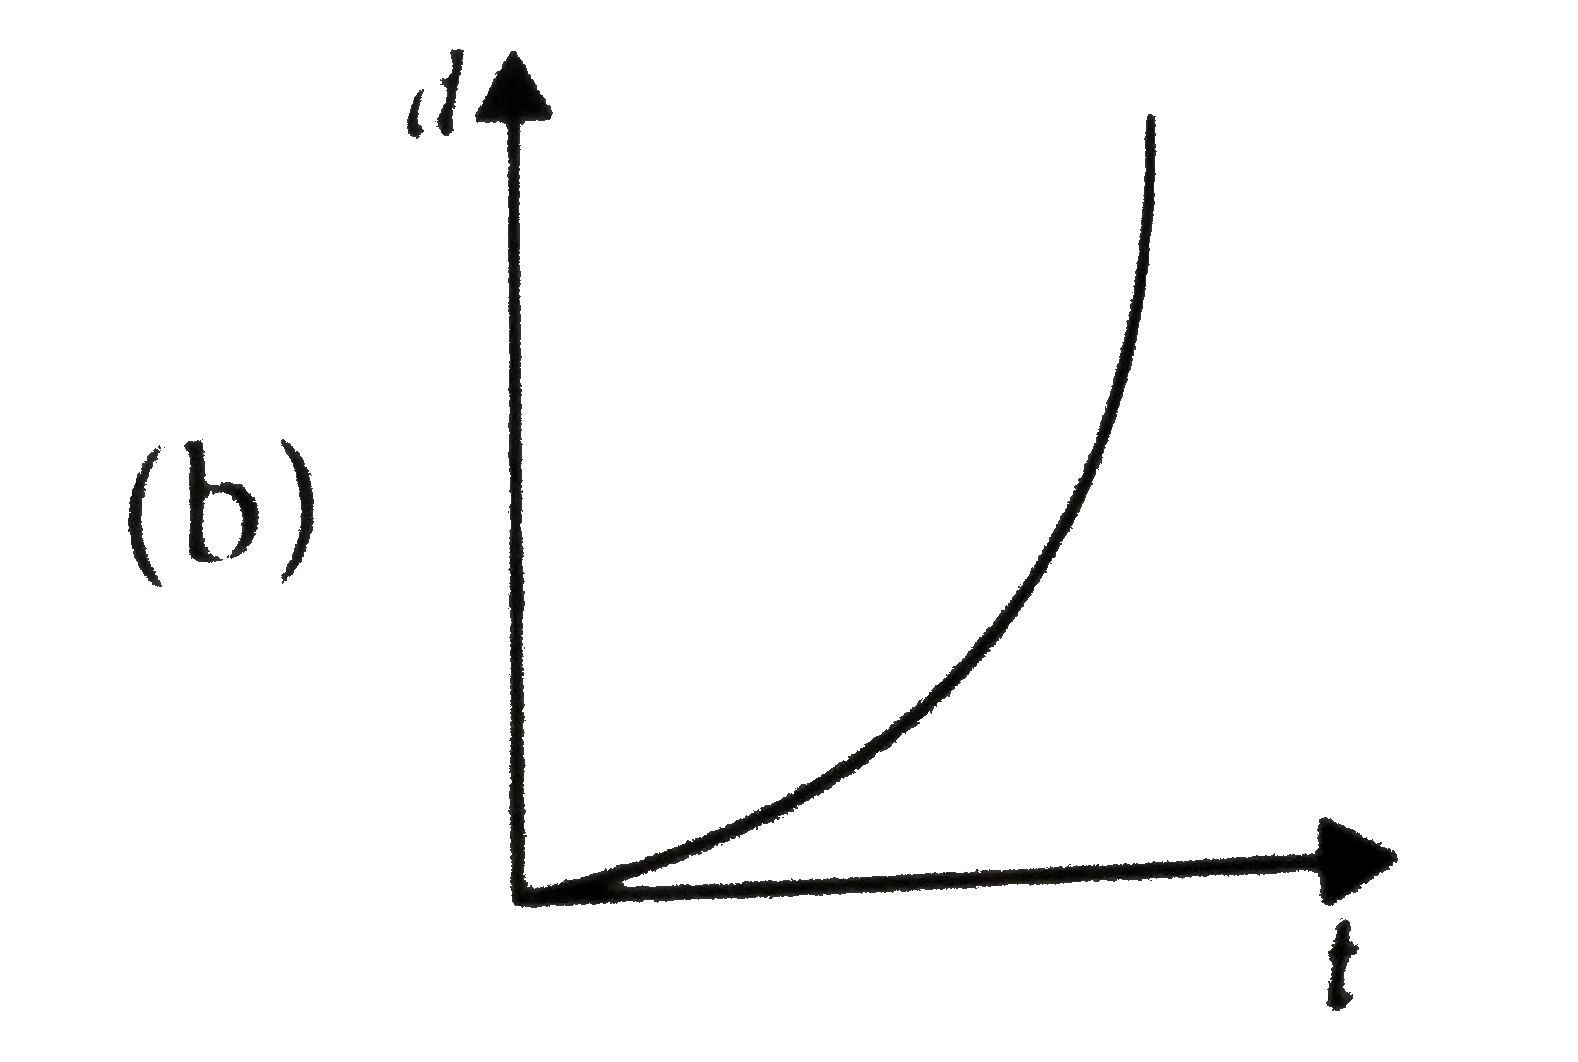 C
C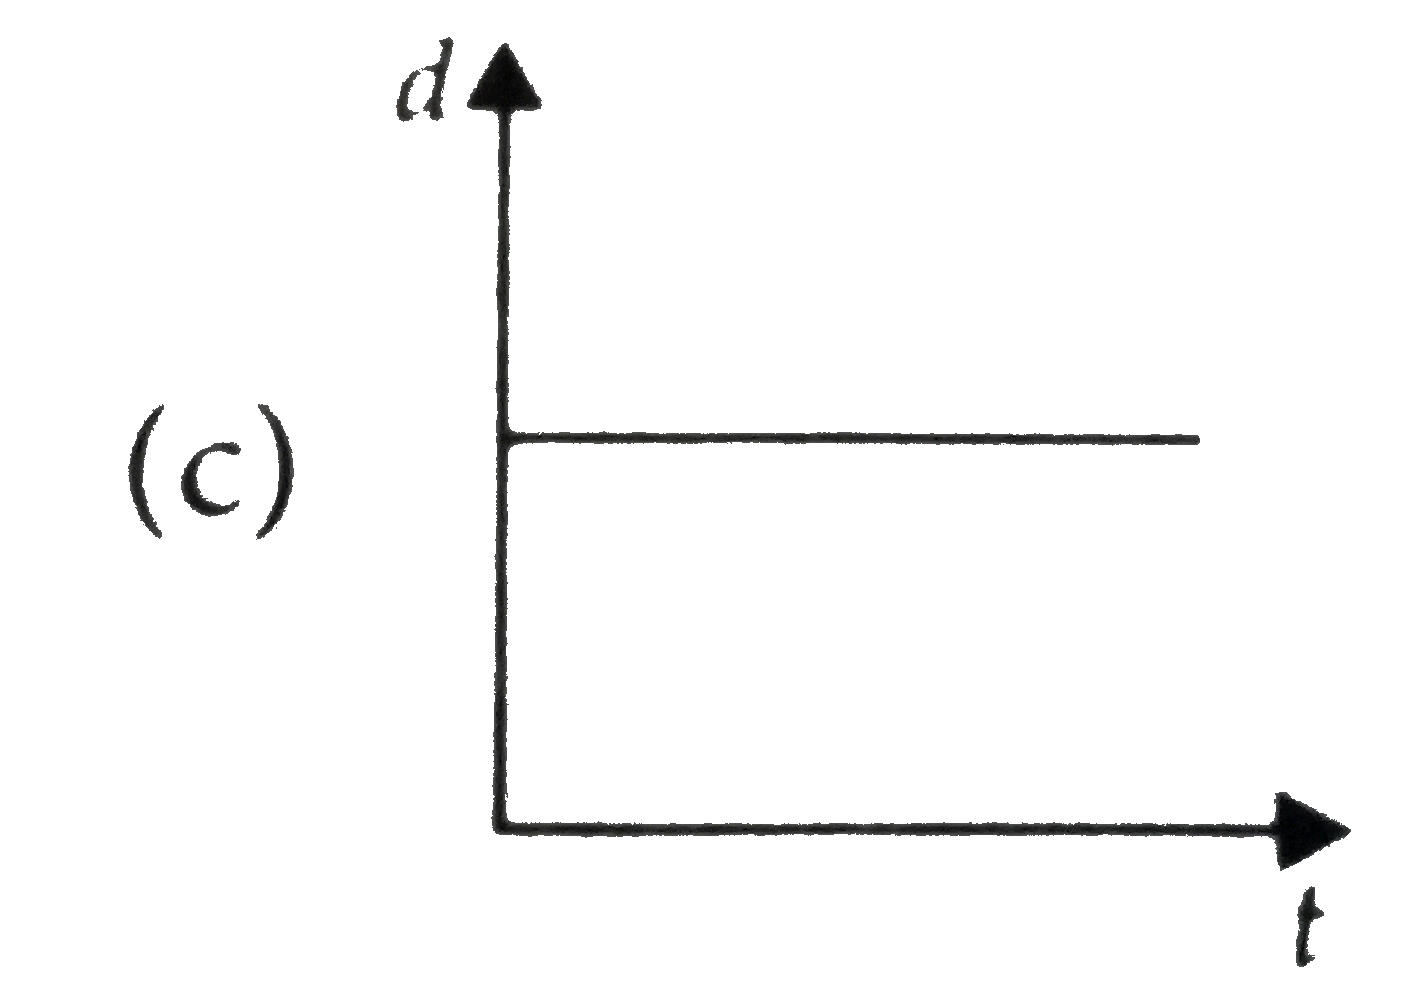 D
D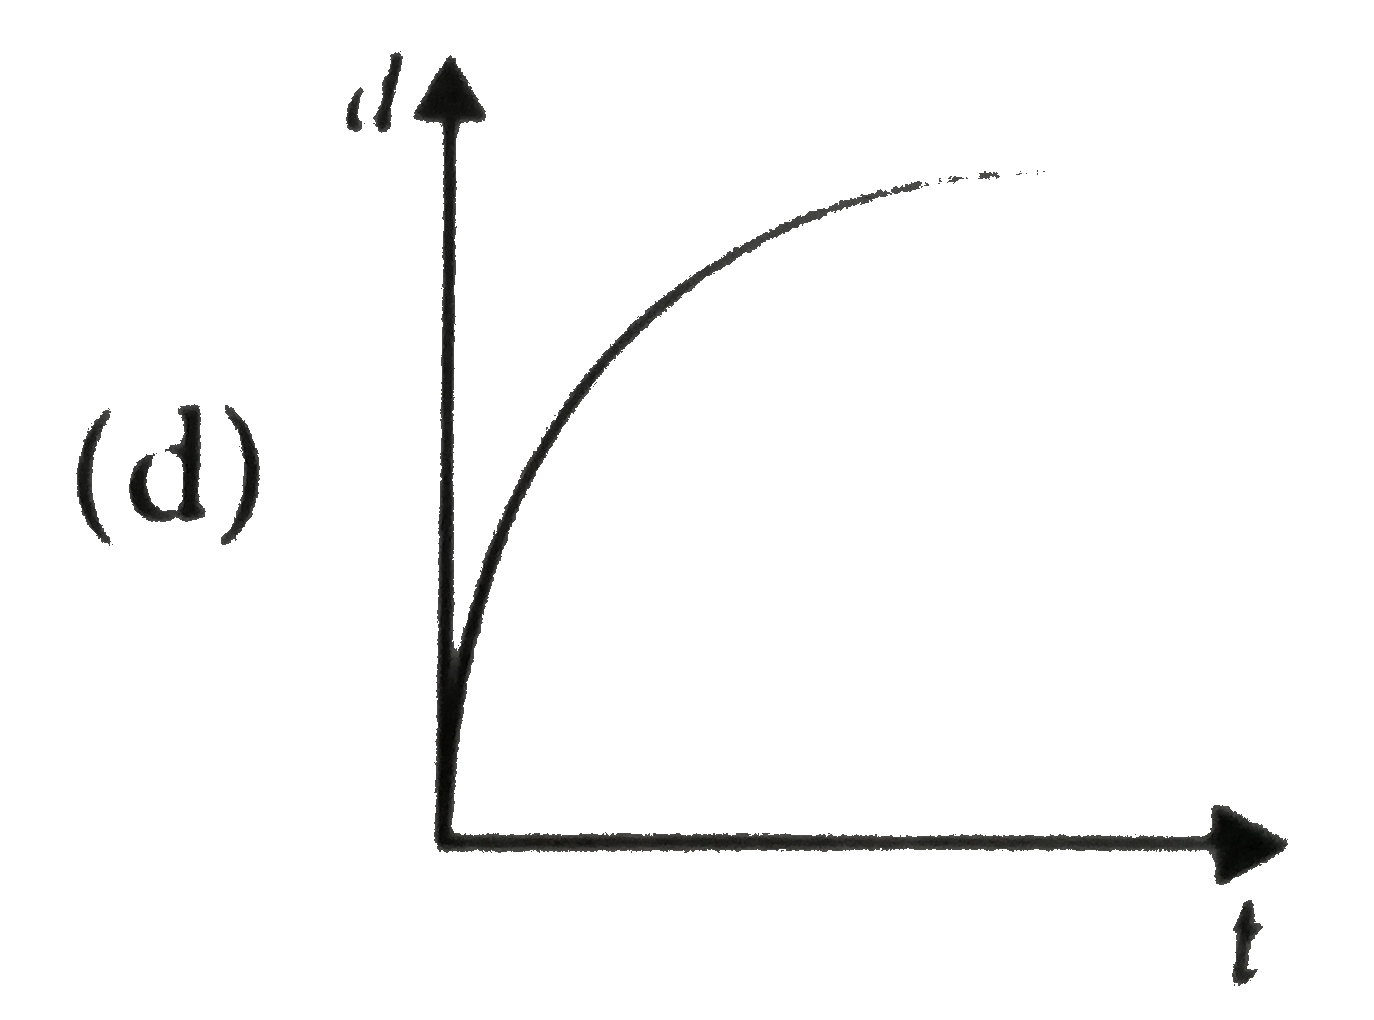
A body is moving unidirectionally under the influence of a sources of constant power. The square of its displacement in time t is proportional to
At3Bt2CtD√t
A body is moving undirectionally under the influence of a source of constatn power. It displacement in time t is proportional to (i) t1/2 (ii) t (iii) t3/2 (iv) t2
View SolutionA body undergoing a straight line motion is under the influence of source of constant power. How does its displacement very with time?
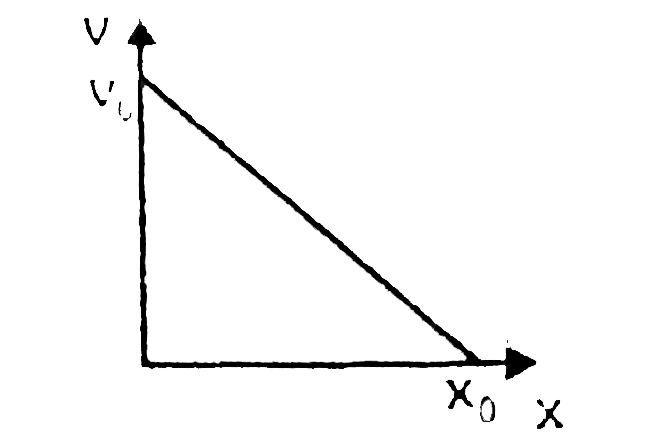
View SolutionThe given graph shows the variation of velocity with displacement. Which one of the graph given below correctly represents the variation of acceleration with displacement :-
View SolutionA body starting from the the rest moves along a straight line with constant acceleration. Which one of the following graphs represents the variation of speed(v) and distance(s)?
View SolutionA body starting from the rest moves along a straight line with constant acceleration .Which one of the following graphs represent the variation of speed (v) and distance (s) ?
View Solution
