A particle moves as shown in the following figure 1.104:
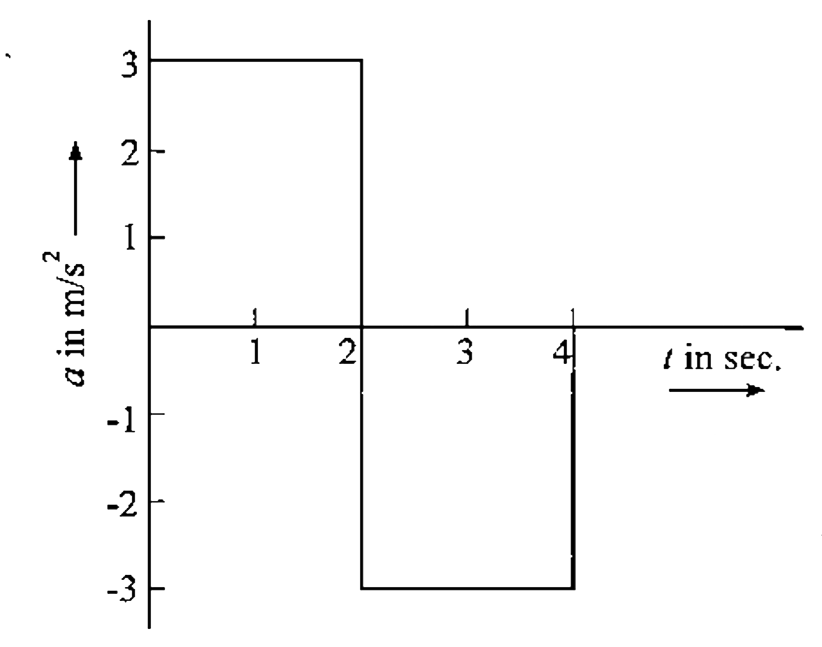
From the above curve the correct velocity-time graph for the interval of 4 seconds will be :
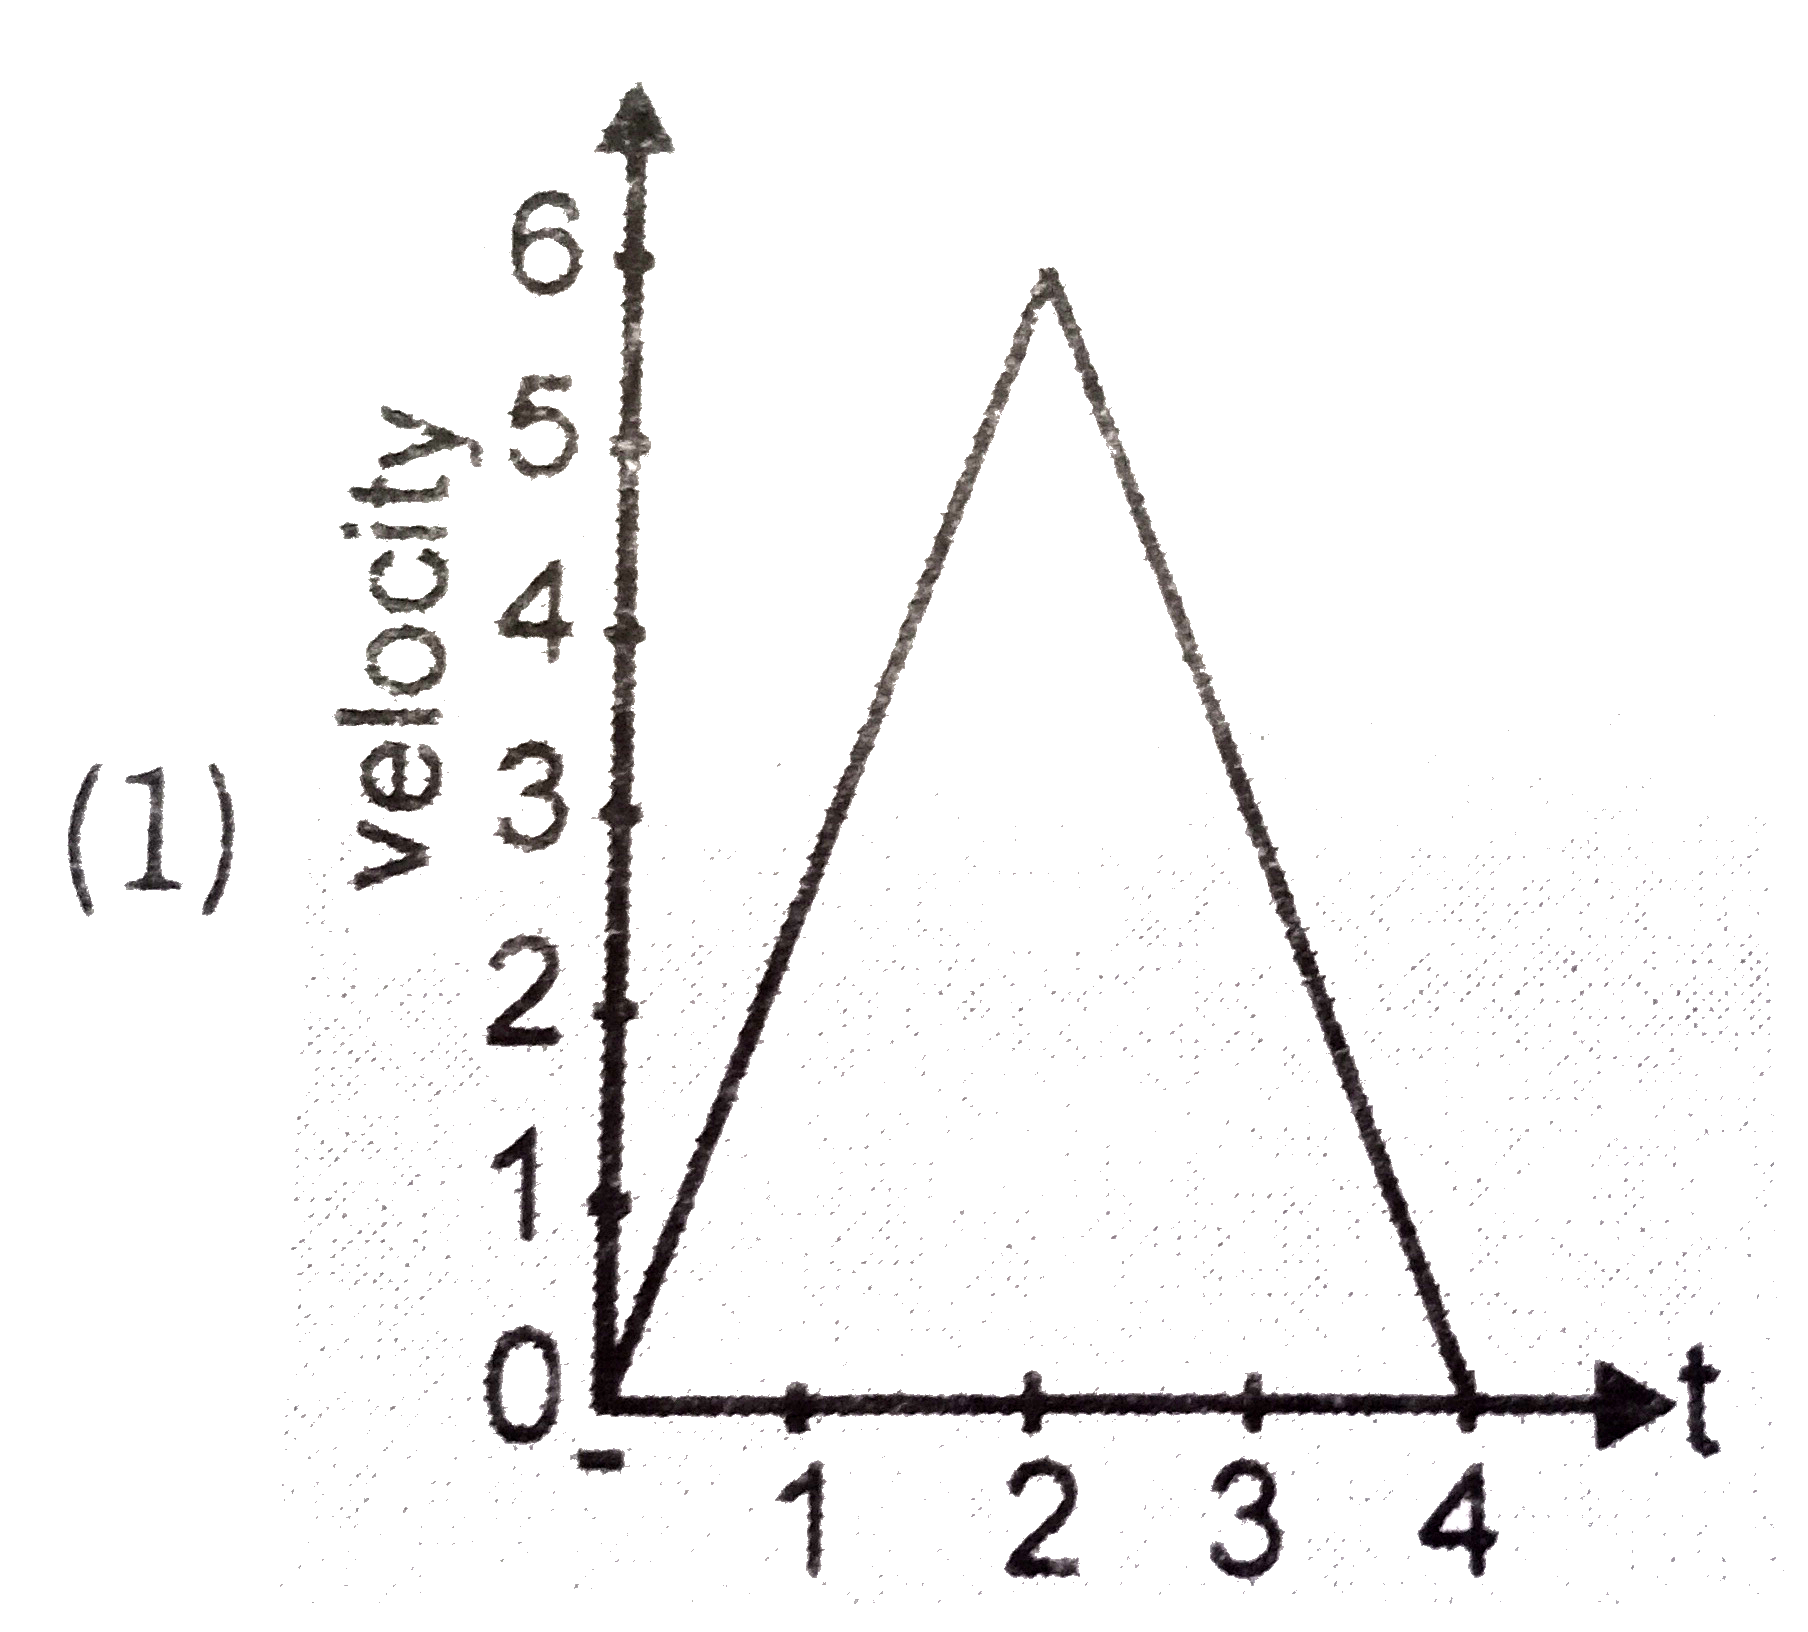

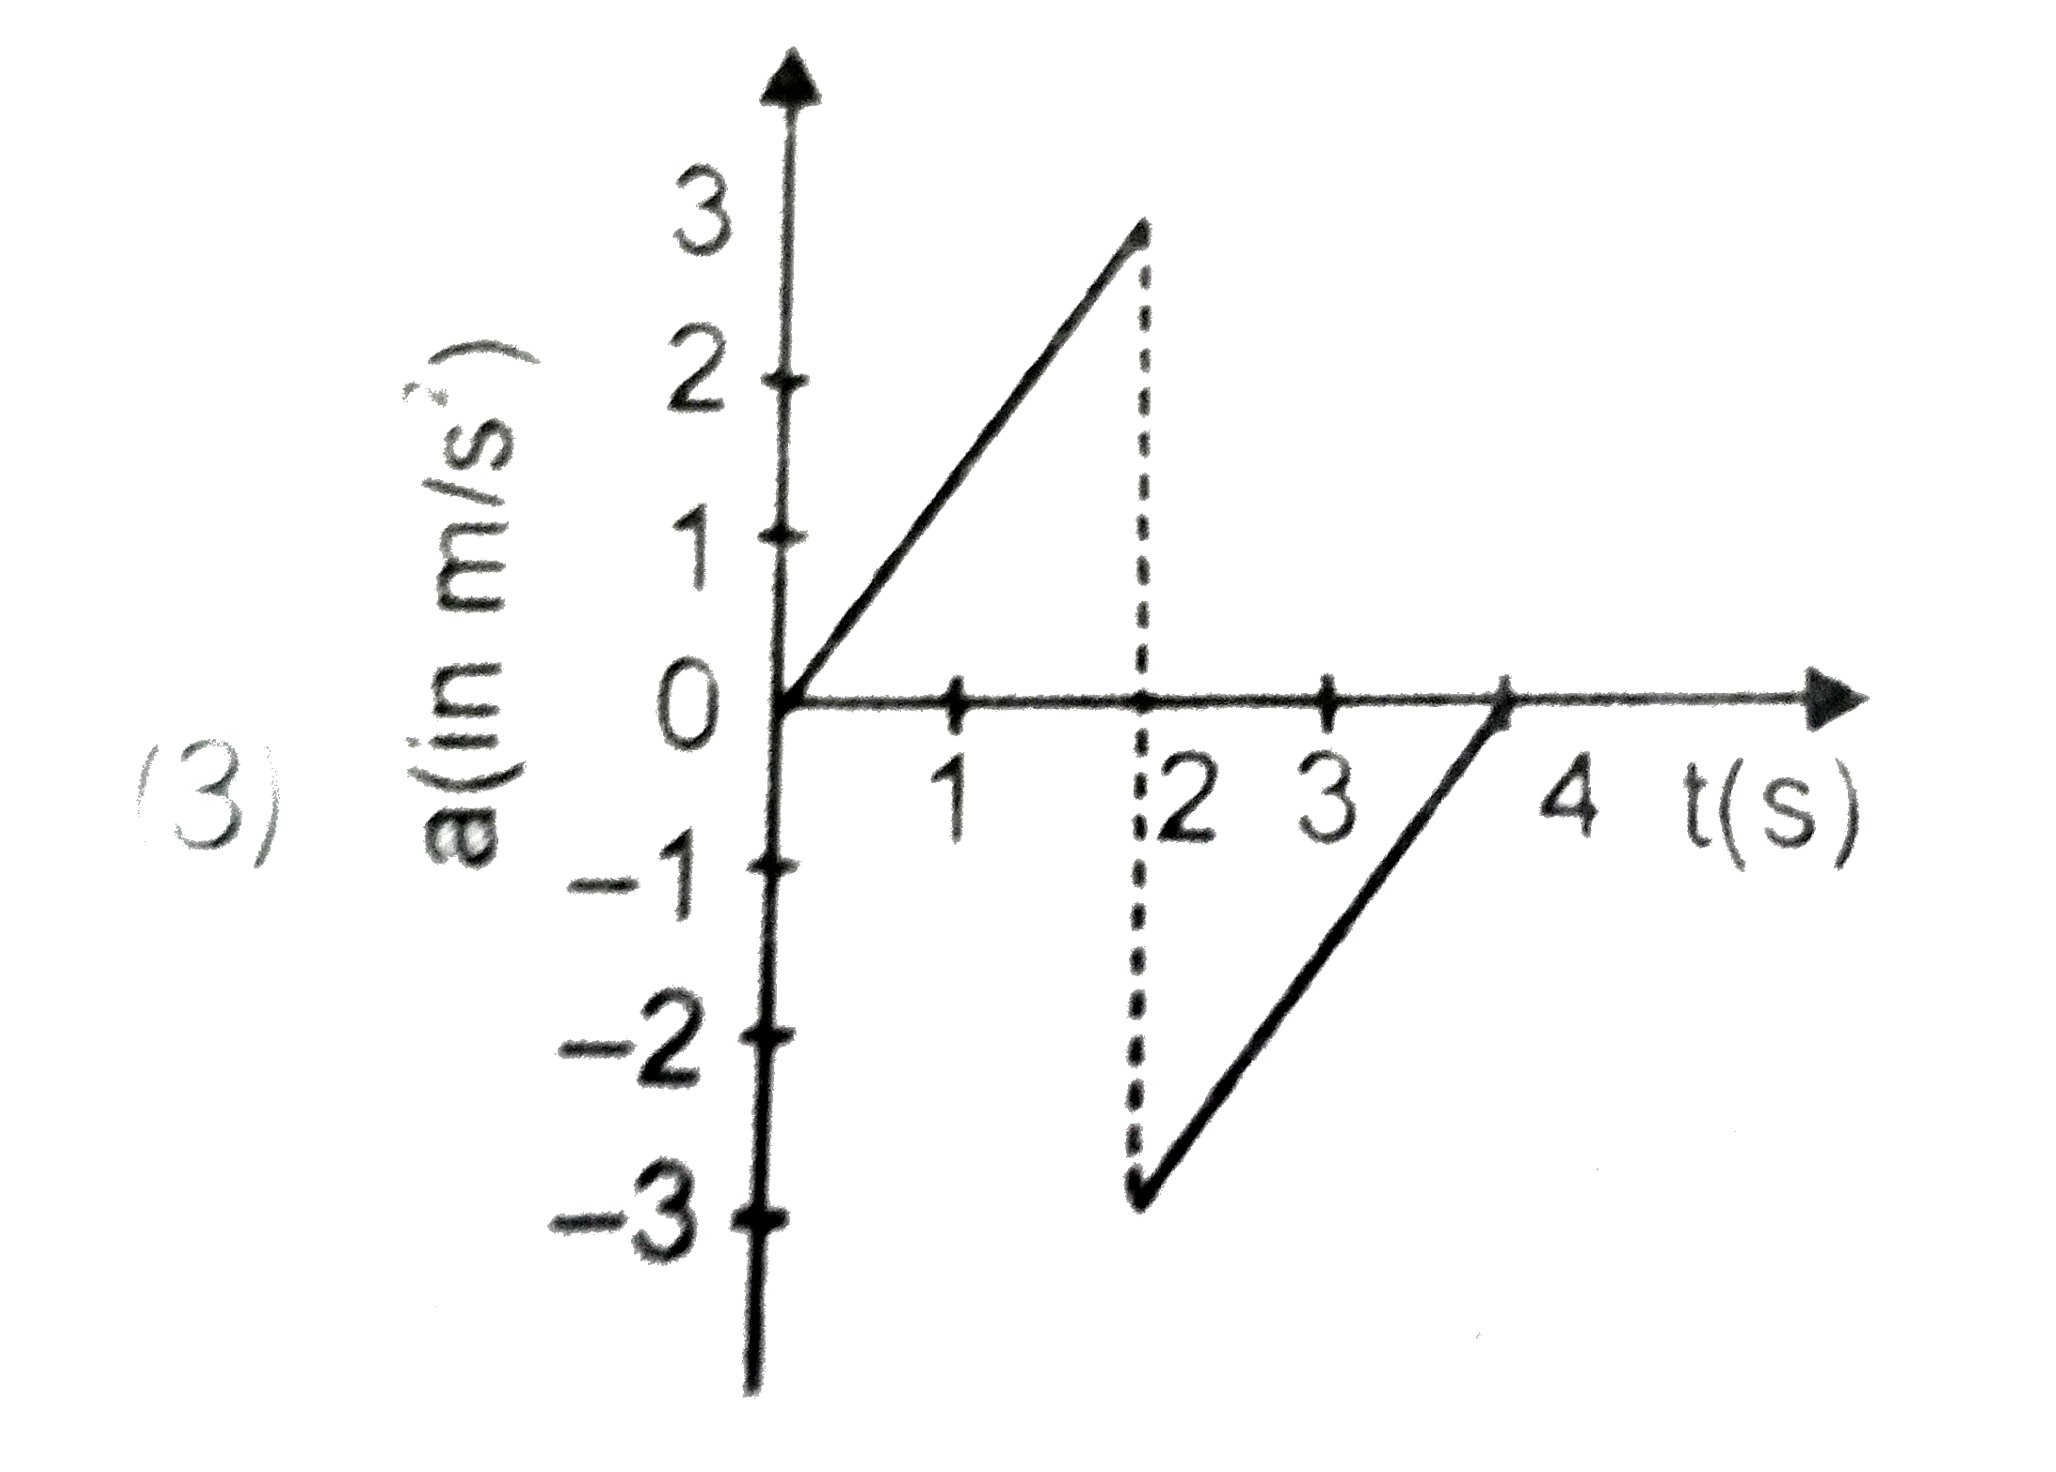

The correct Answer is:A
Step by step video, text & image solution for A particle moves as shown in the following figure 1.104: From the above curve the correct velocity-time graph for the interval of 4 seconds will be : by Physics experts to help you in doubts & scoring excellent marks in Class 12 exams.
Topper's Solved these Questions
- BOOK - ALLENCHAPTER - MOTION IN A PALNEEXERCISE - EXERCISE-341videos
MOTION IN A PALNE
- BOOK - ALLENCHAPTER - MOTION IN A PALNEEXERCISE - SOLVED EXAMPLE28videos
MOTION IN A PALNE
- BOOK - ALLENCHAPTER - MOTION IN A PALNEEXERCISE - EXERCISE-199videos
MOTION IN A PALNE
- BOOK - ALLENCHAPTER - KINEMATICS-2DEXERCISE - Exercise (O-2)48videos
KINEMATICS-2D
- BOOK - ALLENCHAPTER - NEWTON'S LAWS OF MOTION & FRICTIONEXERCISE - EXERCISE (JA)4videos
NEWTON'S LAWS OF MOTION & FRICTION
Similar Questions
The displacement-time graph of a particle executing simple harmonic motion is shown in the figure
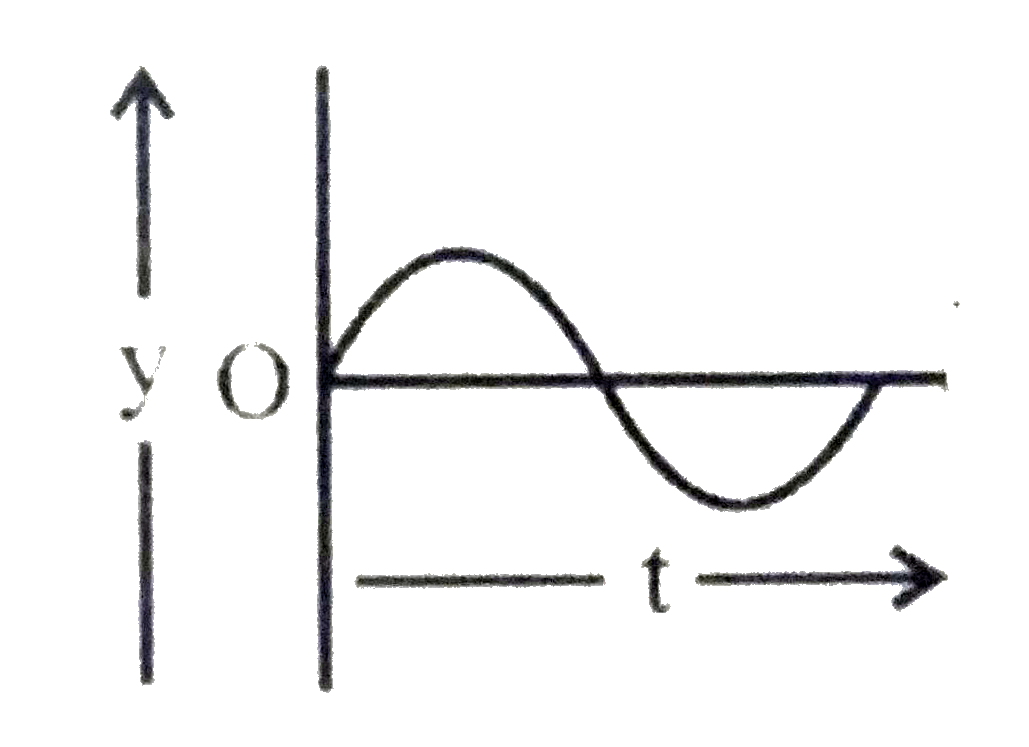
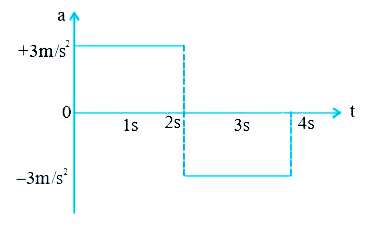
Which one of the following graphs is the correct forcetime graph for the motion of the particle ?View SolutionA particle starts from rest at t=0 and undergoes an acceleration as shown in figure.
Draw the velocity-time graph of the motion of the particle during the interval from zero to 4 second.
 View Solution
Knowledge Check
- Question 1 - Select One
The velocity − time graph of a particle is as shown in figure
 AIt moves with a constant acceleration throughoutBIt moves with an acceleration of constant magnitude but changing direction at the end of every two secondCThe displacement of the particle is zeroDThe velocity becomes zero at t=4 second
 - Question 2 - Select One
The area under velocity-time graph for a particle in a given interval of time represents
AvelocityBaccelerationCwork doneDDisplacement does not tell the nature of the actual motion of a particle between the points. - Question 3 - Select One
The force-time(F–t) curve of a particle executing linear motion is as shown in the figure. The momentum acquired by the particle in time interval from zero to 8 second will be
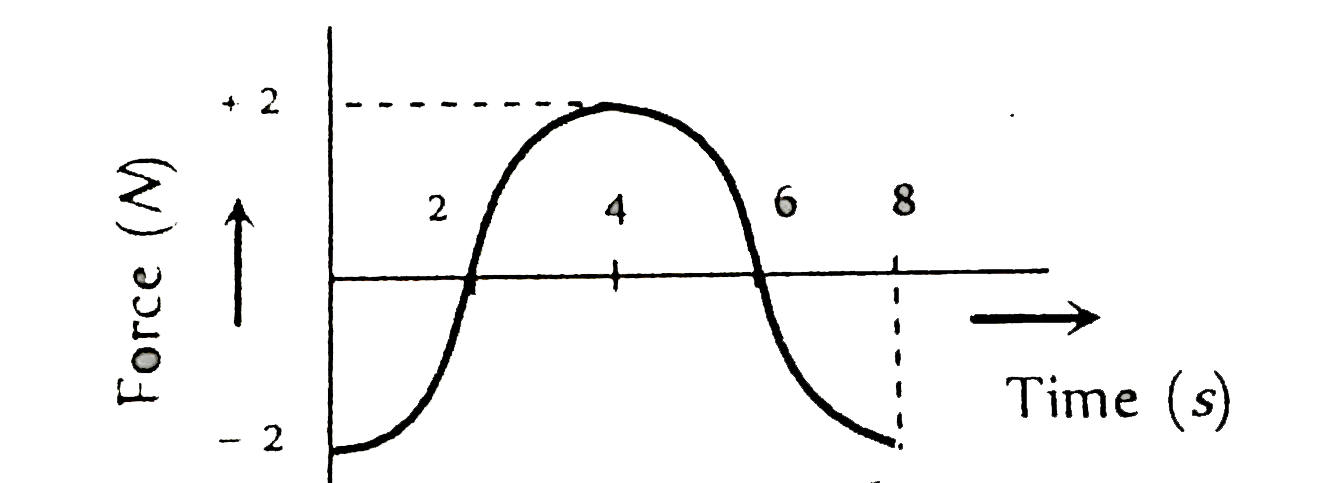 A−2 N-sB+4 N-sC6 N-sDZero
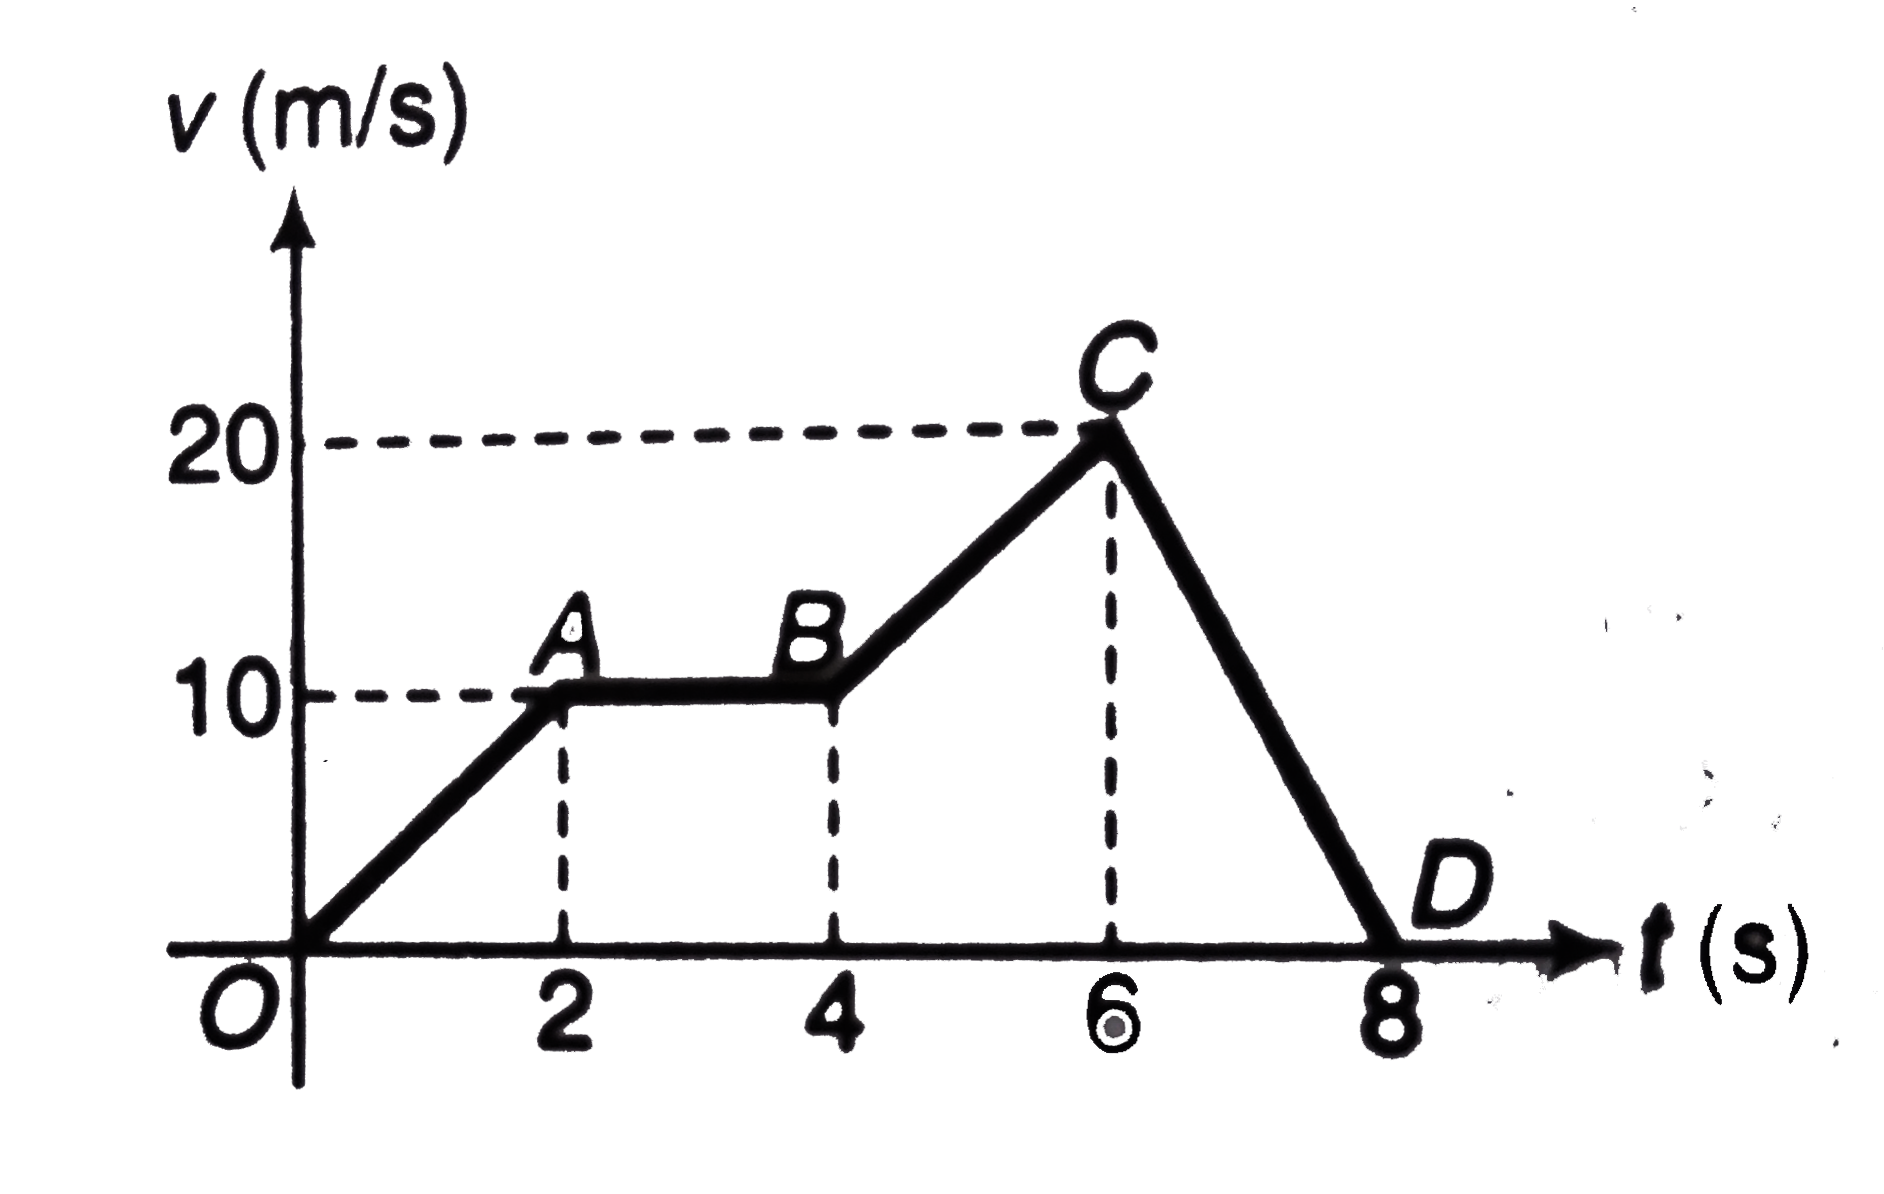
Velocity-time graph of a particle moving in a straight line is shown in figure. Plot the corresponding displacement-time graph of the particle if at time t=0, displacement s=0.
 View Solution
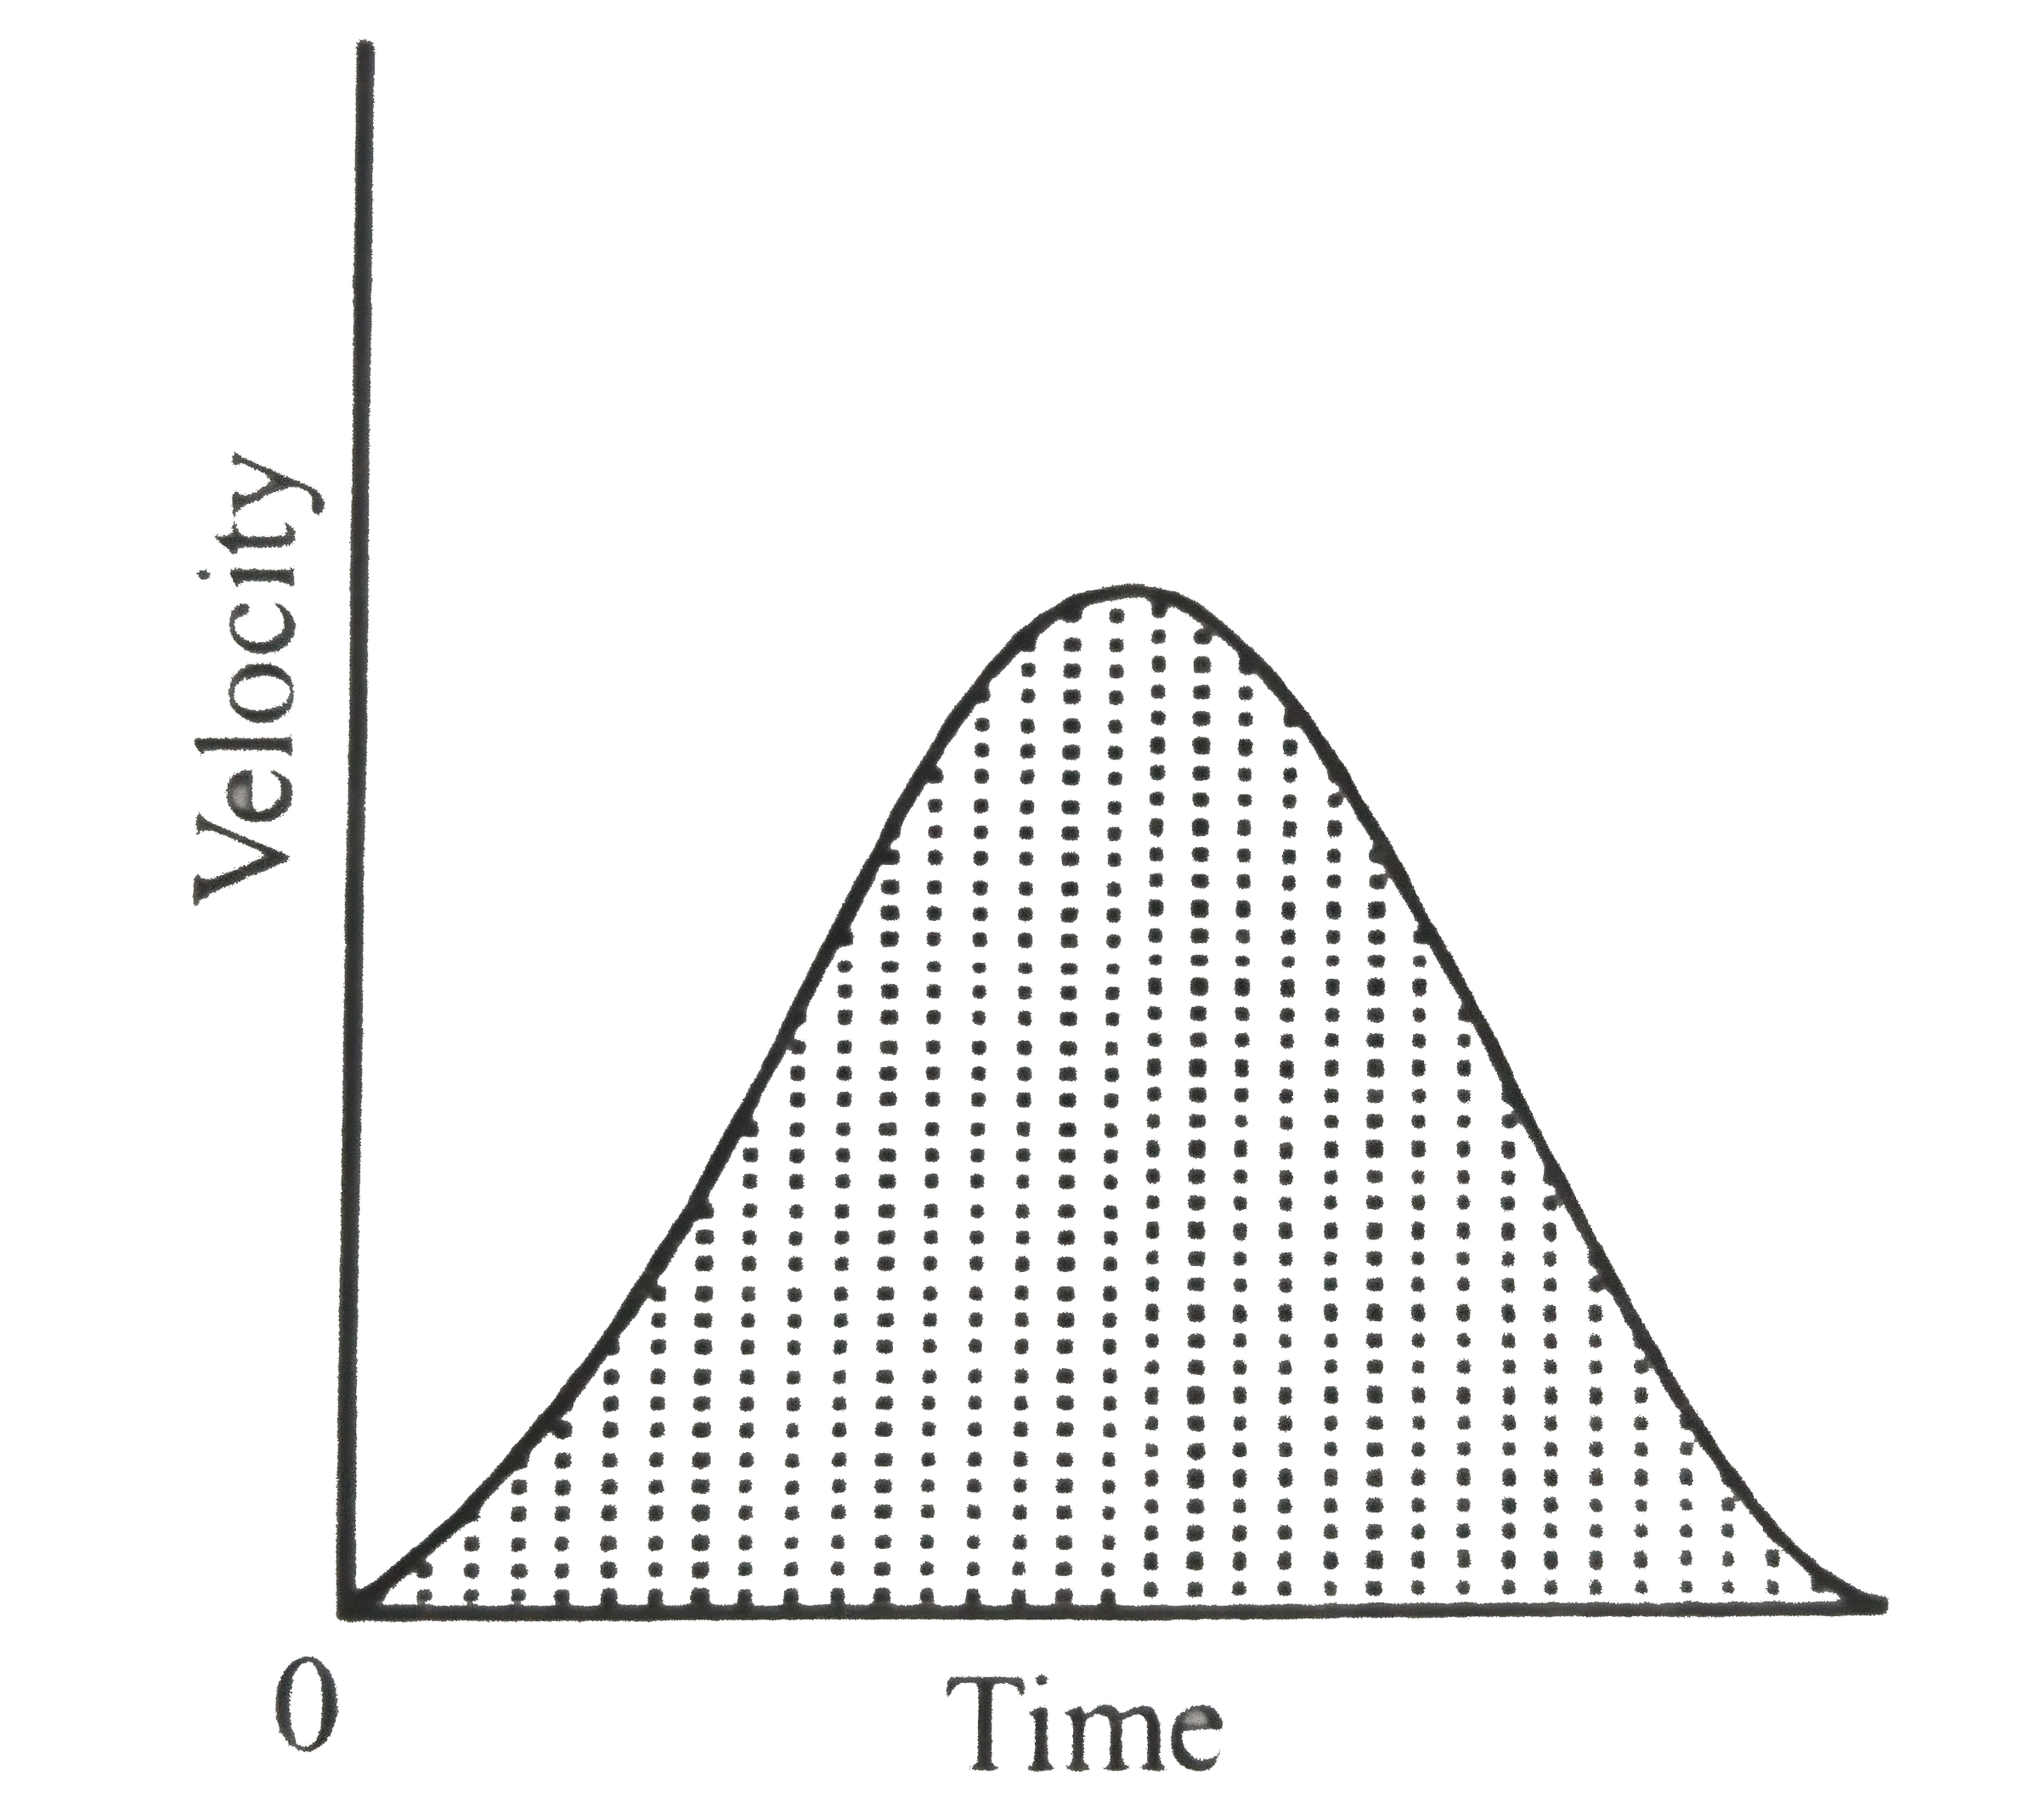
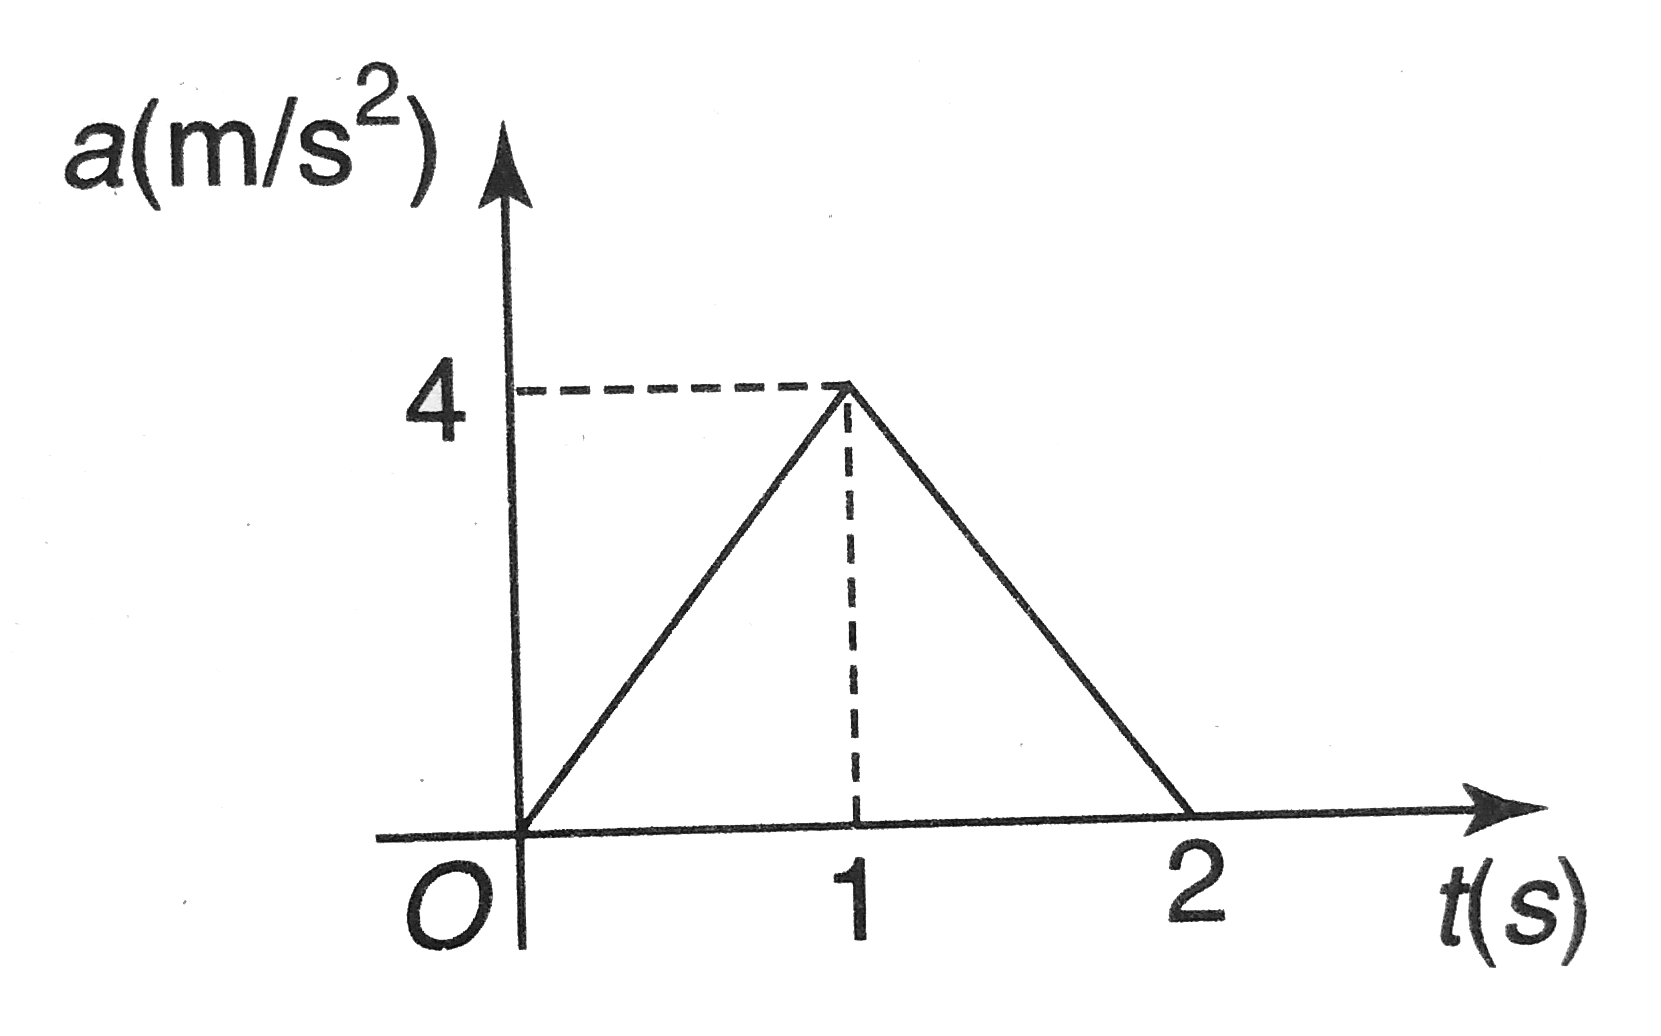
Which one of the following characteristics of the particle does the shaded area of the velocity-time graph shown above represent?View SolutionThe acceleration-time graph of a particle moving in a straight line is as shown in figure. The velocity of the particle at time t=0 is 2m/s. The velocity after 2 seconds will be
 View Solution
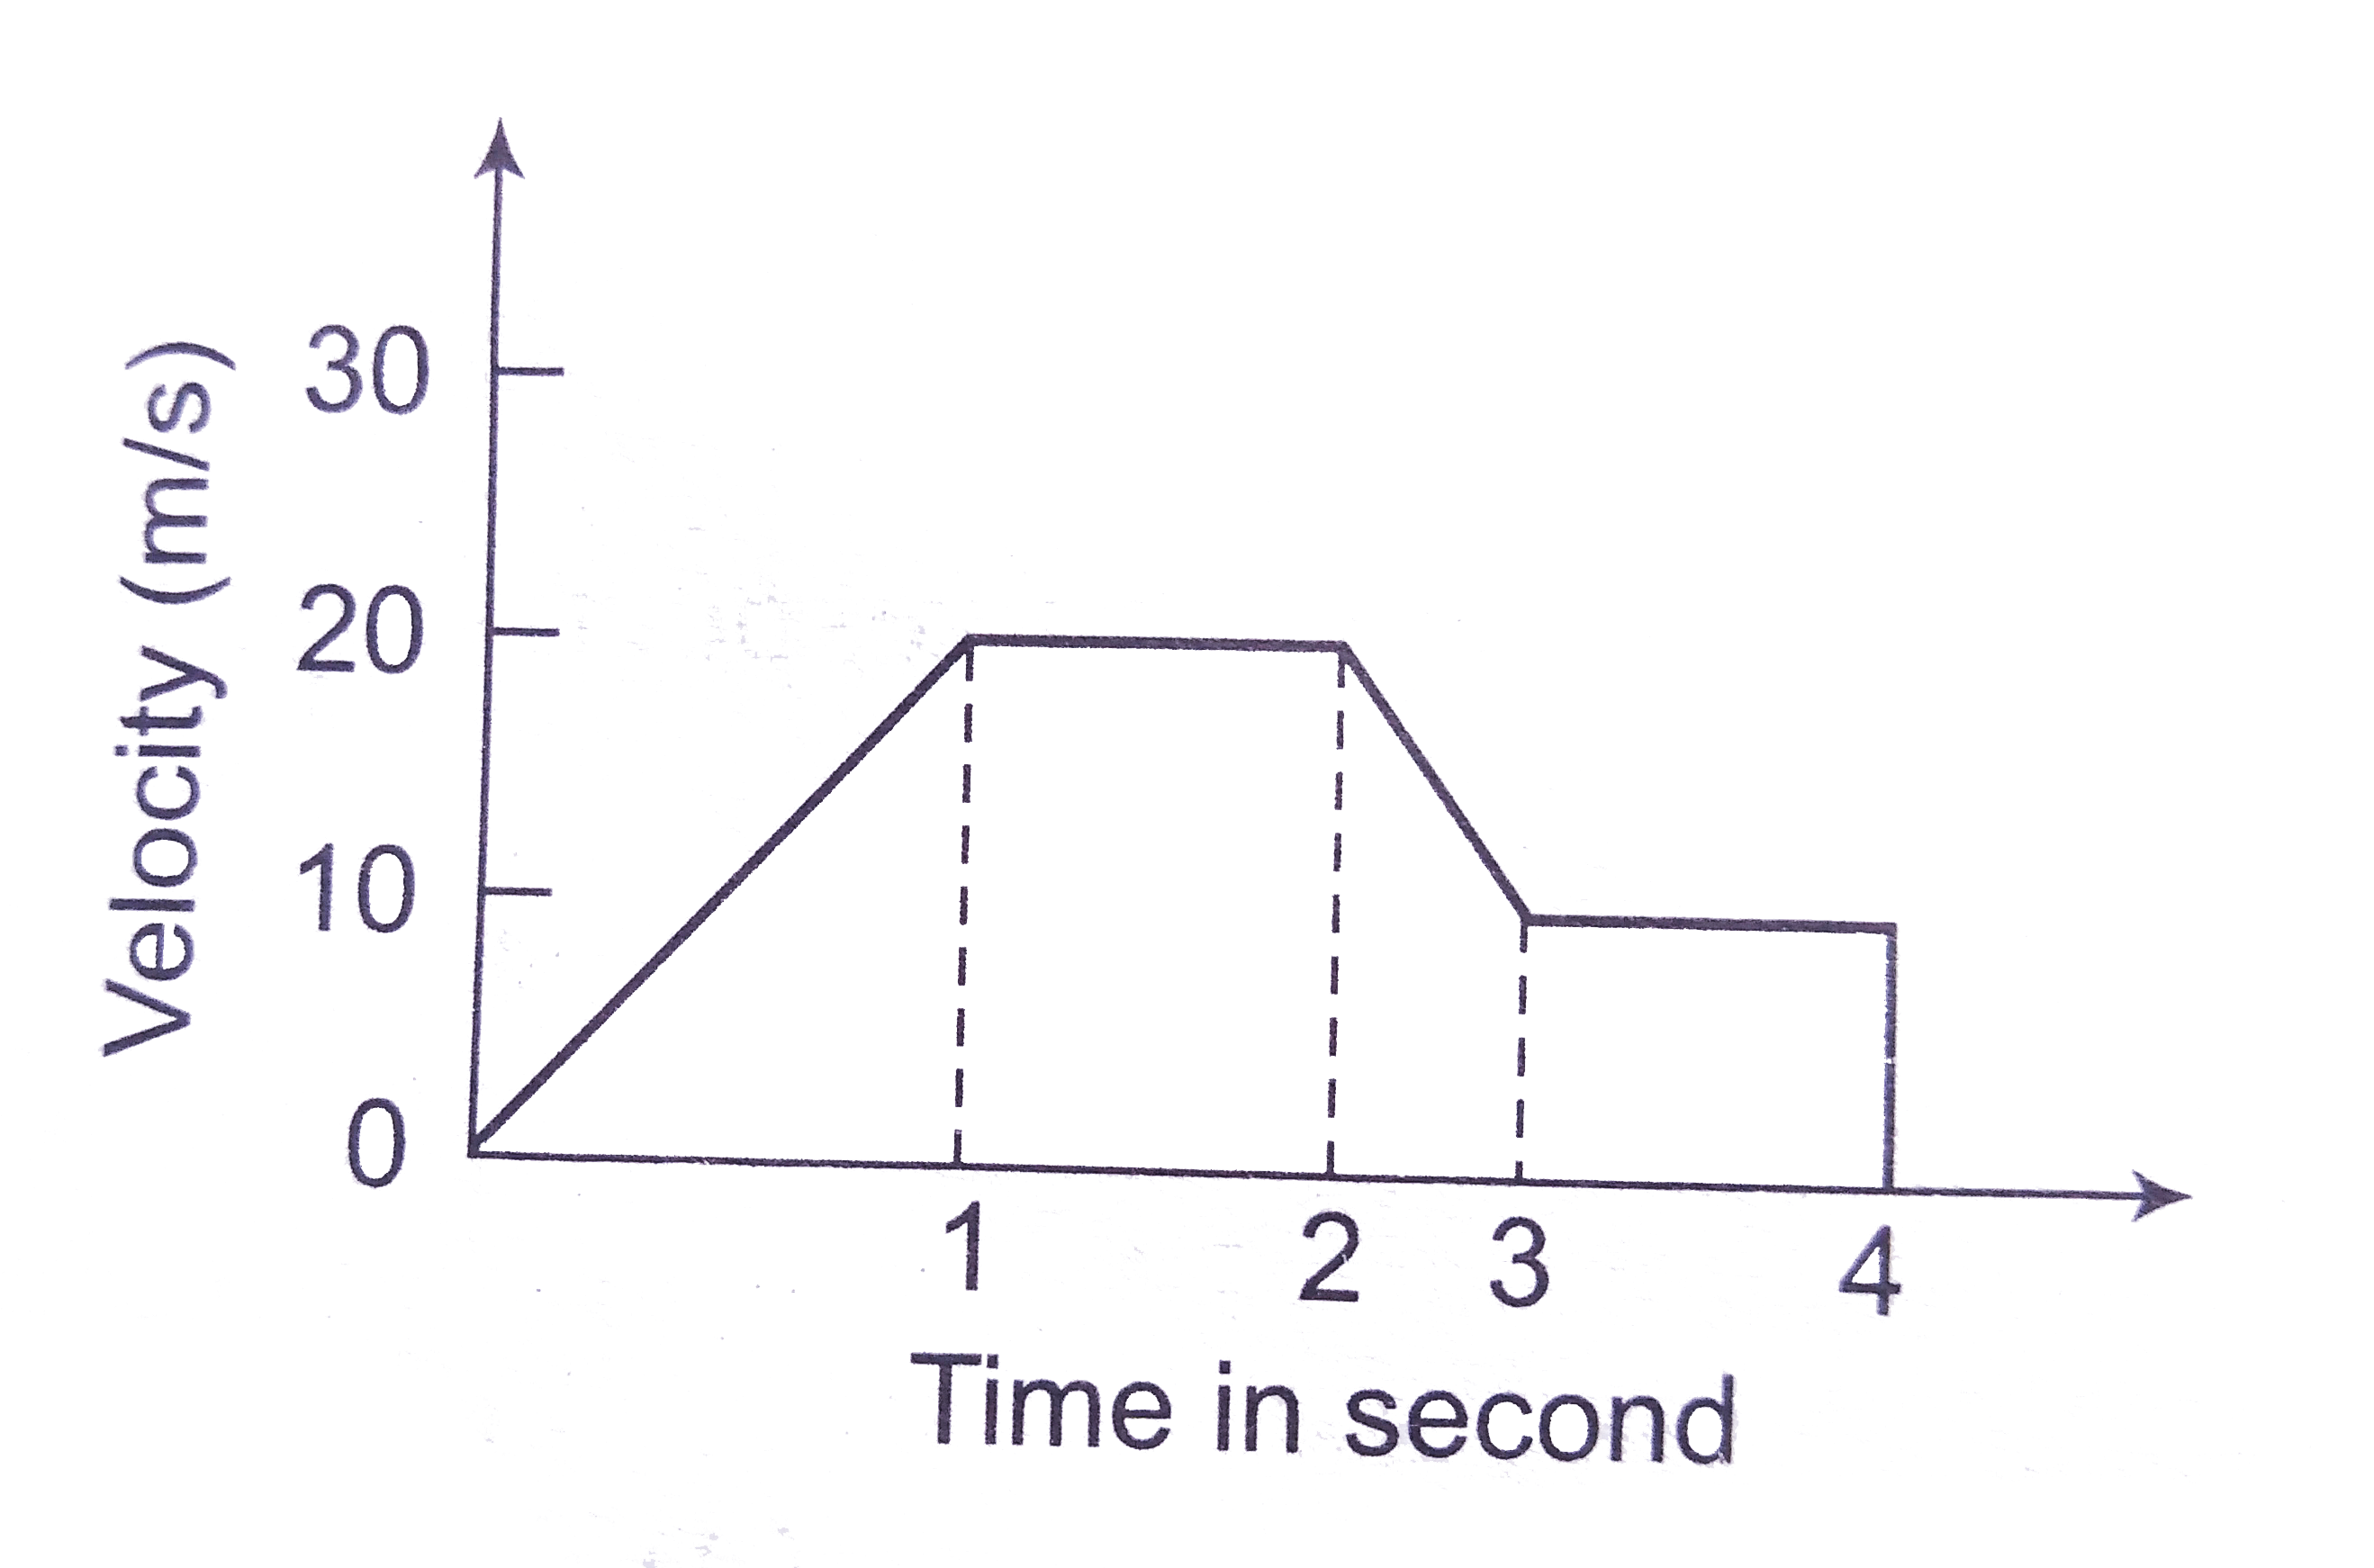
The variation of velocity of a particle with time moving along a straight line is illustrated in the following figure. The distance travelled by the particle in four seconds is.
 View Solution
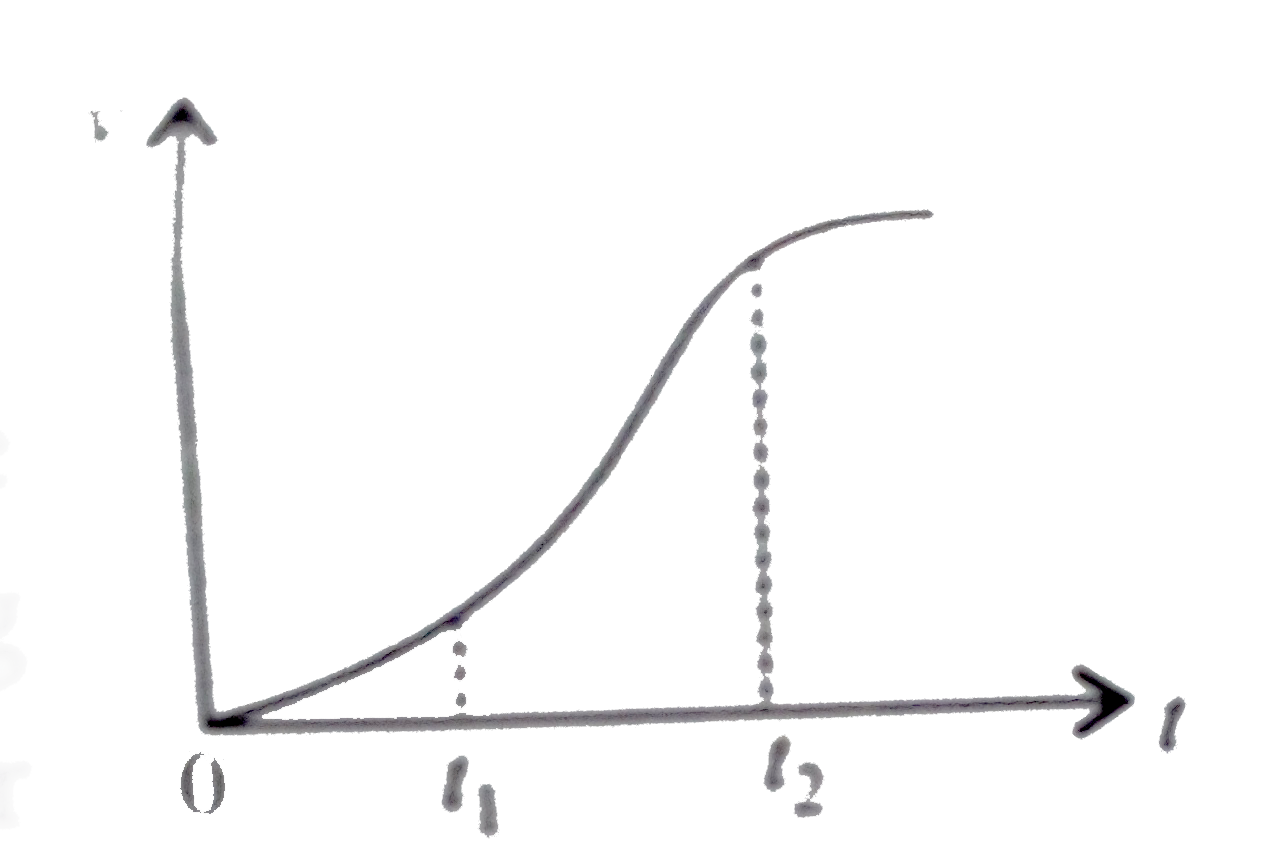
The velocity-time graph of a particle in one-dimensional motion is shown in the figure. Which of the following formulae is correct for describing the motion of the particle over the time interval t1 to t2?
 View Solution

