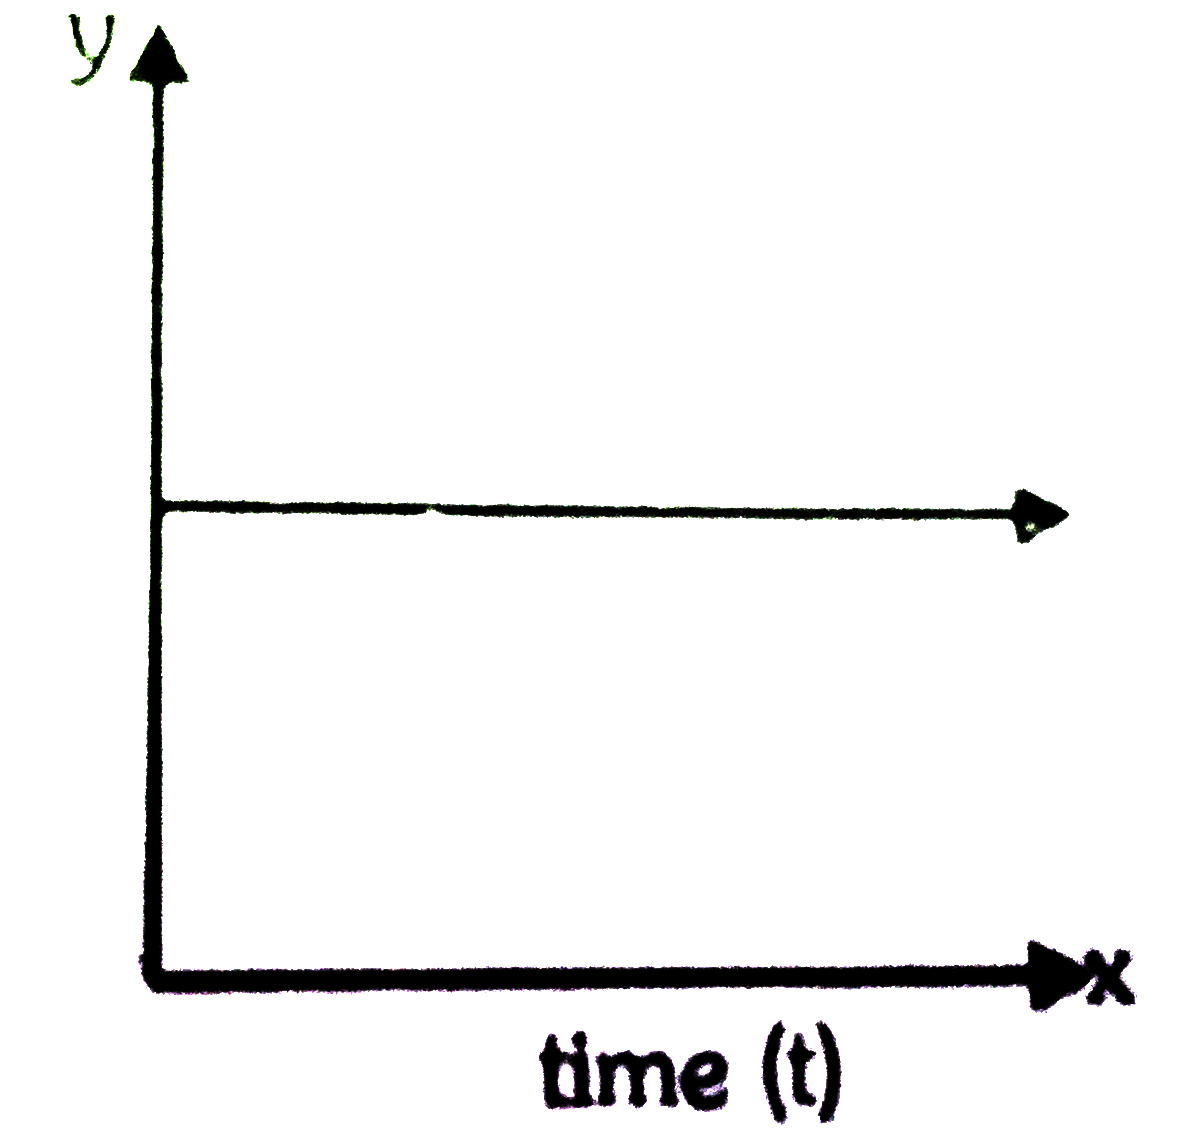
In the graph shown in fig. the time is plotted along x-axis. Which quantity associated with the projectile motion is plotted along the y -axis:-

kinetic energy
momentum
horizontal velocity
none of the above
The correct Answer is:C
Horizontal component of velocity remain same.
Topper's Solved these Questions
- BOOK - ALLENCHAPTER - MOTION IN A PALNEEXERCISE - EXERCISE-341videos
MOTION IN A PALNE
- BOOK - ALLENCHAPTER - MOTION IN A PALNEEXERCISE - SOLVED EXAMPLE28videos
MOTION IN A PALNE
- BOOK - ALLENCHAPTER - MOTION IN A PALNEEXERCISE - EXERCISE-199videos
MOTION IN A PALNE
- BOOK - ALLENCHAPTER - KINEMATICS-2DEXERCISE - Exercise (O-2)48videos
KINEMATICS-2D
- BOOK - ALLENCHAPTER - NEWTON'S LAWS OF MOTION & FRICTIONEXERCISE - EXERCISE (JA)4videos
NEWTON'S LAWS OF MOTION & FRICTION
Similar Questions
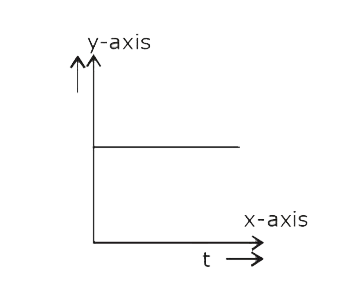
In the graph shown in figure, which quantity associated with projectile motion is plotted along y-axis ?
 View Solution
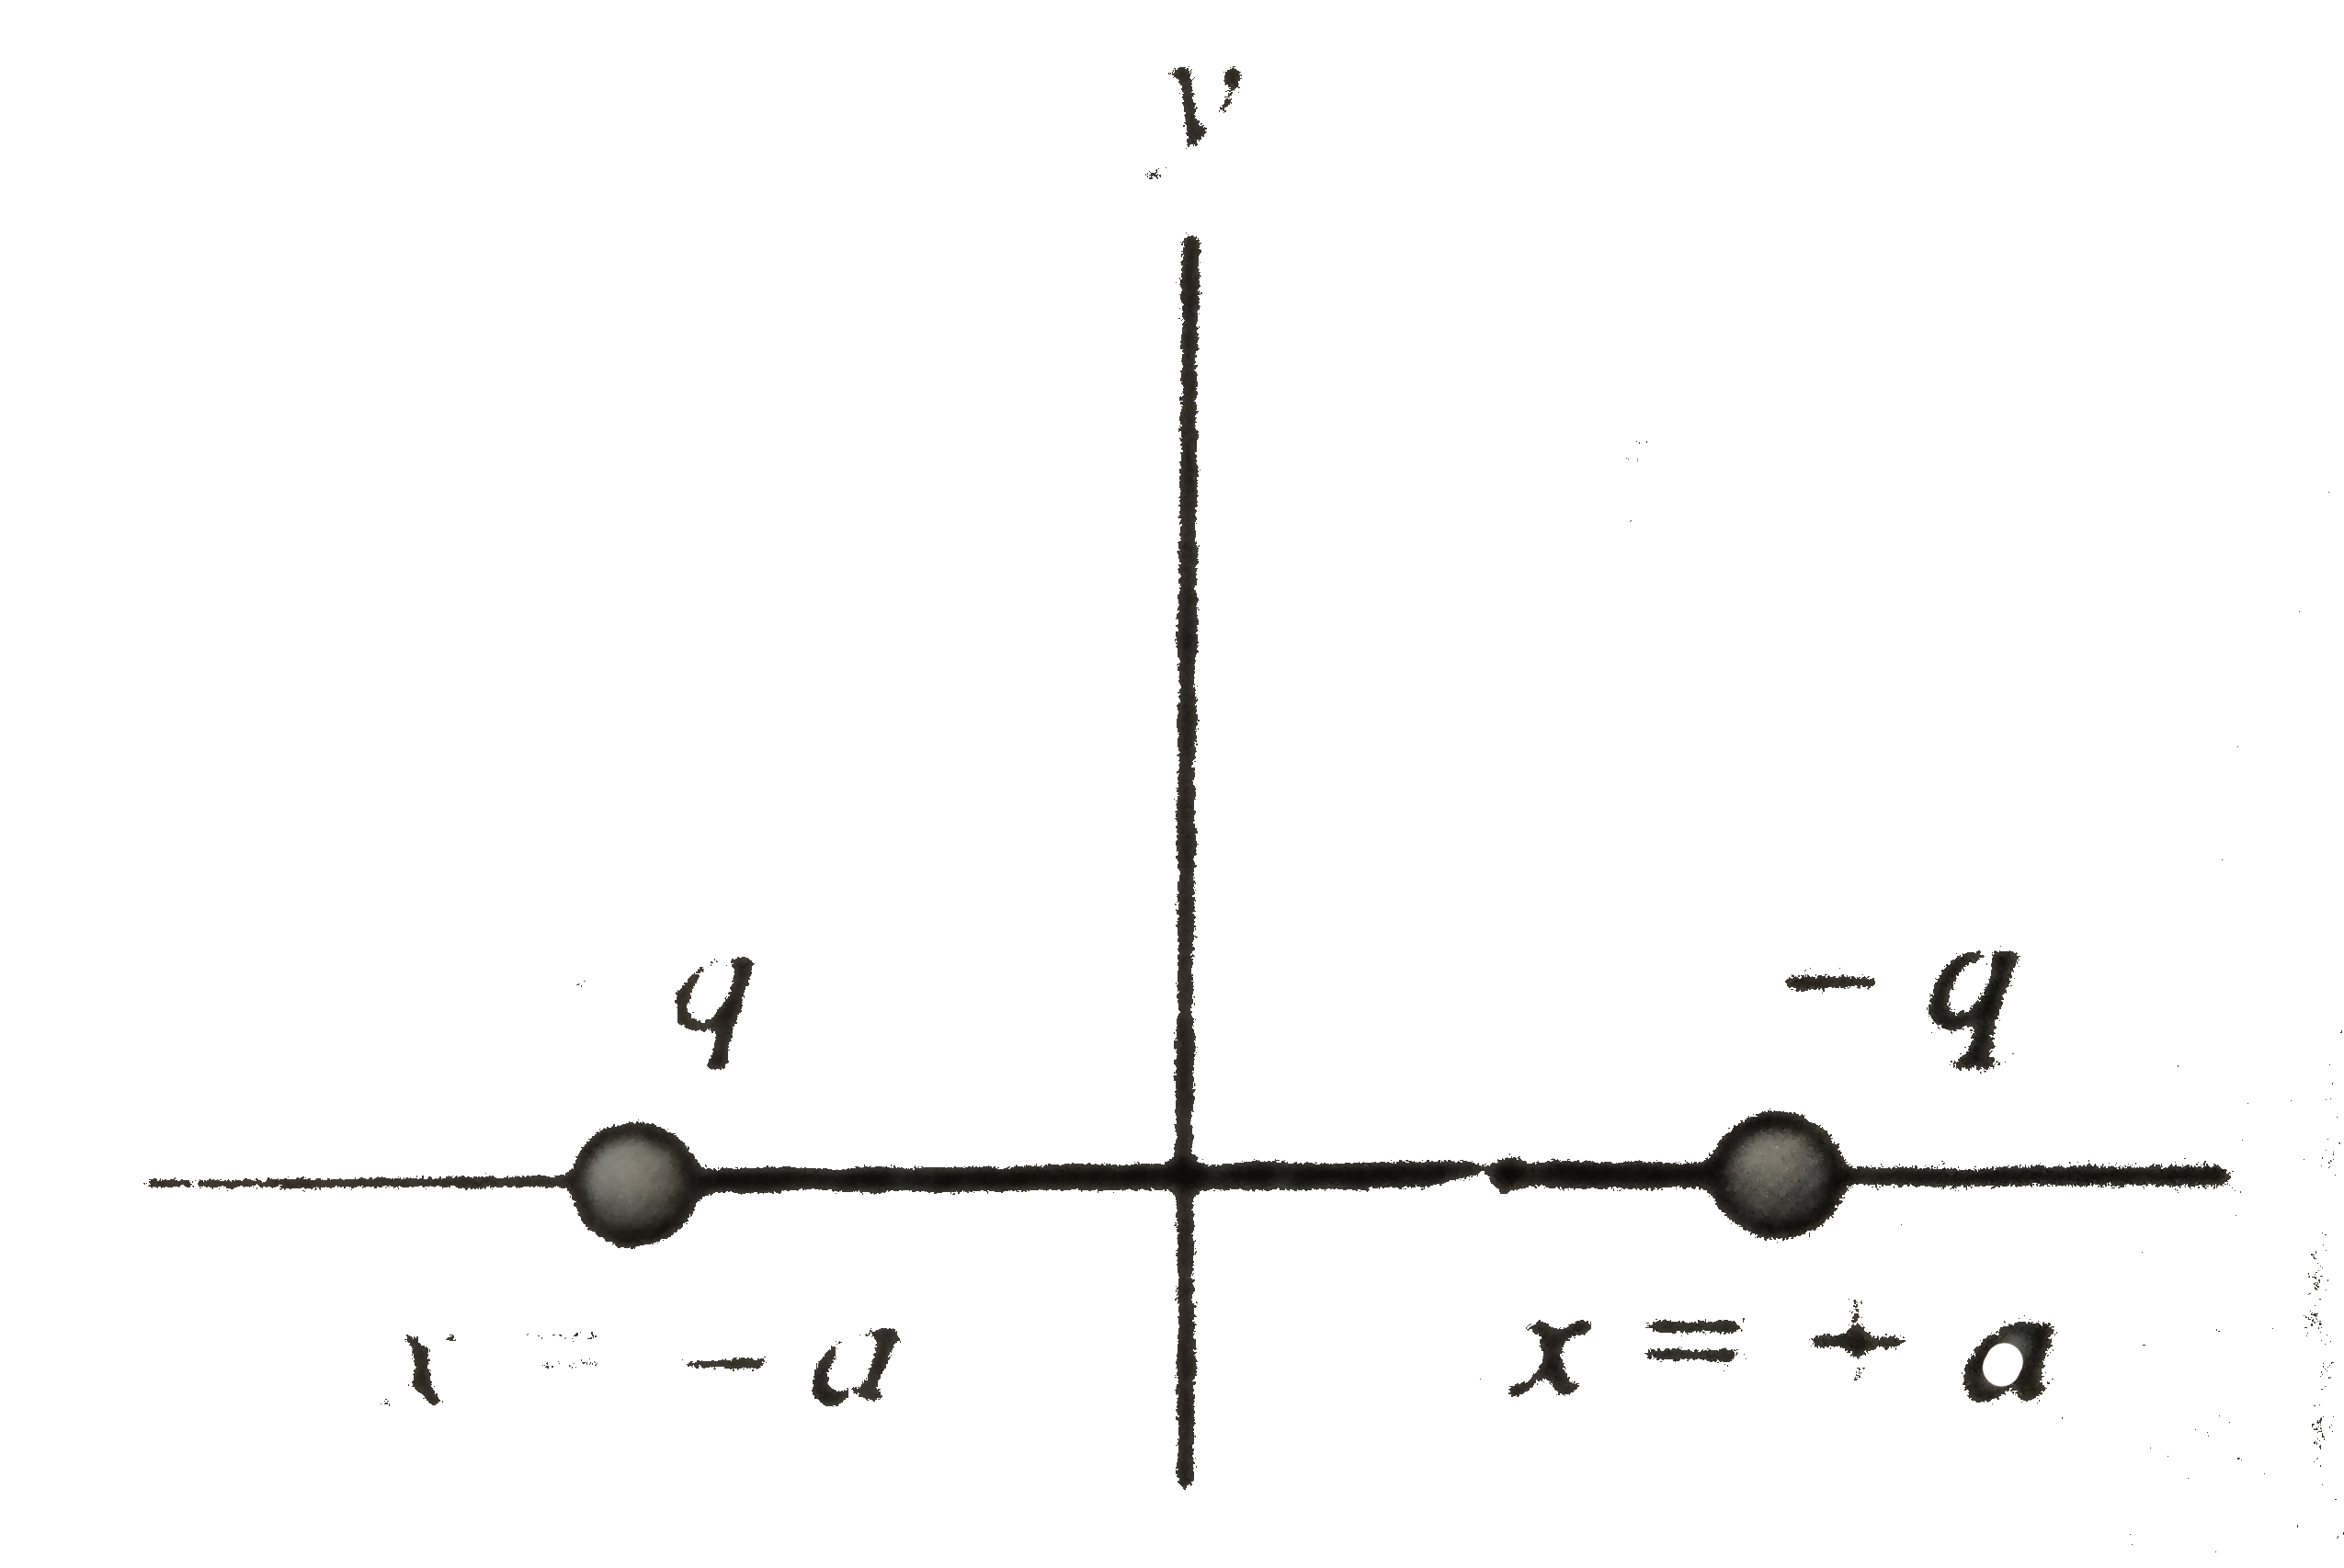
Two point charge ±q are placed on the axis at x=−a and x=±a, as shown in fig.
(i) Plot the variation of E along the x-axis.
(ii) Plot the variation of E along the y-axis.
 View Solution
Knowledge Check
- Question 1 - Select One
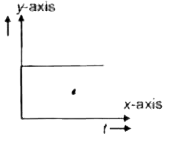
In the graph shown in figure, which quanitity associated with projectile motion is plotted along y-axis ?
 AKinetic energyBMomentumCHorizontal velocityDNone of these
 - Question 2 - Select One
Which quantity associated with the projectile motion remains constant during entire motion?
Akinetic energyBmomentumChorizontal velocityDvertical velocity - Question 3 - Select One
In case of a simple harmonic motion, if the velocity is plotted along the X-axis and the displacement (from the equilibrium position) is plotted along the Y-axis, the resultant curve happens to be an ellipse with the ratio =major axis along Xminor axis along Y=20π
What is the frequency of the simple harmonic motion?A100 HzB20 HzC10 HzD110Hz
A 2.00 kg particle moves along an x axis in onedimensional motion while a conservative force along that axis acts on it. The potential energy U(x) associated with the force is plotted in Fig. 8-36a. That is, if the particle were placed at any position between x=0 and x=7.00m, it would have the plotted value of U. At x=6.5m, the particle has velocity →v0=(−4.00m/s)ˆi.
(a) Form Fig. 8-36a, determine the particle's speed at x1=4.5m.View SolutionIn case of a simple harmonic motion, if the velocity is plotted along the X-axis and the displacement (from the equilibrium position) is plotted along the Y-axis, the resultant curve happens to be an ellipse with ratio:
major axis(along X)major axis (along Y)=20π
What is the frequency of the simple harmonic motion ?View SolutionIf a graph is plotted taking the temperature in Fahrenheit along the Y-axis and the corresponding temperature in Celsius along the X-axis, it will be a straight line
View SolutionIf a graph is plotted taking the temperature in fahrenheit along the Y- axis and the corresponding temperature in celsins along X - axis it will be straight line
View SolutionIn a graph of population, on x-axis time and on y-axis population is plotted. A parallel line to x-axis shows:
View Solution
