If a graph is plotted taking the temperature in fahrenheit along the Y- axis and the corresponding temperature in celsins along X - axis it will be straight line
having a positive intercept on the Y- axis
having a positive intercept on X- axis
passing through origin
having negative intercepts on both the axis
The correct Answer is:A
Similar Questions
A graph is drawn between centigrade temperatures of a body along x-axis and corresponding Fahrenheit temperatures along y-axis. Slope of the graph is
View SolutionA graph is plotted by taking pressure along y-axis and centigrade temperature along X-axis for an ideal gas at constant volume. x intercept of the graph is
View Solution
Knowledge Check
If a graph is plotted taking the temperature in Fahrenheit along the Y-axis and the corresponding temperature in Celsius along the X-axis, it will be a straight line
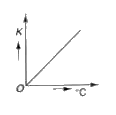
Ahaving a positive intercept on the Y-axisBhaving a positive intercept on the X-axisCpassing through the originDhaving a negative intercepts on both the axisA graph was plotted taking the temperature in .∘C along the X-axis and the corresponding temperature in Kelvin along the Y-axis. Which of the curves in Fig, 6.1 most correctly represents this behaviour?
A B
B C
C D
D
A graph is plotted taking .∘C along the Y-axis and .∘F along the X-axis. It is a/an
AparabolaBstraight lineCellipseDcircle
A graph is plotted by taking pressure along y-axis and centigrade temperature along X-axis for an ideal gas at constant volume. x intercept of the graph is
View SolutionIf a graph is plotted by taking spectral emissive power along y-axis and wavelength along X-axis then the area below the graph above wavelength axis is
View SolutionIf a graph is plotted by taking spectral emissive power along y-axis and wavelength along X-axis then the area below the graph above wavelength axis is
View SolutionA graph is plotted taking ∘––C along the Y - axis and of along the X - axis .It is a /an
View SolutionIf a cooling curve is drawn taking t(s) along X−axis and temperature (θ) along Y−axis, it appers as
View Solution
