Which of the following plots may represent the reactance of a series LC combination?
(##HCV_VOL2_C39_E01_020_Q01##)
Step by step video & image solution for Which of the following plots may represent the reactance of a series LC combination? (##HCV_VOL2_C39_E01_020_Q01##) by Physics experts to help you in doubts & scoring excellent marks in Class 12 exams.
Updated on:21/07/2023Topper's Solved these Questions
- ALTERNATING CURRENTBOOK - RESONANCECHAPTER - ALTERNATING CURRENTEXERCISE - Exercise -1 Part-1
63 Videos
- ALTERNATING CURRENTBOOK - RESONANCECHAPTER - ALTERNATING CURRENTEXERCISE - Exercise -2 Part-1
14 Videos
- ALTERNATING CURRENTBOOK - RESONANCECHAPTER - ALTERNATING CURRENTEXERCISE - HIGH LEVEL PROBLEMS
11 Videos
- ATOMIC PHYSICSBOOK - RESONANCECHAPTER - ATOMIC PHYSICSEXERCISE - Advanved level problems
17 Videos
Similar Questions
Knowledge Check
Which of the following plots may represent is impedence of a series LCR combination?
A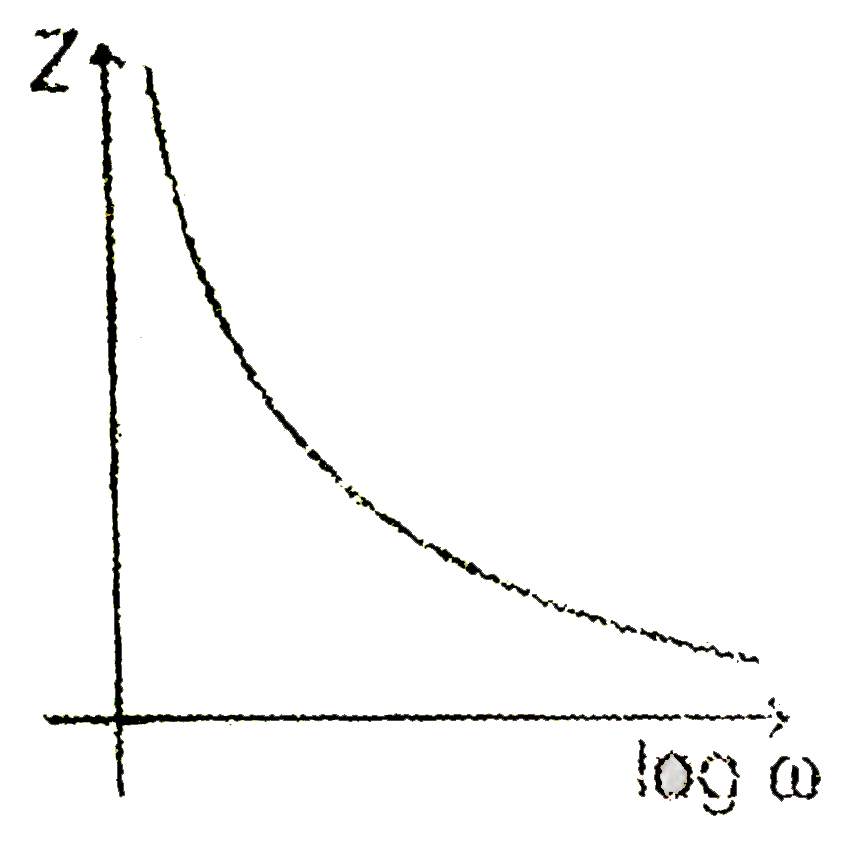 B
B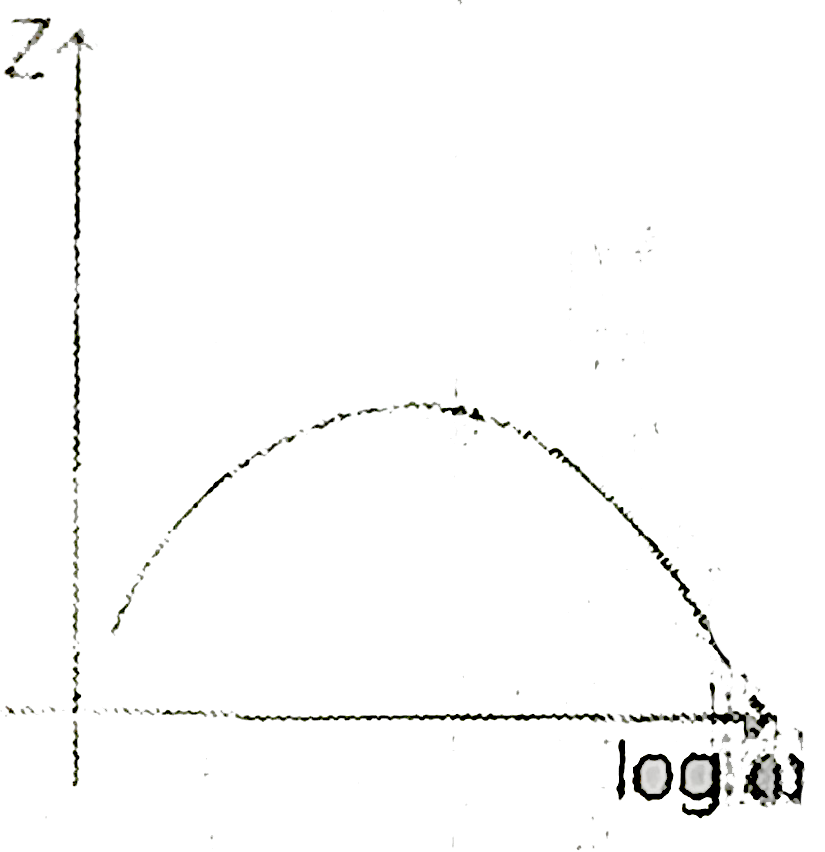 C
C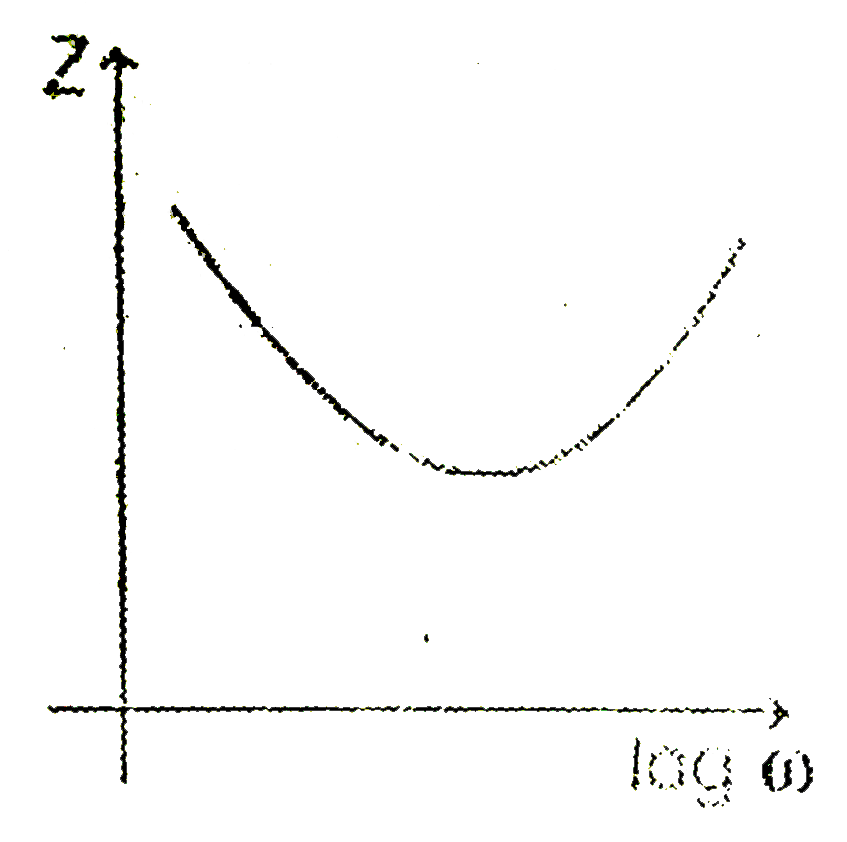 D
D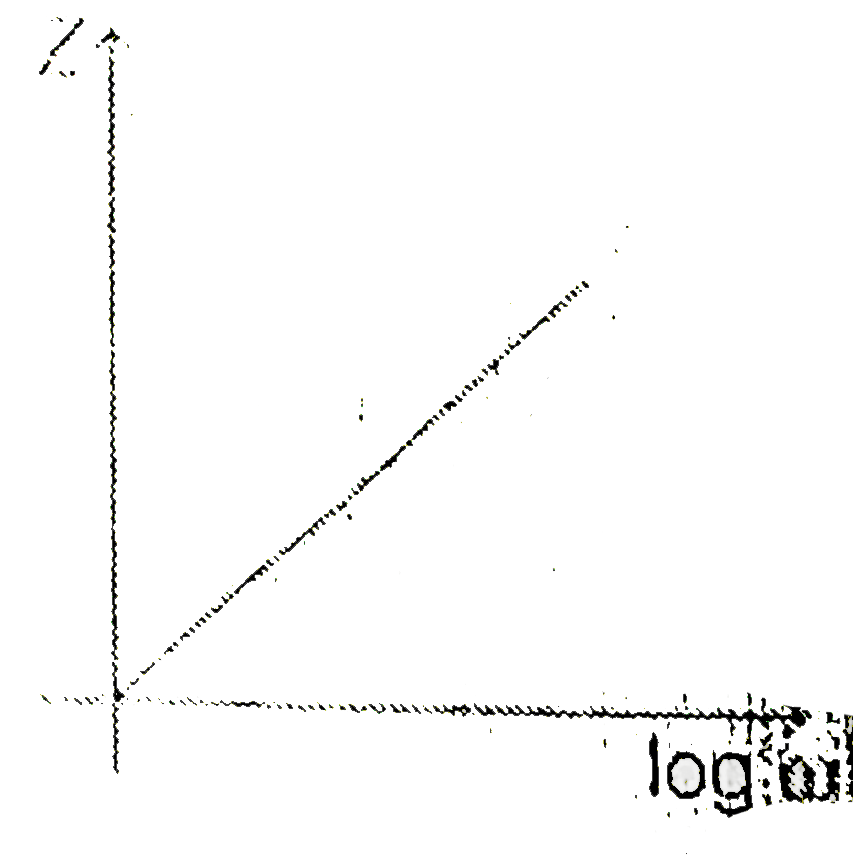
Which of the shown graphs may represent the reactance of a series L-C combination?
A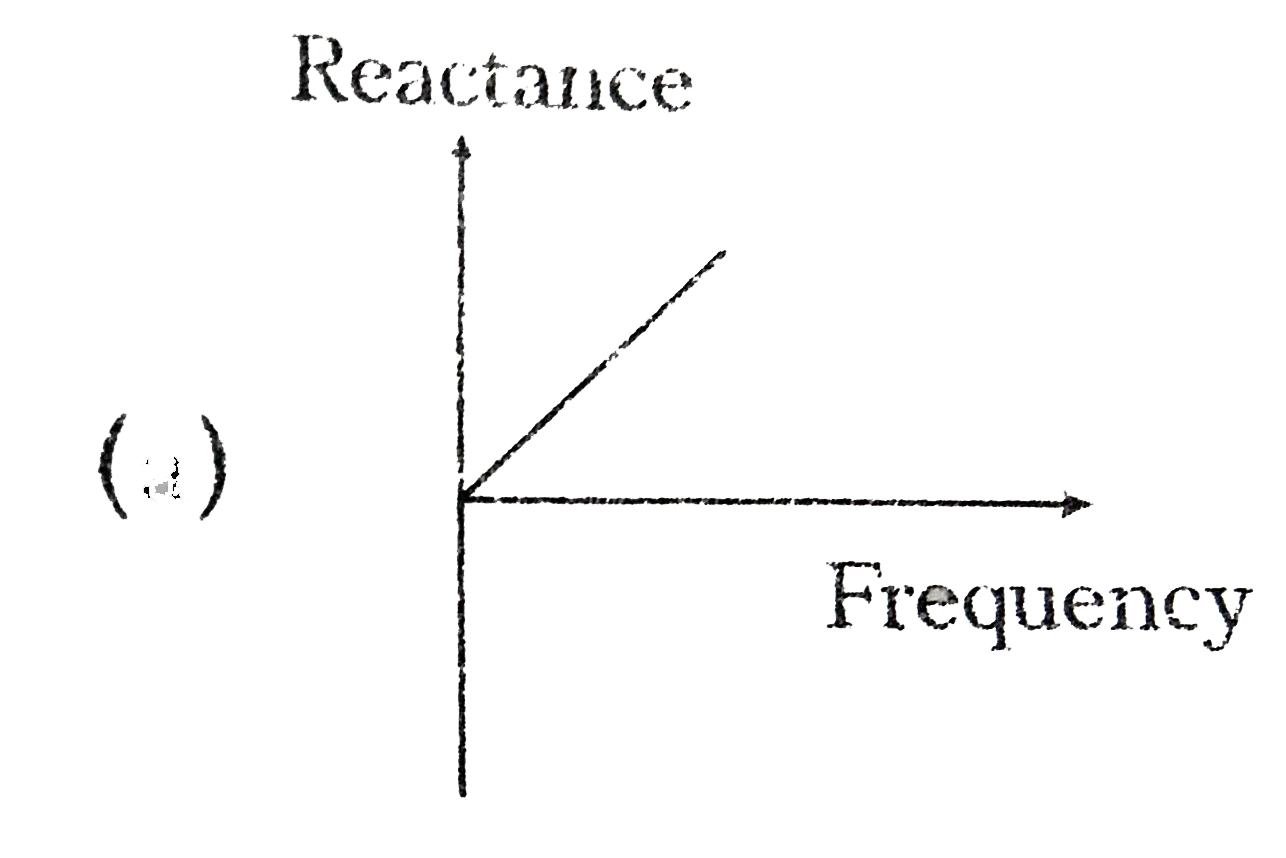 B
B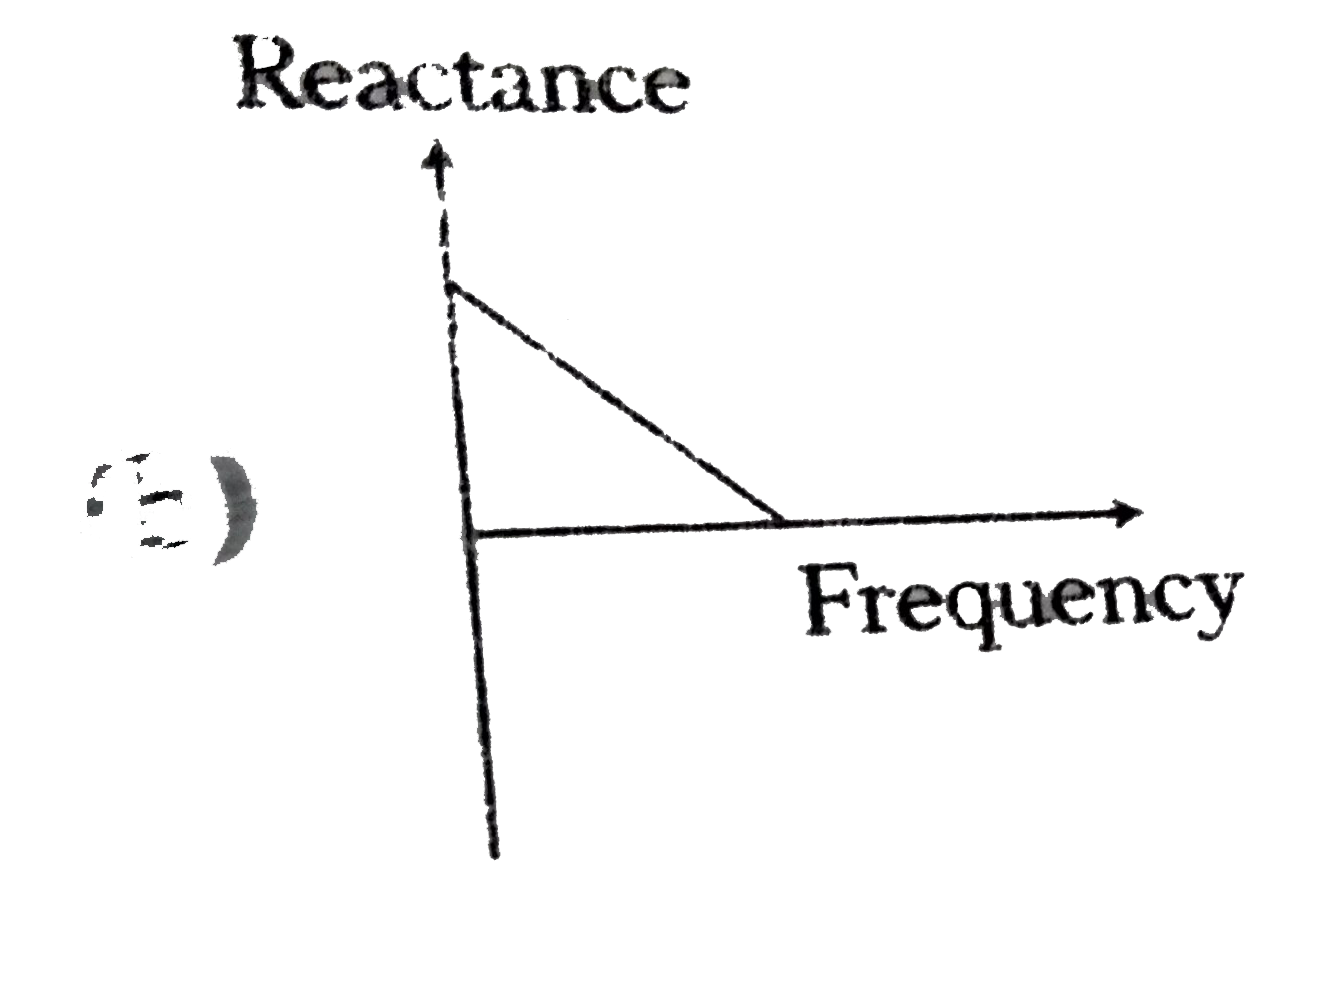 C
C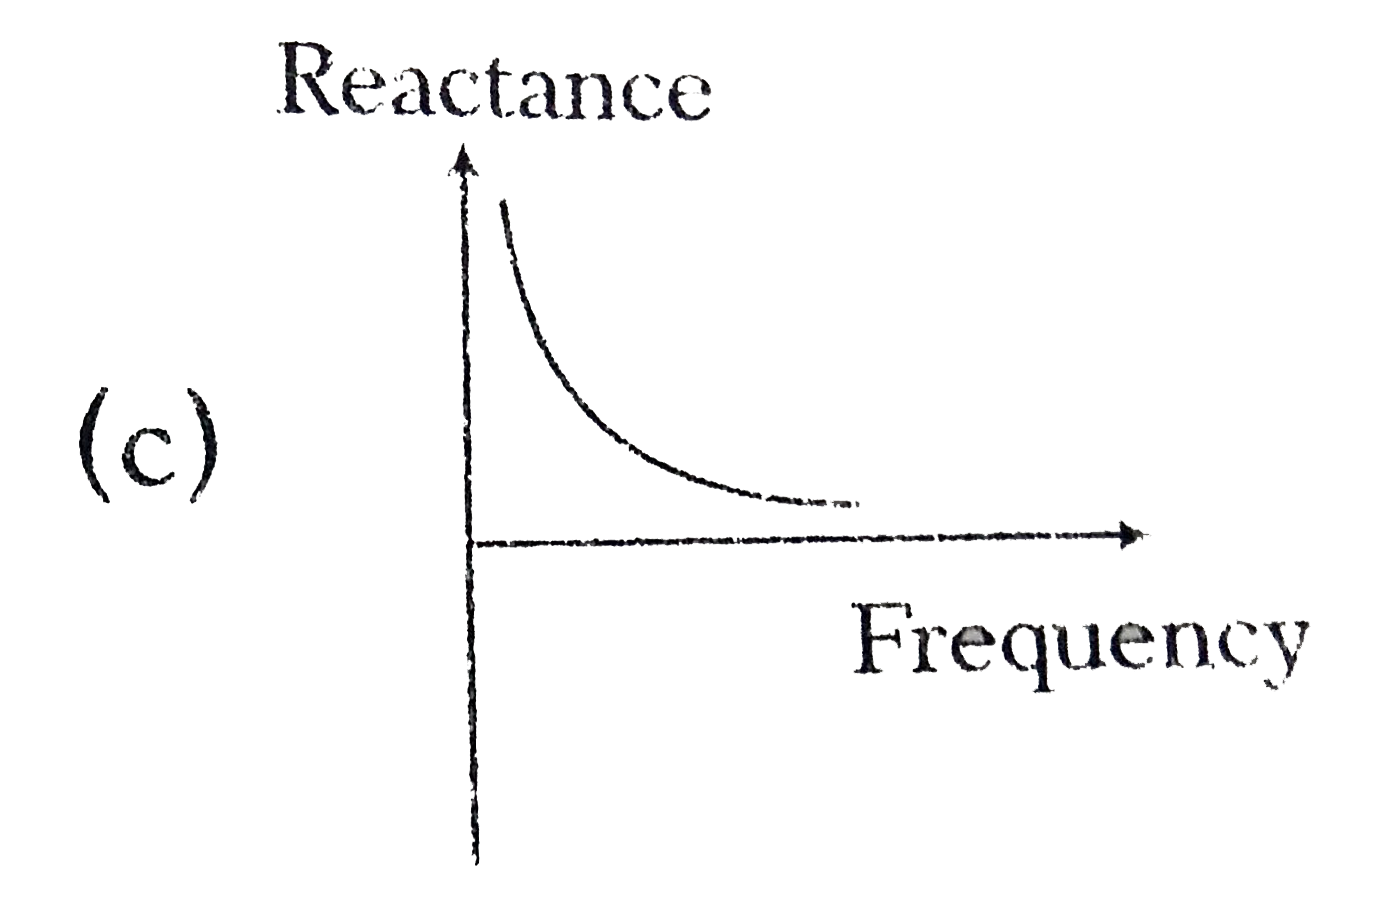 D
D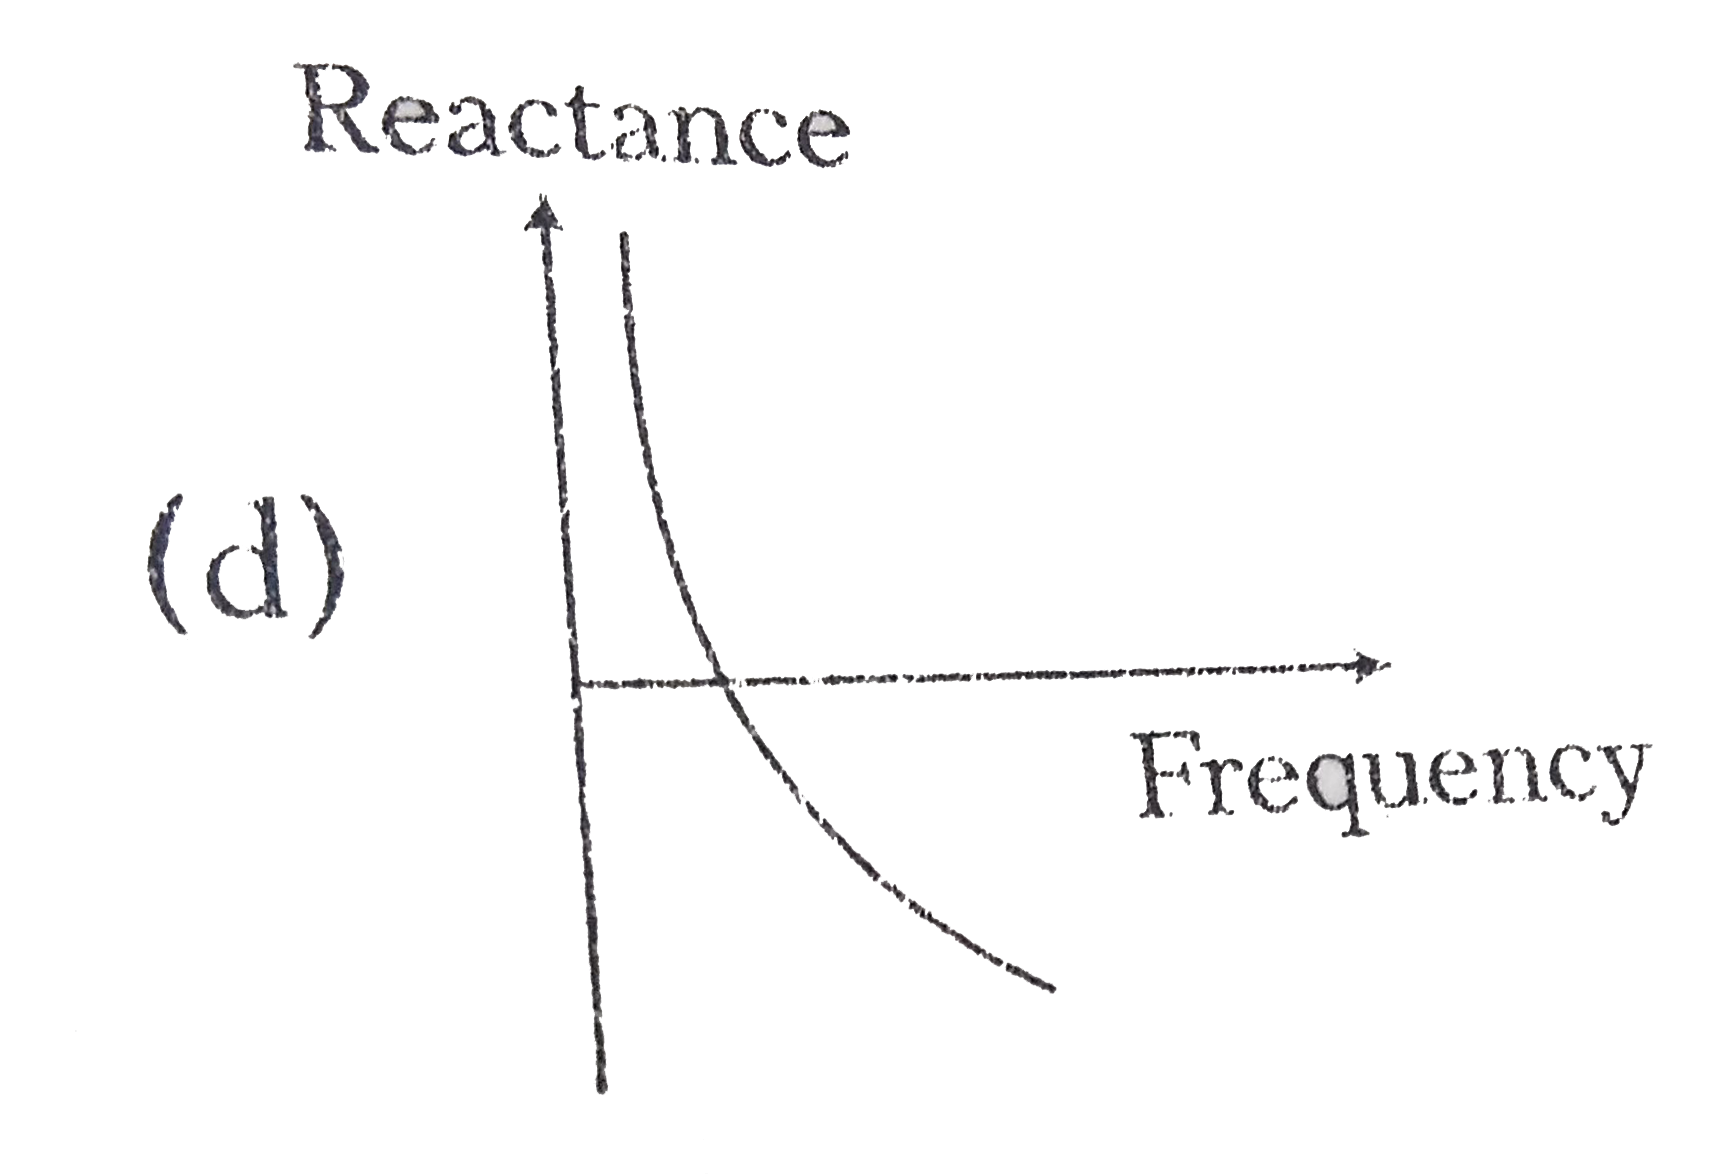
Which of the following represents the anomer of the compound shown?
(##MTG_NEET_GID_CHE_XII_C14_E02_009_Q01.png" width="80%">A B
B C
C DNone of these
In the given figure, which of the following is correct ( O is the centre of circle)?
(##CEN_JEE_MAT_X_C13_E01_017_Q01.png" width="80%">
View SolutionMatch the following and choose the correct combination from the options given :
(GRBOBJBIOIINDC56E01305_Q01)
View SolutionThe given figure represents the plant body of Funaria. Idenrtify A-D
(##ARH_NEET_BIO_V01_C07_E02_041_Q01##)
View SolutionMatch the following quantum numbers with the information associated with them. Select the correct codes from the given options.
(##AHT_PGT_CHE_C03_E01_047_Q01##)
(##AHT_PGT_CHE_C03_E01_047_Q02##)
View SolutionAmong the following , the plot that correctly represents the conductometric titration of 0.05 M H2SO4 with 0.1 M NH4OH is
View Solution

