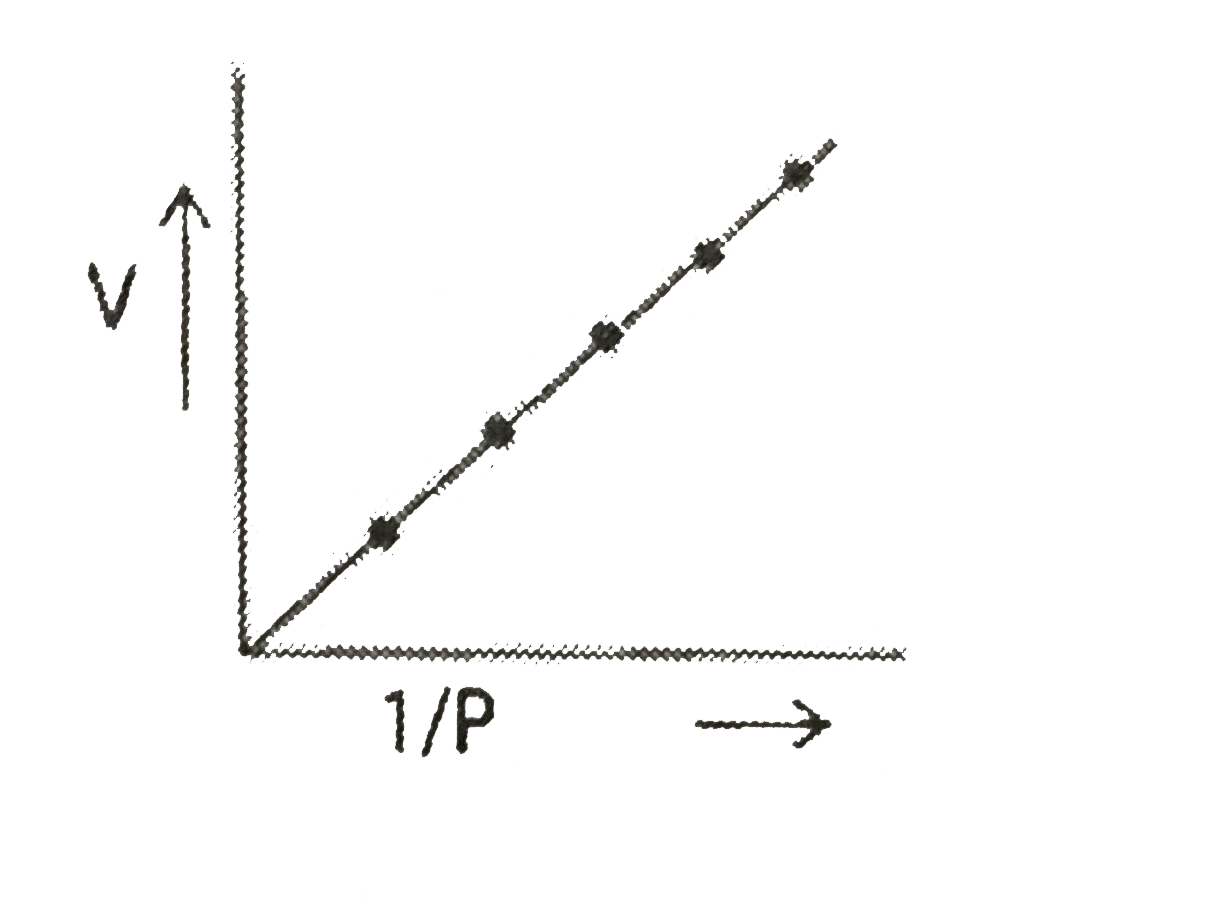
For a fixes amount of real gas when a graph of zv/s was plotted than at very high pressure slope was observed to be 0.01atm−1. At the same temperature if a graph is plotted b//w pv v//s P then for 2 moles of the gas 'Y' intercept is found to be 40 atm-litre. calculate excluded volume in litres for 20 moles of the real gas.
The correct Answer is:4
∴ very high pressure ∴ neglect (a)
∴Z=1+PbRT..(1)
comparing above equation with y=mx+c
∴M=bRT
⇒bRT=0.01 (given m=0.01)
b=0.01RT..(2)
Z=(PV)real(PV)ideal ltbr> Z=(PV)realnRT (given for n=2,PV=40)
Z=402RT
Z20RT...(3)
as, Z=1+PbRT
from equation (3)
20RT=1+PbRT..(4)
10=RT+Pb
Pb=20−RT...(5)
(PV)real=40=ZnRT=(1+Pb2RT)2RT
⇒40=(1+20−RT2RT)2RT
40=2RT+20−RT
20=RT...(6)
From (2) & (4)
b=0.01×20
b=0.2
excluded volume for 20 moles
nb=20×0.2
nb=4
Topper's Solved these Questions
- GASEOUS STATEBOOK - RESONANCECHAPTER - GASEOUS STATEEXERCISE - Exercise-2
1 Videos
- GASEOUS STATEBOOK - RESONANCECHAPTER - GASEOUS STATEEXERCISE - Exercise-3
1 Videos
- GASEOUS STATEBOOK - RESONANCECHAPTER - GASEOUS STATEEXERCISE - Exercise-1
1 Videos
- FUNDAMENTAL CONCEPTBOOK - RESONANCECHAPTER - FUNDAMENTAL CONCEPTEXERCISE - ORGANIC CHEMISTRY(Fundamental Concept )
40 Videos
- HYDROCARBONBOOK - RESONANCECHAPTER - HYDROCARBONEXERCISE - ORGANIC CHEMISTRY(Hydrocarbon)
50 Videos
Similar Questions
For a fixed amount of real gas when a graph of zv/s p was plotted than at very high pressure slope was observed to be 0.01atm−1. At the same temperature if a graph is plotted b//w pv v//s P then for 2 moles of the gas 'Y' intercept is found to be 40 atm-litre. calculate excluded volume in litres for 20 moles of the real gas.
View SolutionFor a fixed amount of a real gas when a graph of Z us P was plotted then at very high pressure slope was observed to be 0.01atm−1. At the same temperature if a graph is plotted between PV us P then for 2 moles of the gas the y intercept is found to be 40 atm-litre. Calculate excluded volume in litres for 20 moles of the real gas/
View Solution
Knowledge Check
What is the nature of graph of PV versus P for a given mass of a gas at constant temperature?
AParallel to X-axisBParallel to Y-axisCLinear with positive slopeDLinear with negative slopeIf a graph is plotted between log V and log T for 2 moles of a gas of constant pressure of 0.0821 atm, then which of the following statements are correct?
AThe curve is straight line with slope -1.BThe curve is straight line with slope +1CThe intercept on y-axis is equal to 2.DThe intercept on y-axis is equal to 0.3010.If the graph is plotted for 1 mole gas in such a way that PV is plotted against 'P', then intercept of the graph for real gas will be:
ART+Pb+aBRTCRT−Pb+aDRT+Pb+ab+a
The slope of a given straight lime graph with constant temperature is found to be 0.2 L atm at 5 atm pressure. Calculate the volume of gas at that pressure.

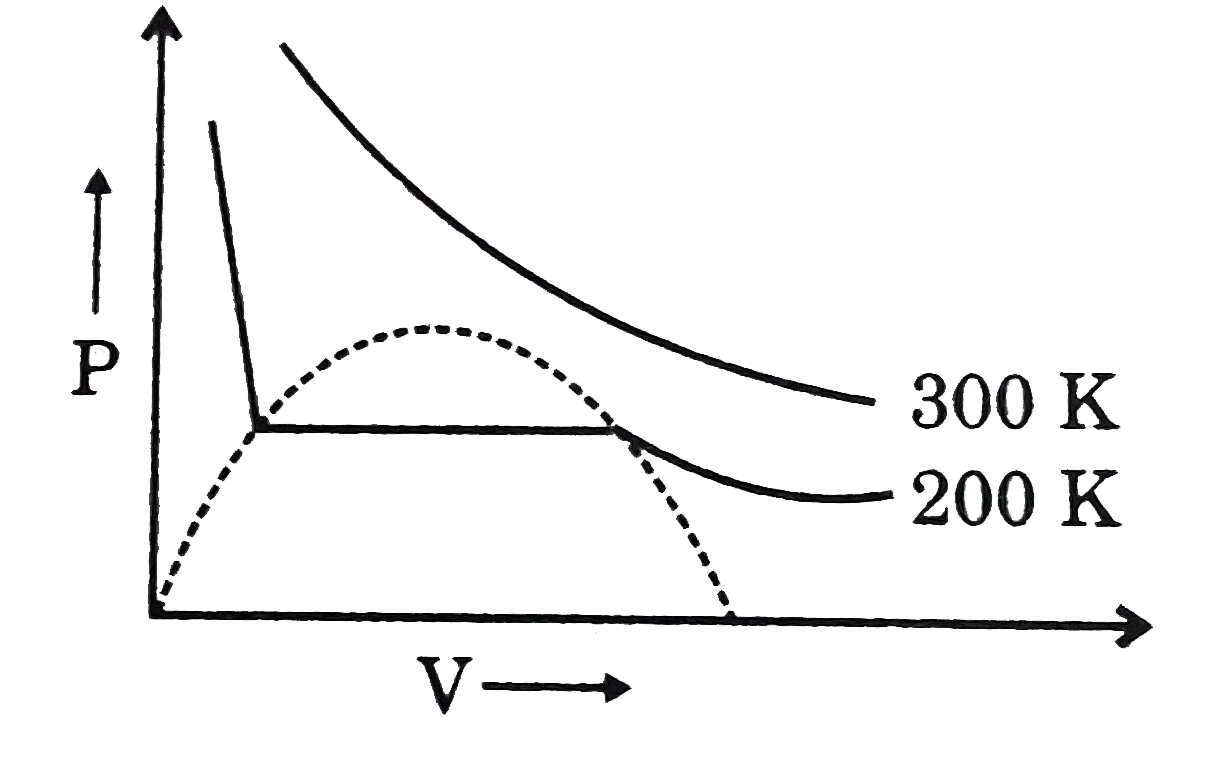
View SolutionP vs V graph is plotted for 1 mole of hypothetical gas. Range of a/b for this gas in (atm-L/mole). [R=0.08atm-litre/−mle−K]

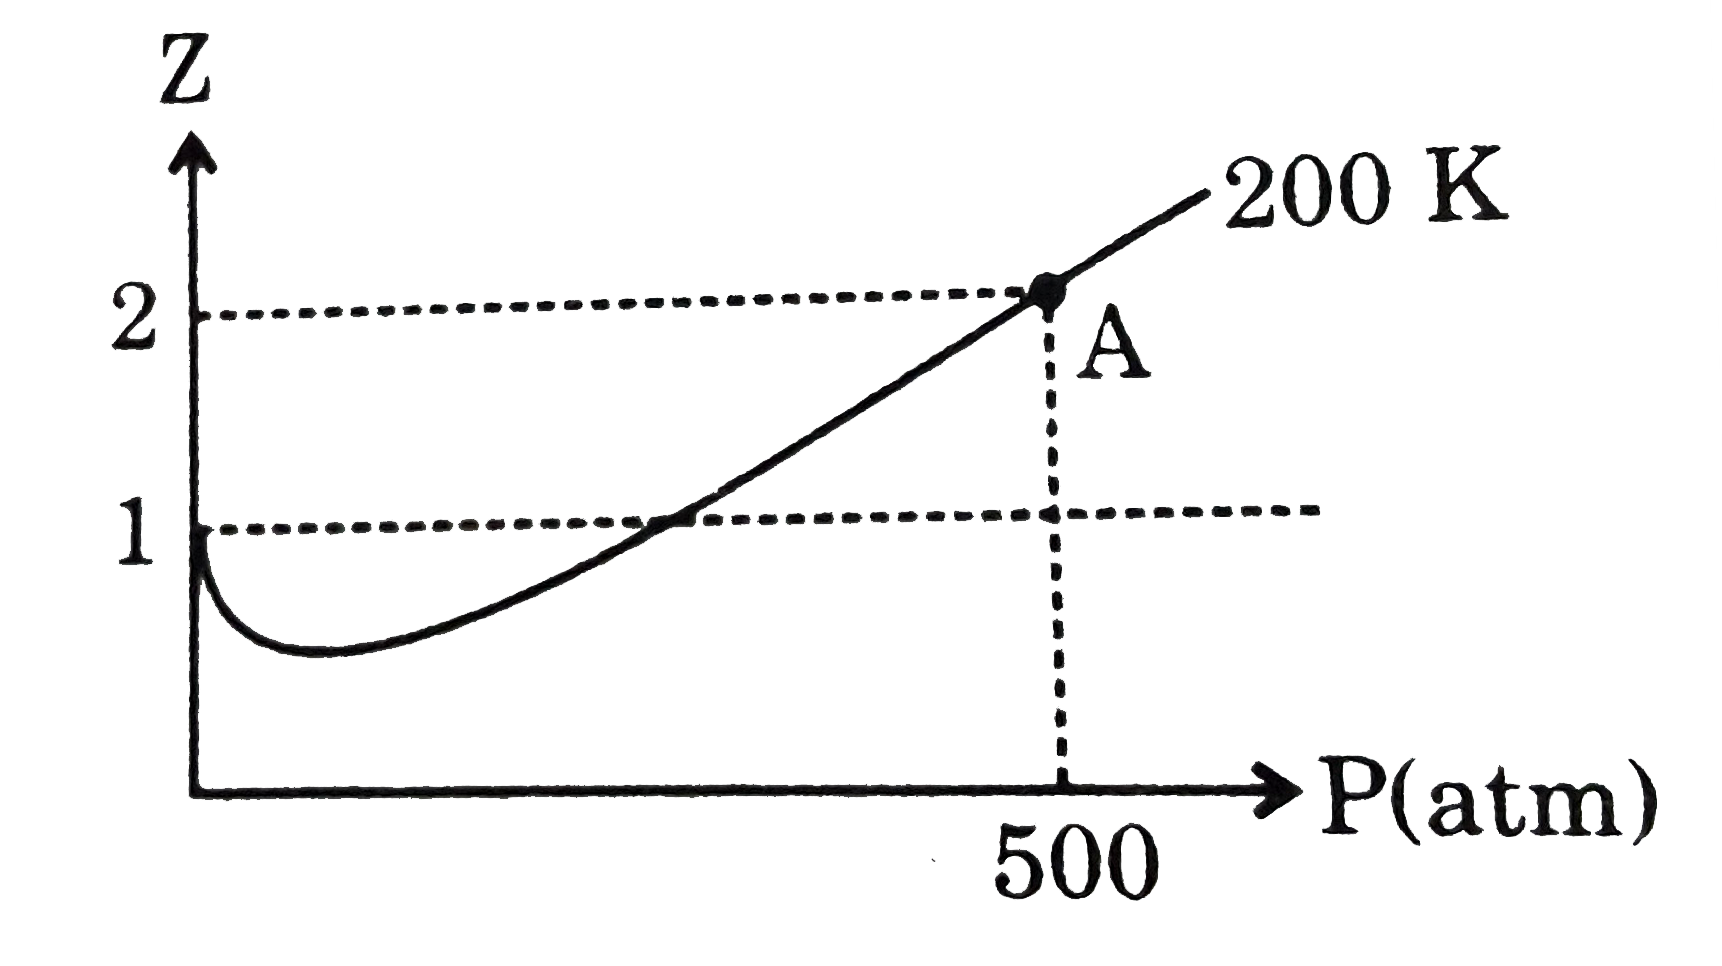
View SolutionZ us P graph is plotted for 1 mole of hypothetical gas. Volume of gas at this point A is: [R=0.08atmL/mole−K]

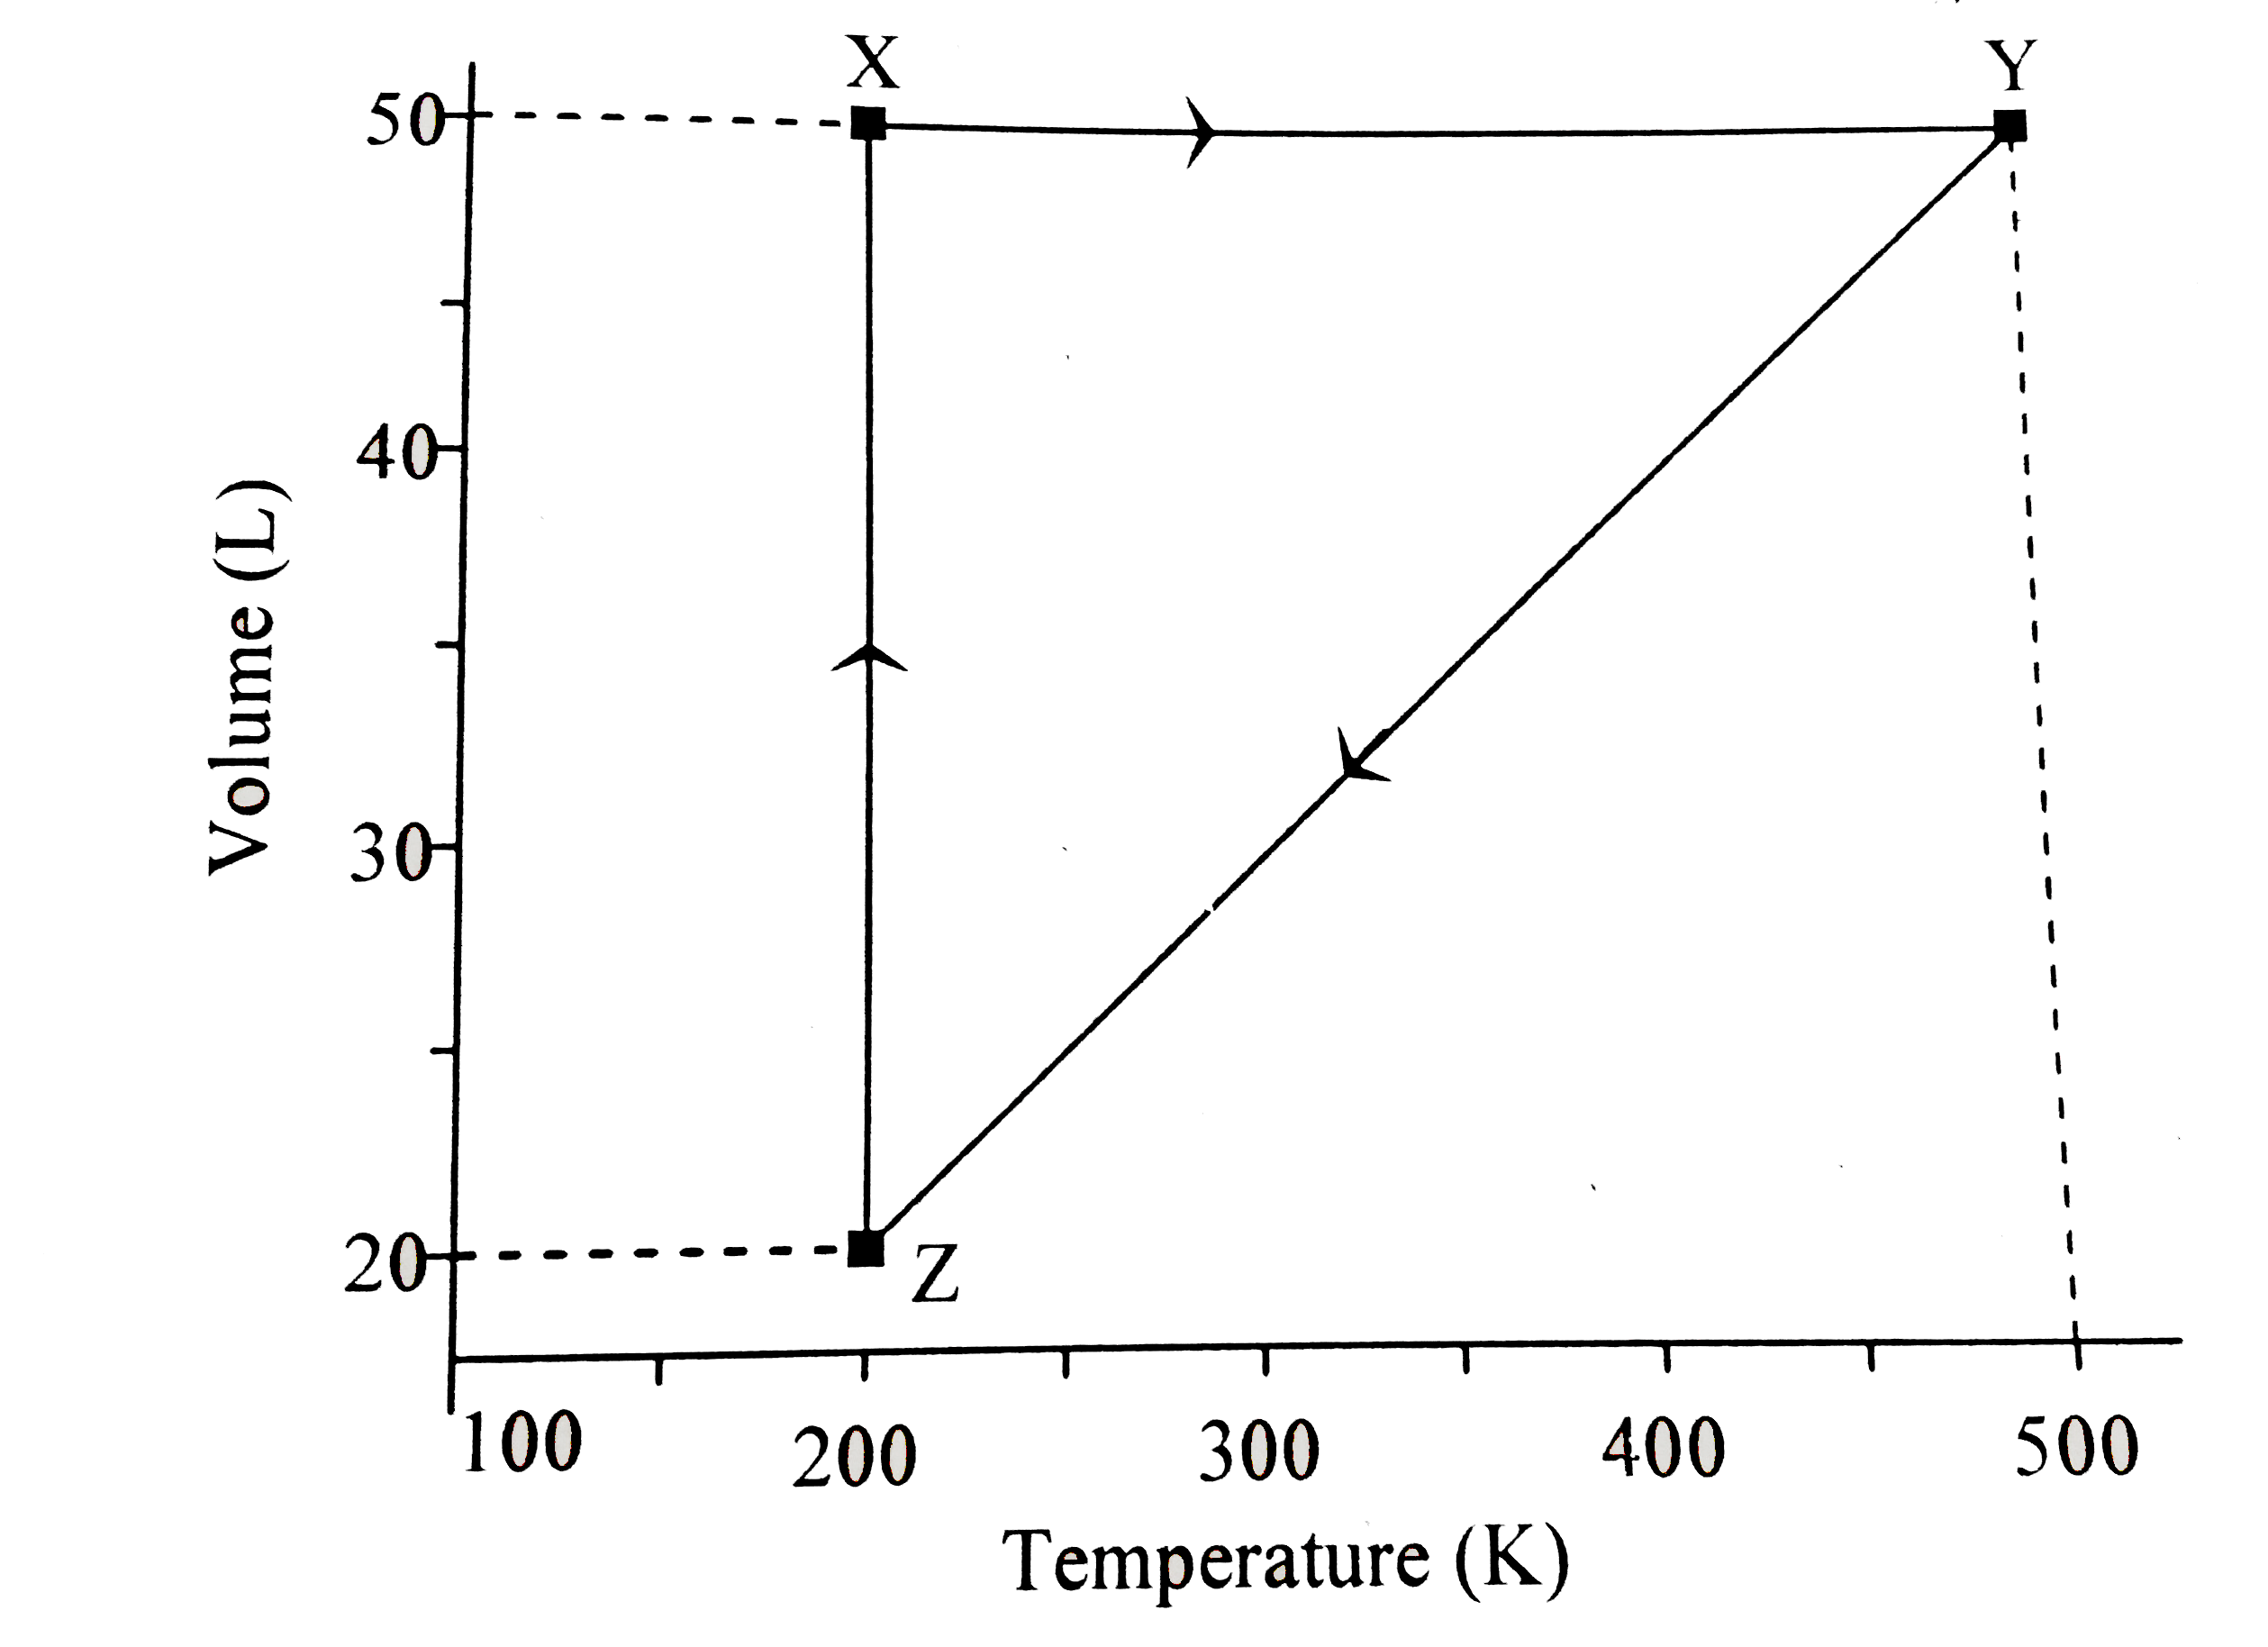
View SolutionThe volume vs. temperature graph of 1 mole of an ideal gas is given below

The pressure of the gas (in atm) at X, Y and Z, respectively, are
View SolutionAt low pressure, the graph of PVvs1V for a given amount at a constant temperature for a real gas is:
View Solution
