In a photoelectric experiment, kinetic energy of photoelectrons was plotted against the frequency of incident radition (v), as show in figure. Which of the following statements is correct ?
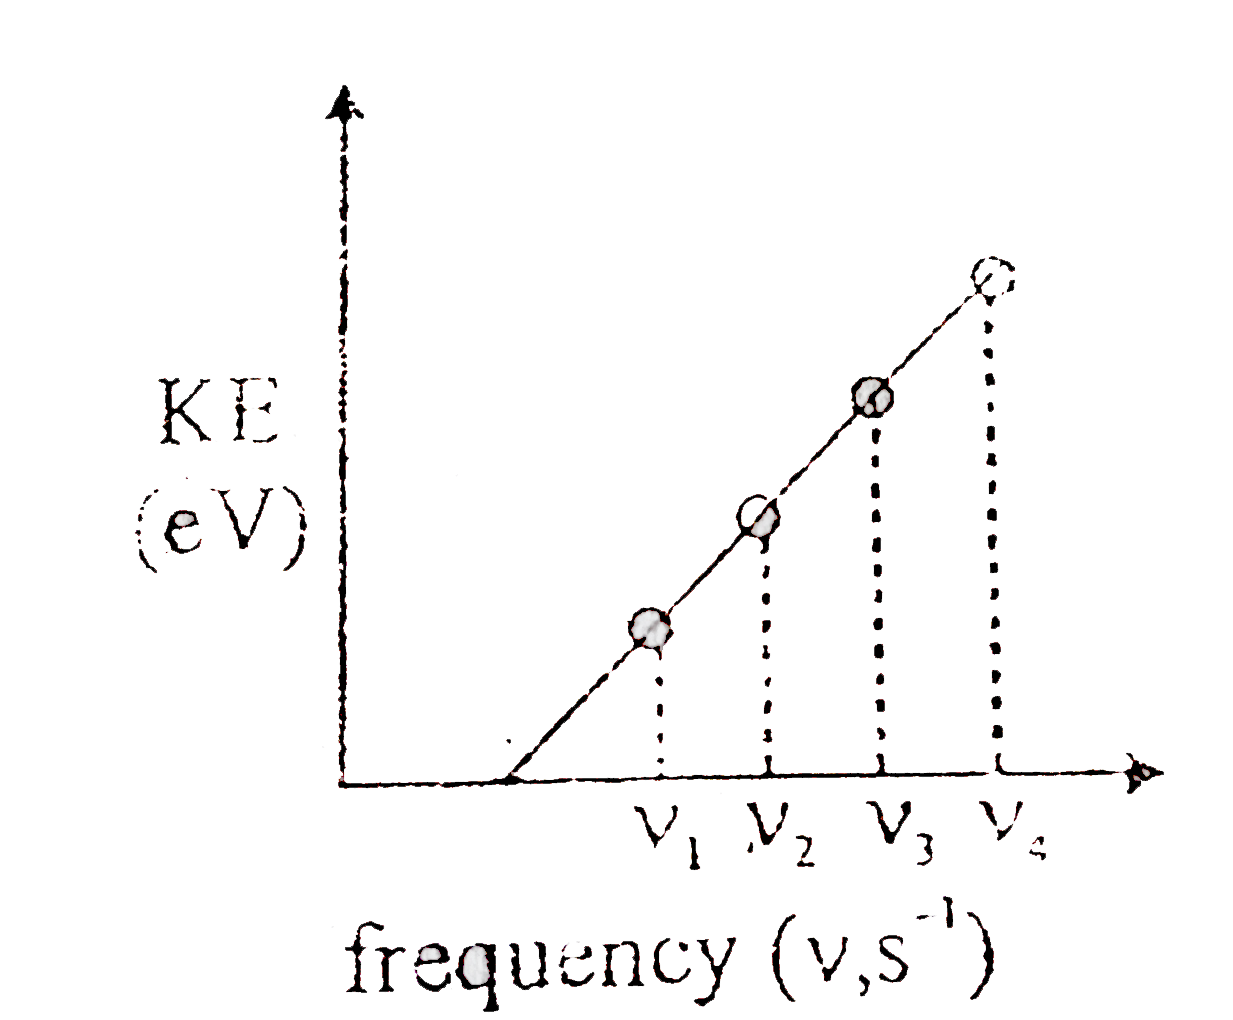
The threshold frequency is v1
The slope of this line is equal to Plank's constant
As the frequency of incident wavelength increases beyond threshold frequency, kinetic energy of photoelectrons decreases.
It is impossible to obtain such a graph
The correct Answer is:2
Step by step video, text & image solution for In a photoelectric experiment, kinetic energy of photoelectrons was plotted against the frequency of incident radition (v), as show in figure. Which of the following statements is correct ? by Chemistry experts to help you in doubts & scoring excellent marks in Class 12 exams.
Updated on:21/07/2023Topper's Solved these Questions
- NUCLEAR CHEMISTRYBOOK - RESONANCECHAPTER - NUCLEAR CHEMISTRYEXERCISE - PART-II SECTION-1
21 Videos
- NUCLEAR CHEMISTRYBOOK - RESONANCECHAPTER - NUCLEAR CHEMISTRYEXERCISE - PART-III
5 Videos
- NUCLEAR CHEMISTRYBOOK - RESONANCECHAPTER - NUCLEAR CHEMISTRYEXERCISE - PART-II
26 Videos
- NITROGEN CONTAINING COMPOUNDSBOOK - RESONANCECHAPTER - NITROGEN CONTAINING COMPOUNDSEXERCISE - ORGANIC CHEMISTRY(Nitrogen containing Compounds)
30 Videos
- P BLOCK ELEMENTSBOOK - RESONANCECHAPTER - P BLOCK ELEMENTSEXERCISE - PART -II
24 Videos
Similar Questions
Knowledge Check
Maximum kinetic energy (Ek) of a photoelectron varies with the frequency (v) of the incident radiation as
A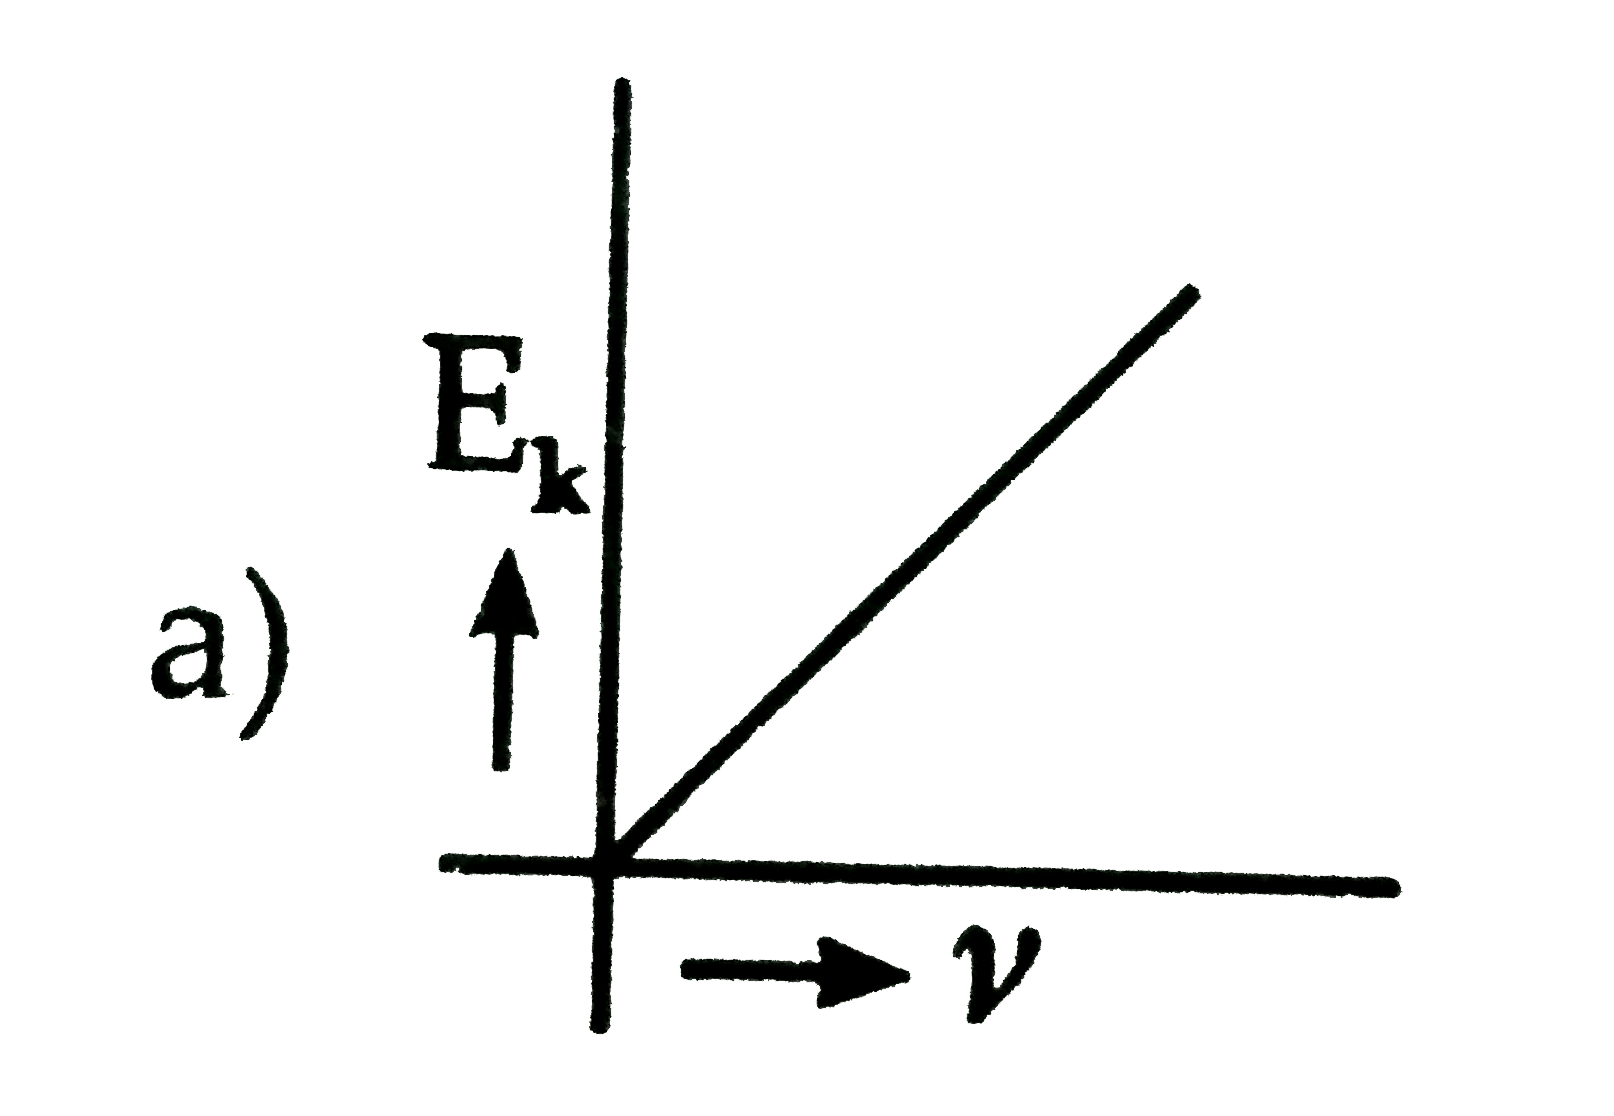 B
B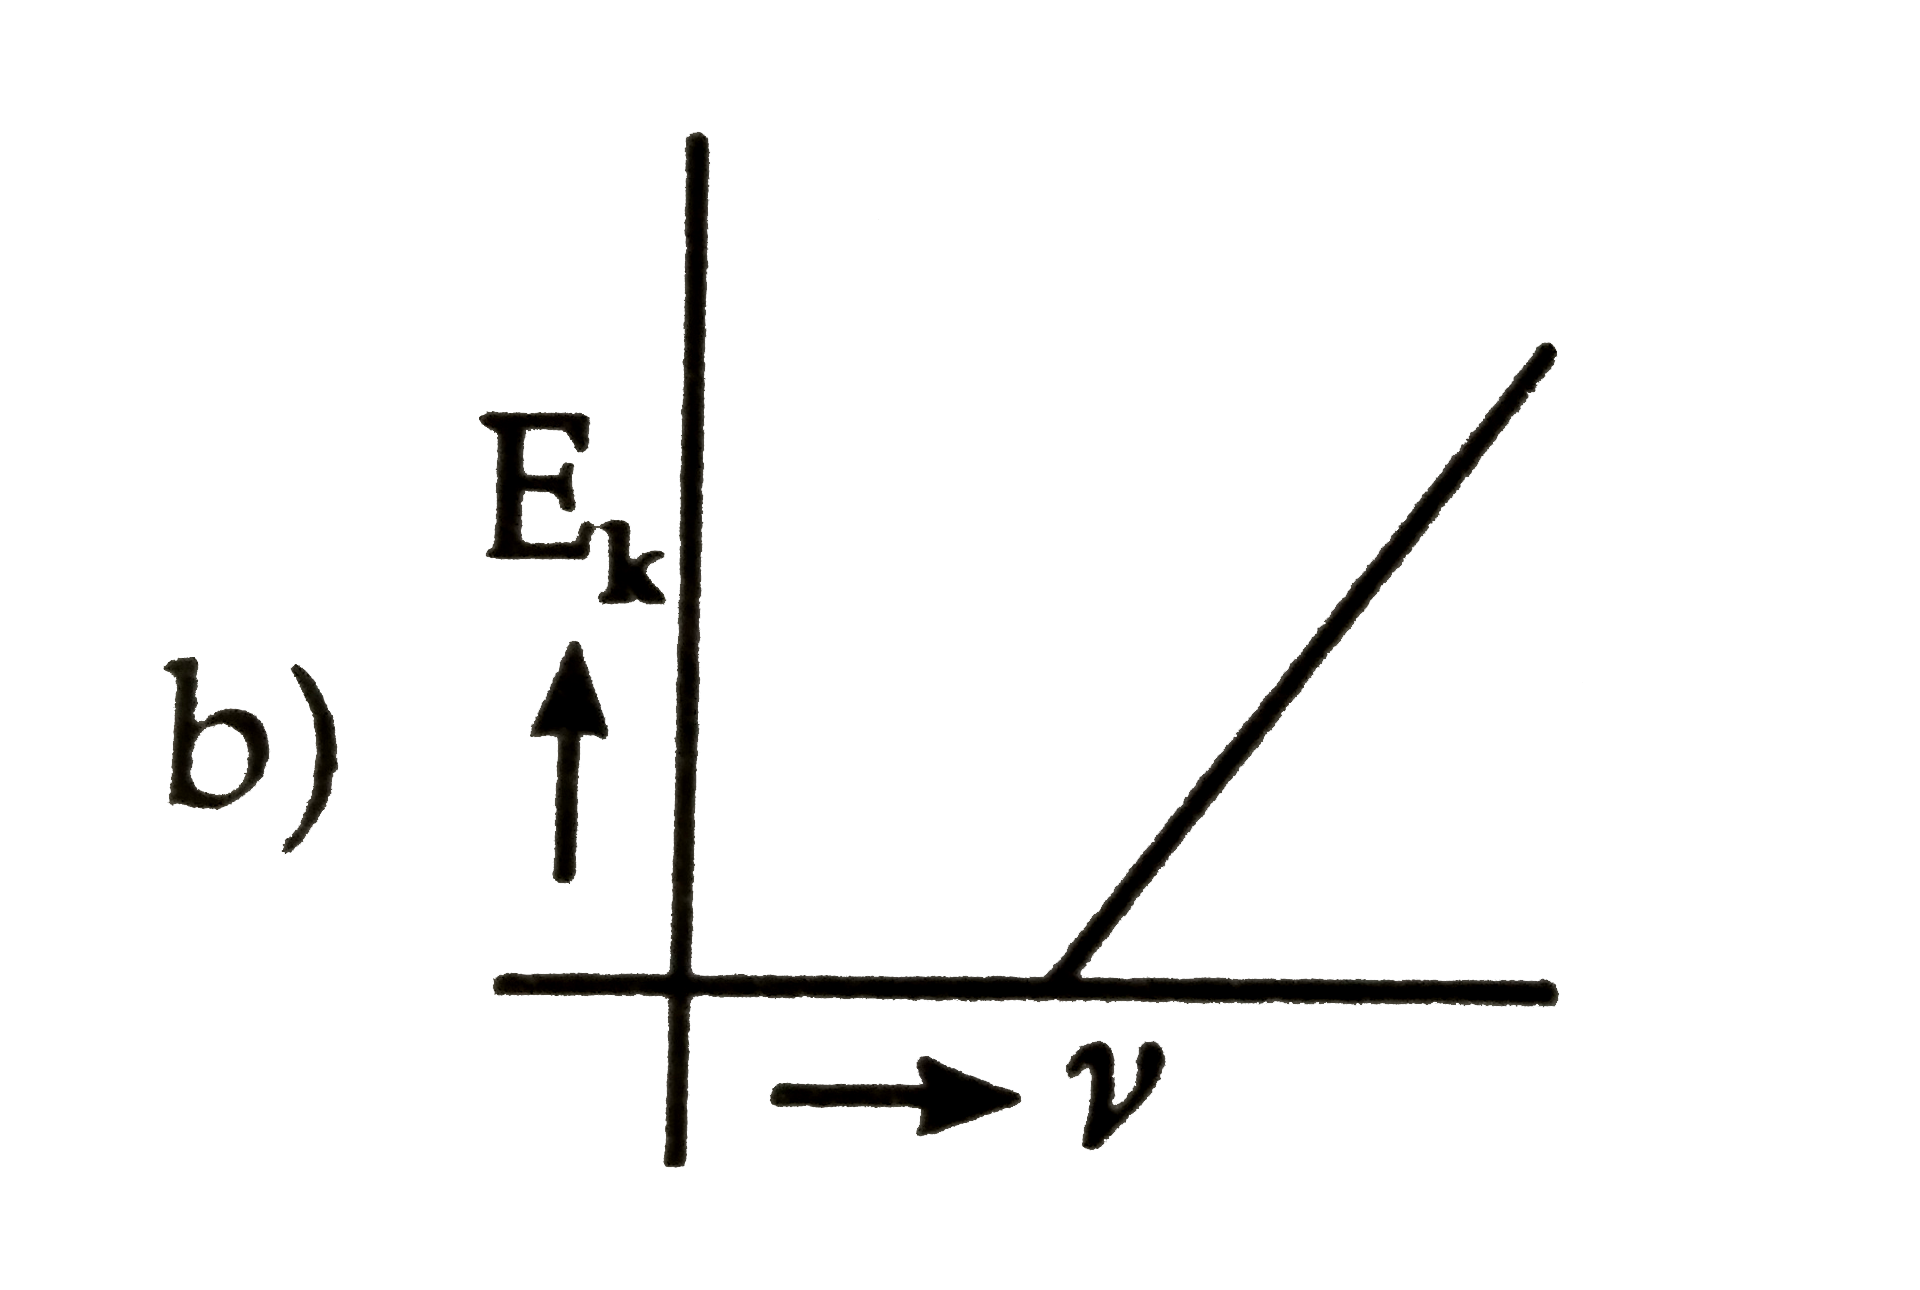 C
C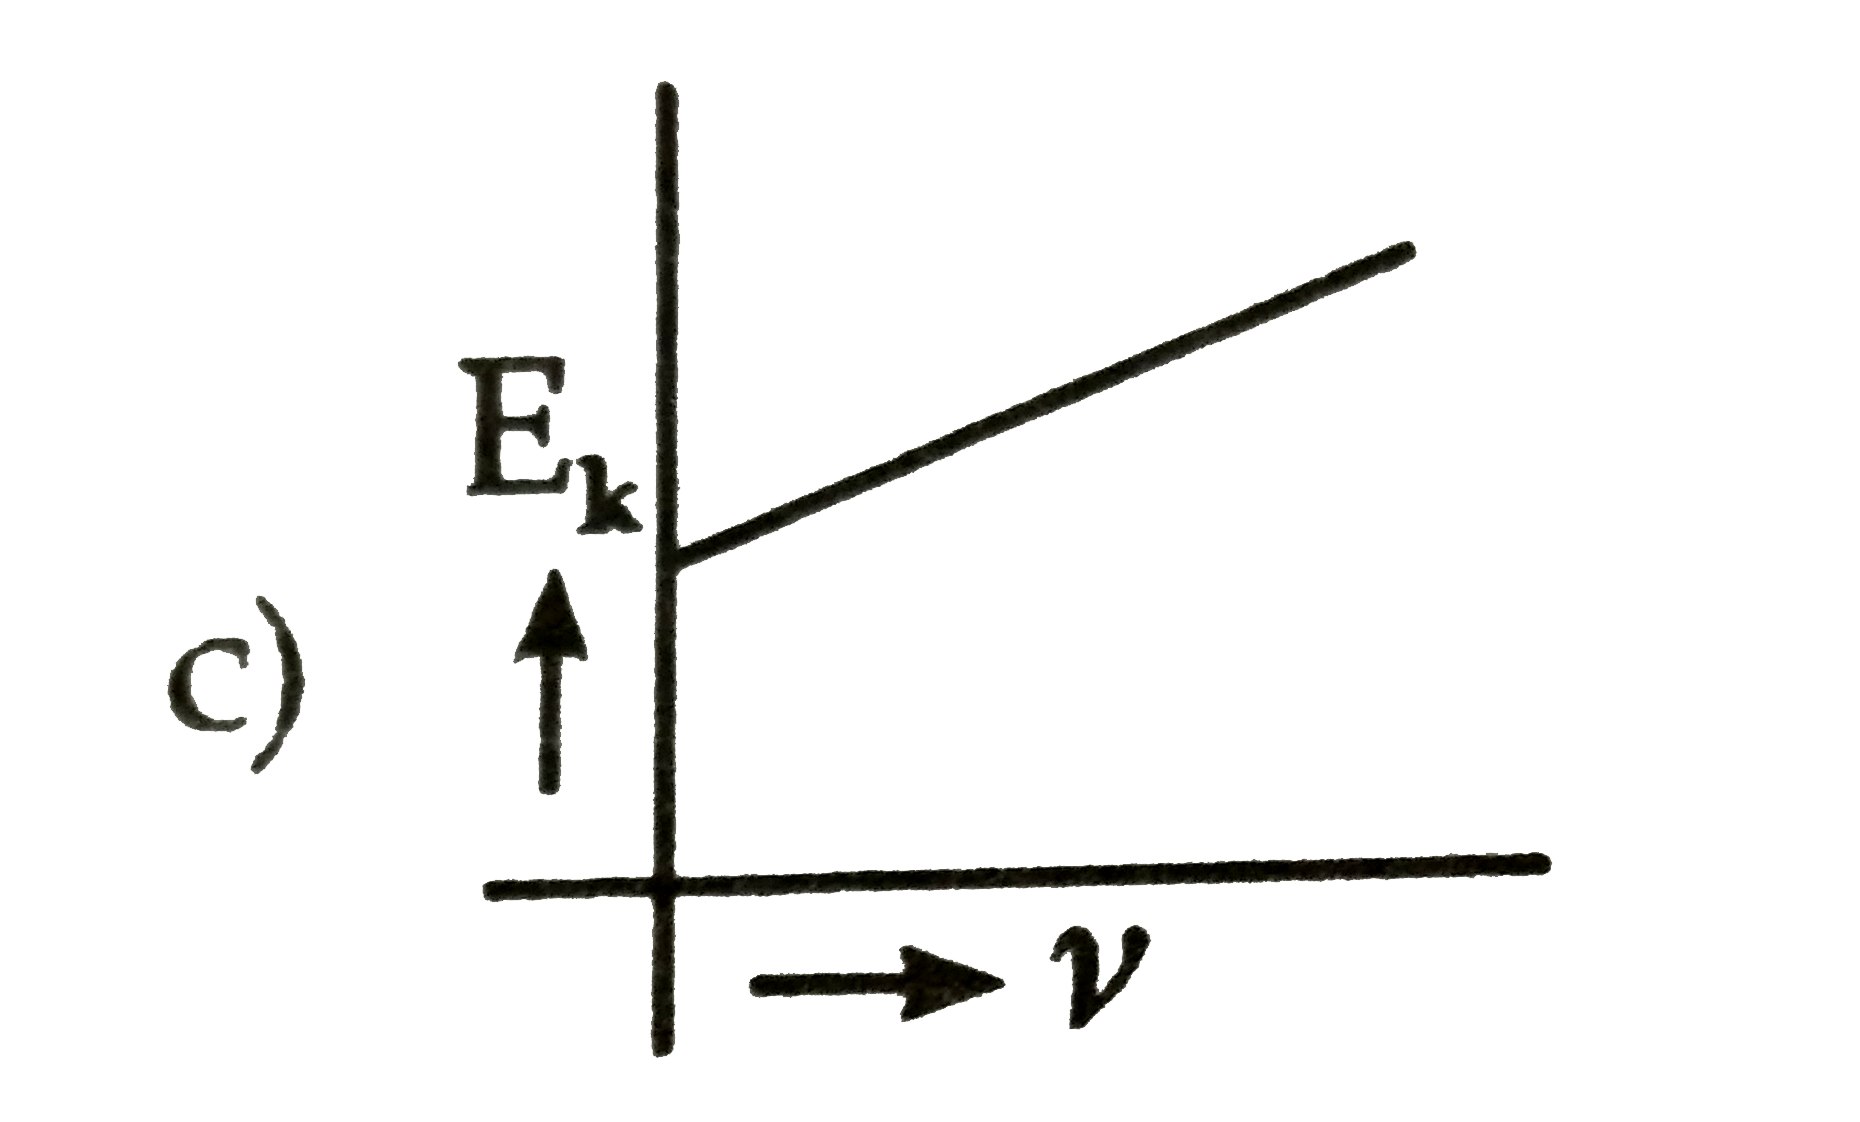 D
D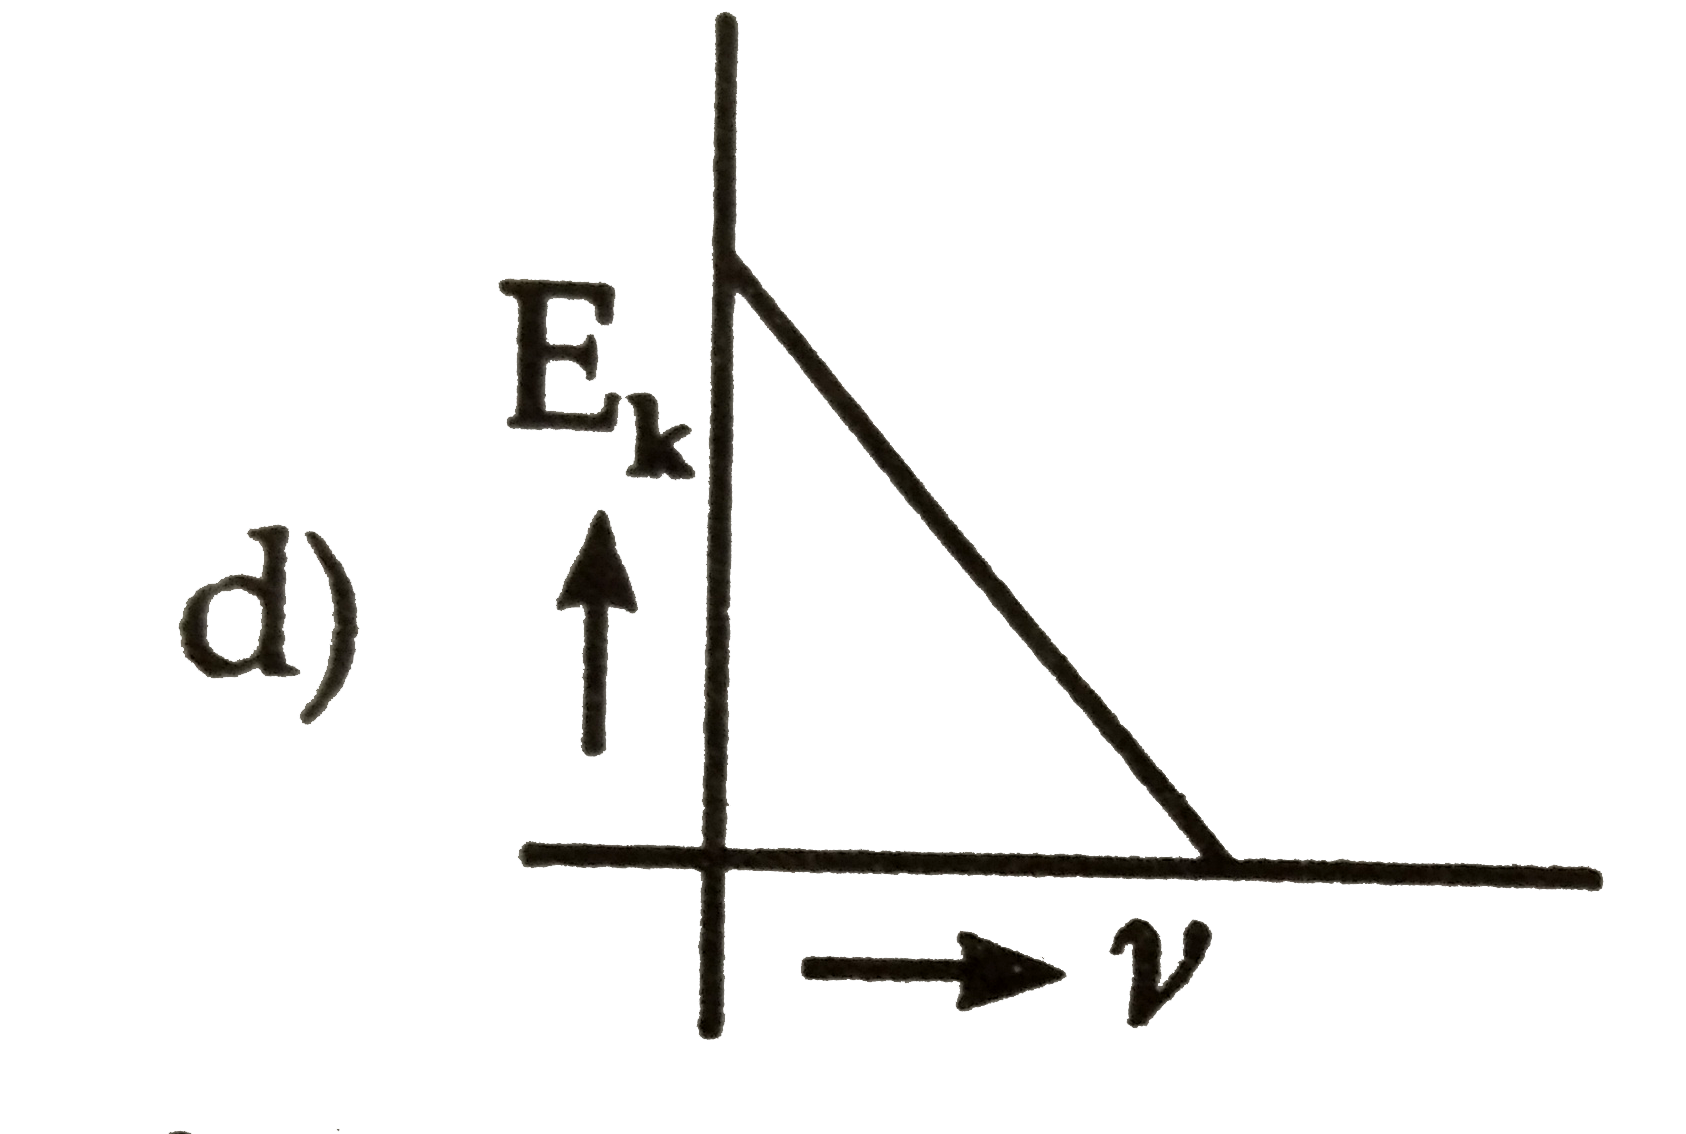
The kinetic energy (Ek) of a photoelectron varies with the frequency (v) of the incident radiation as which of the following graph ?
A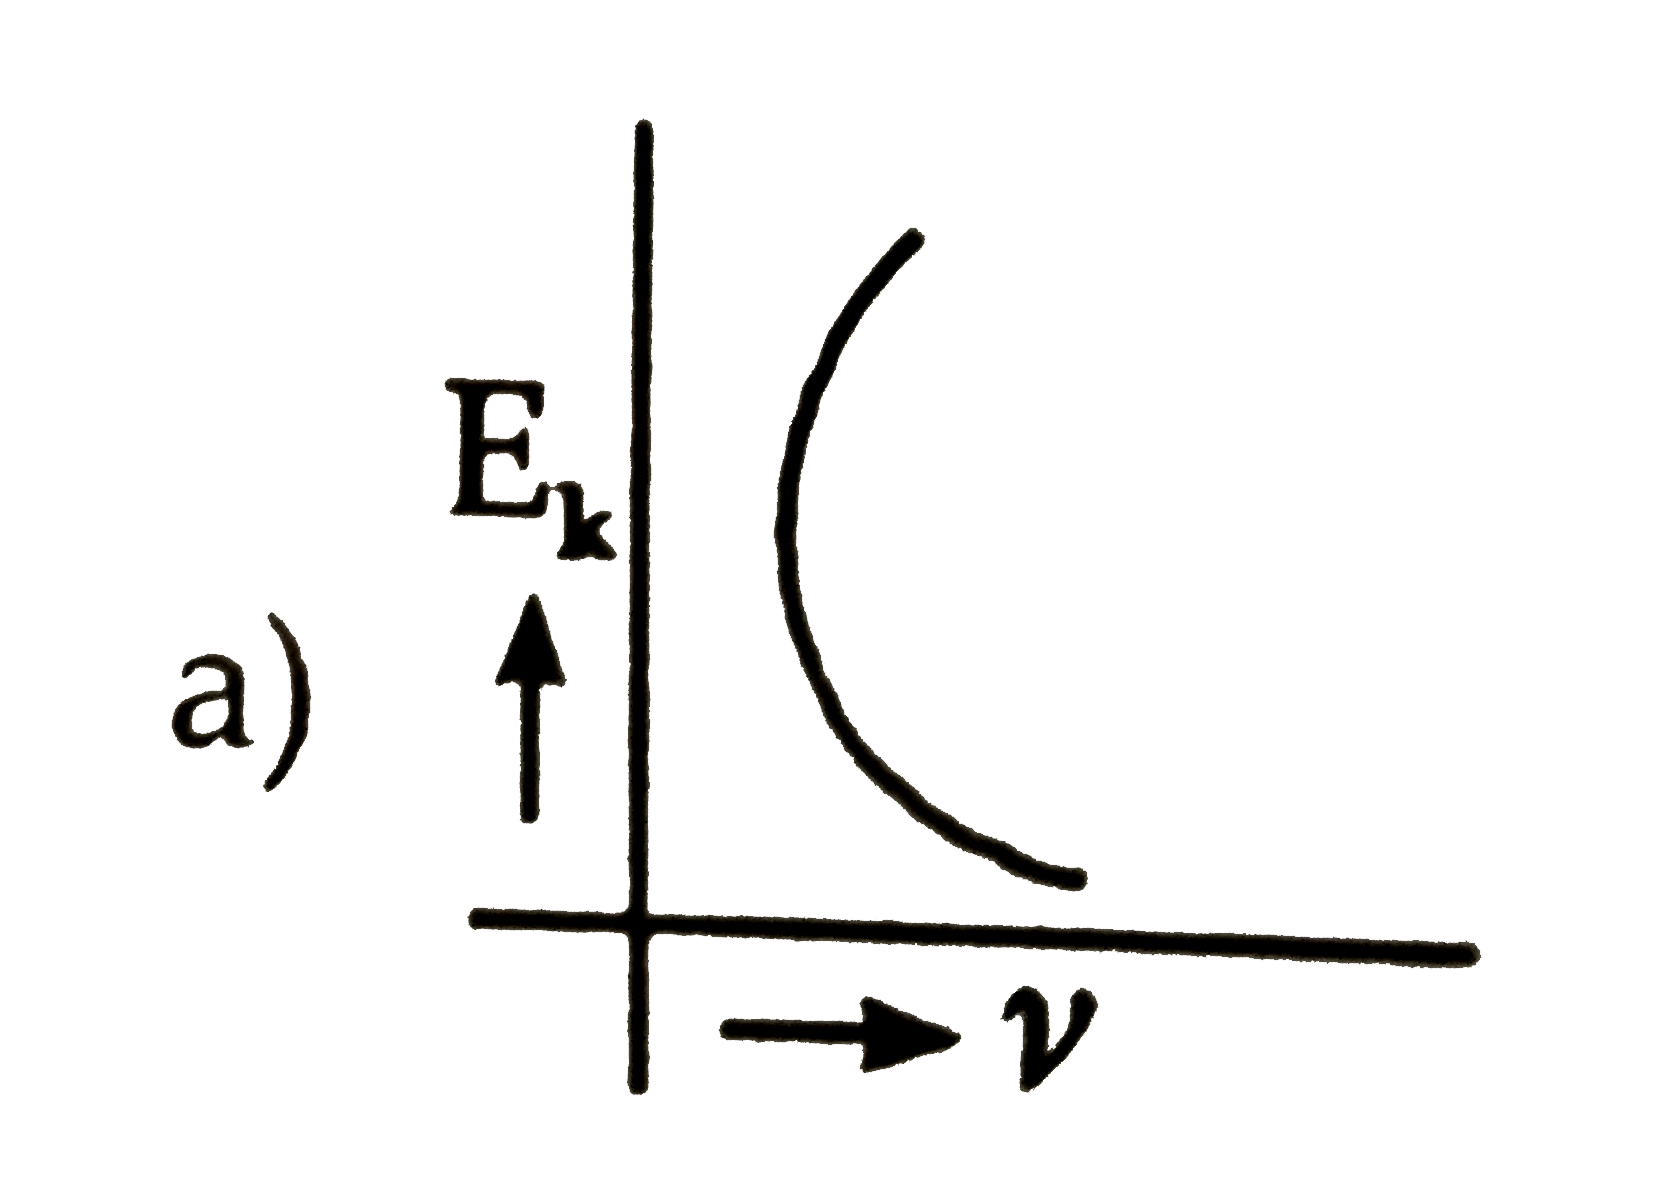 B
B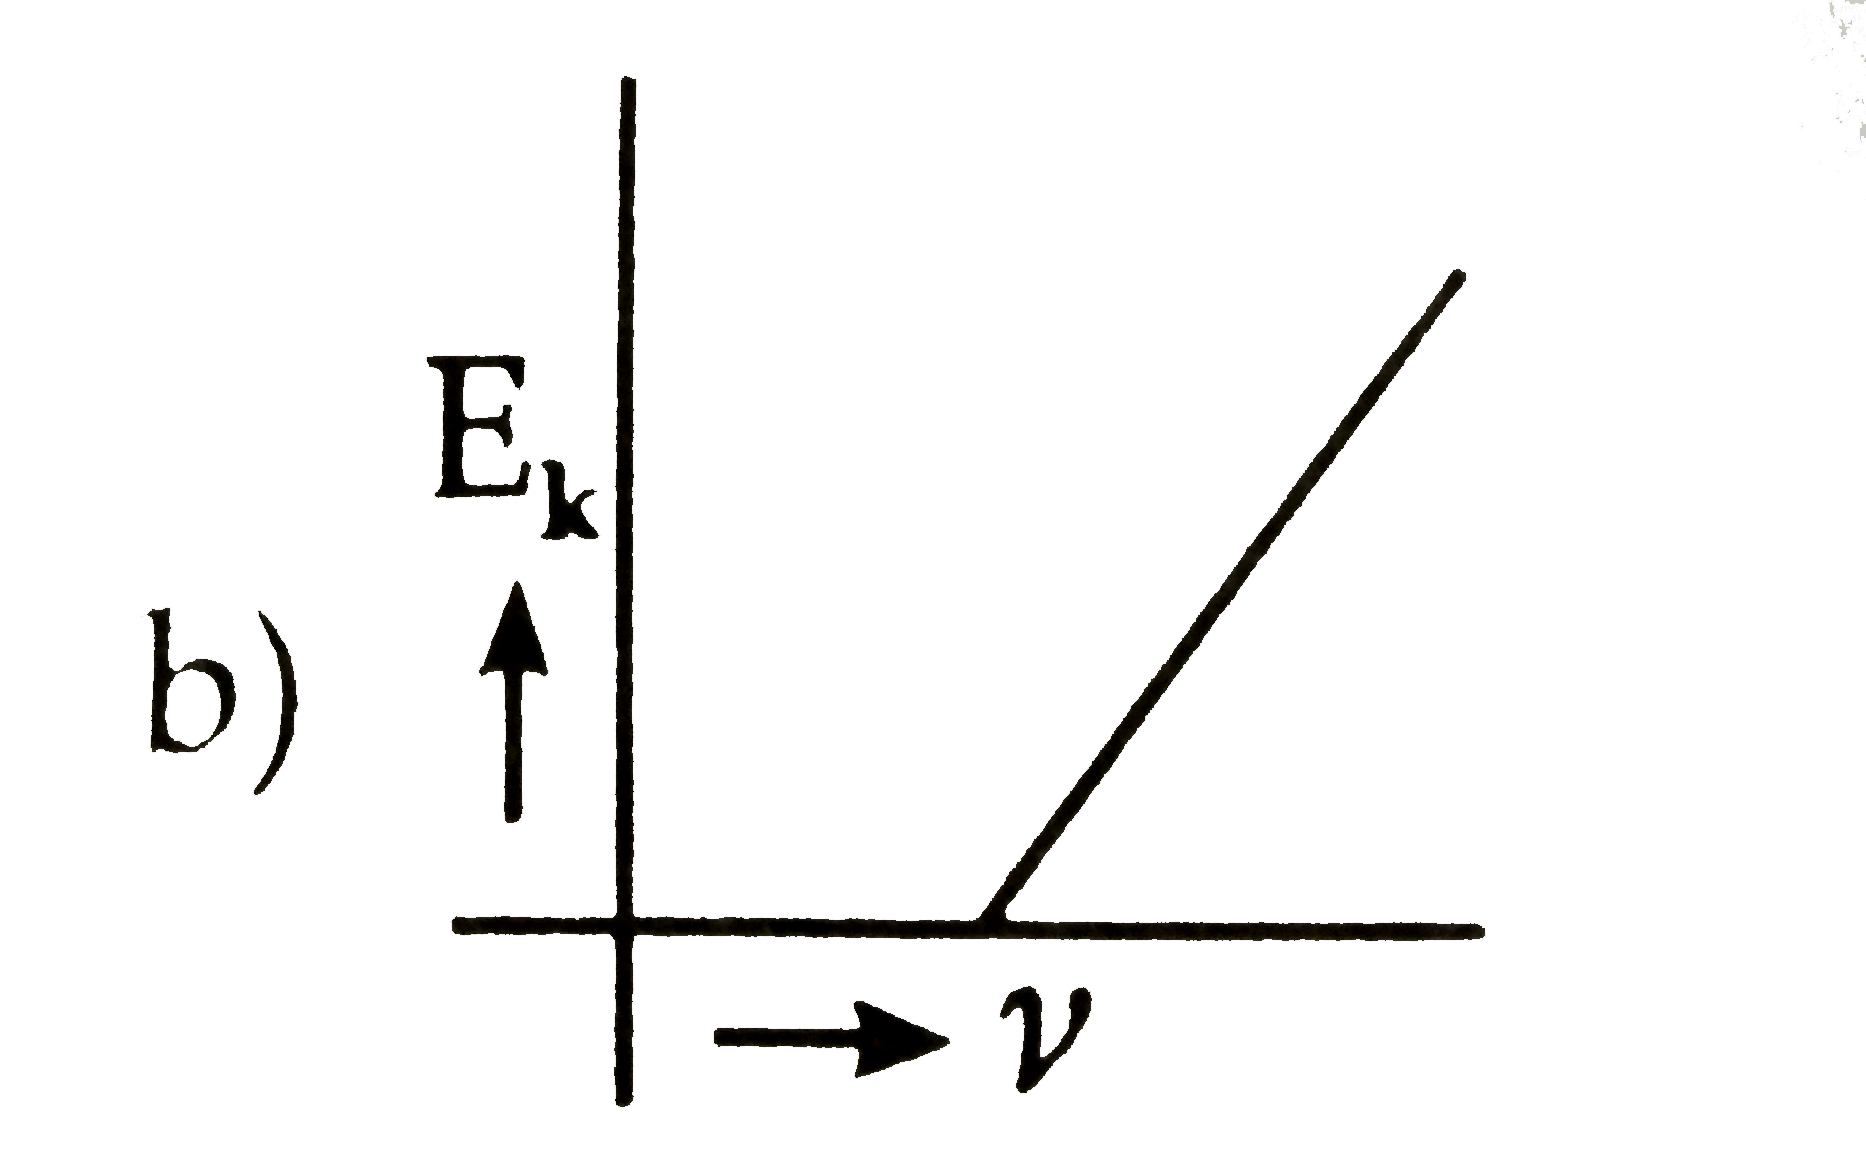 C
C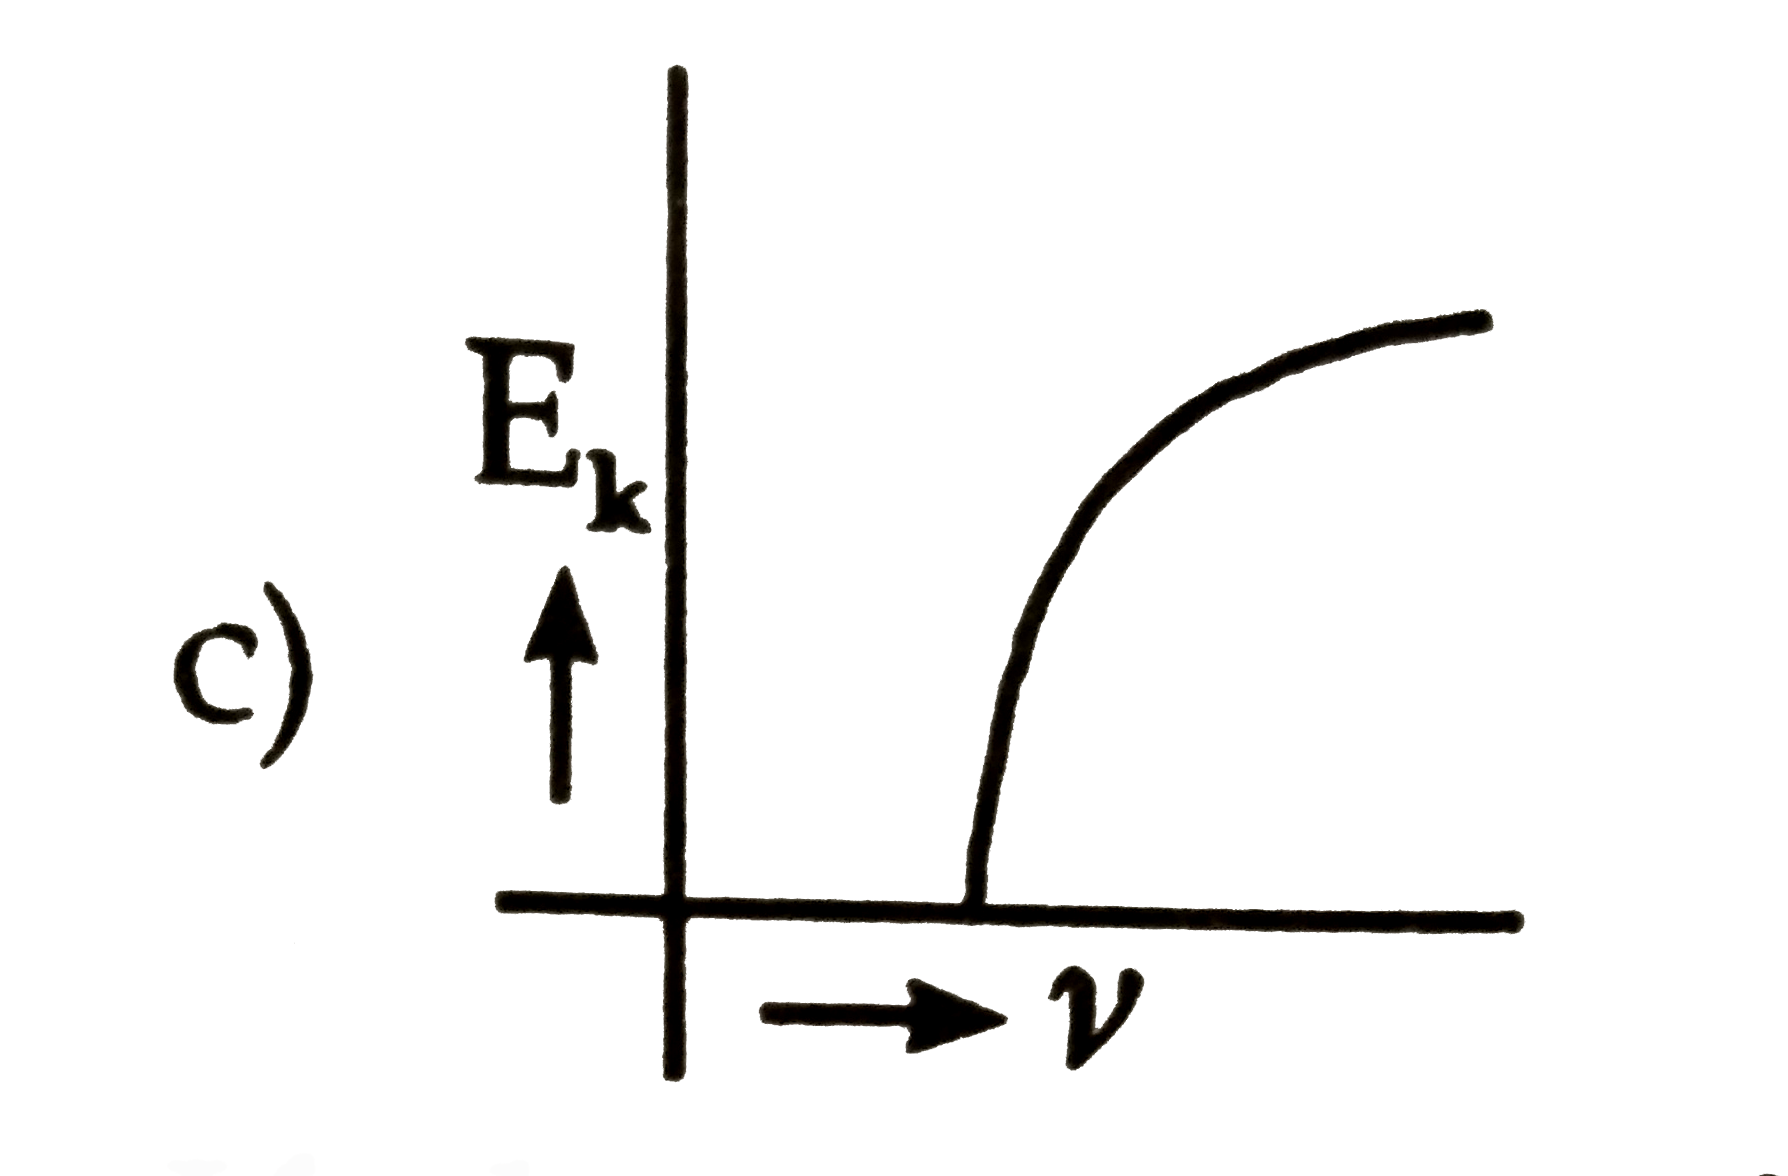 D
D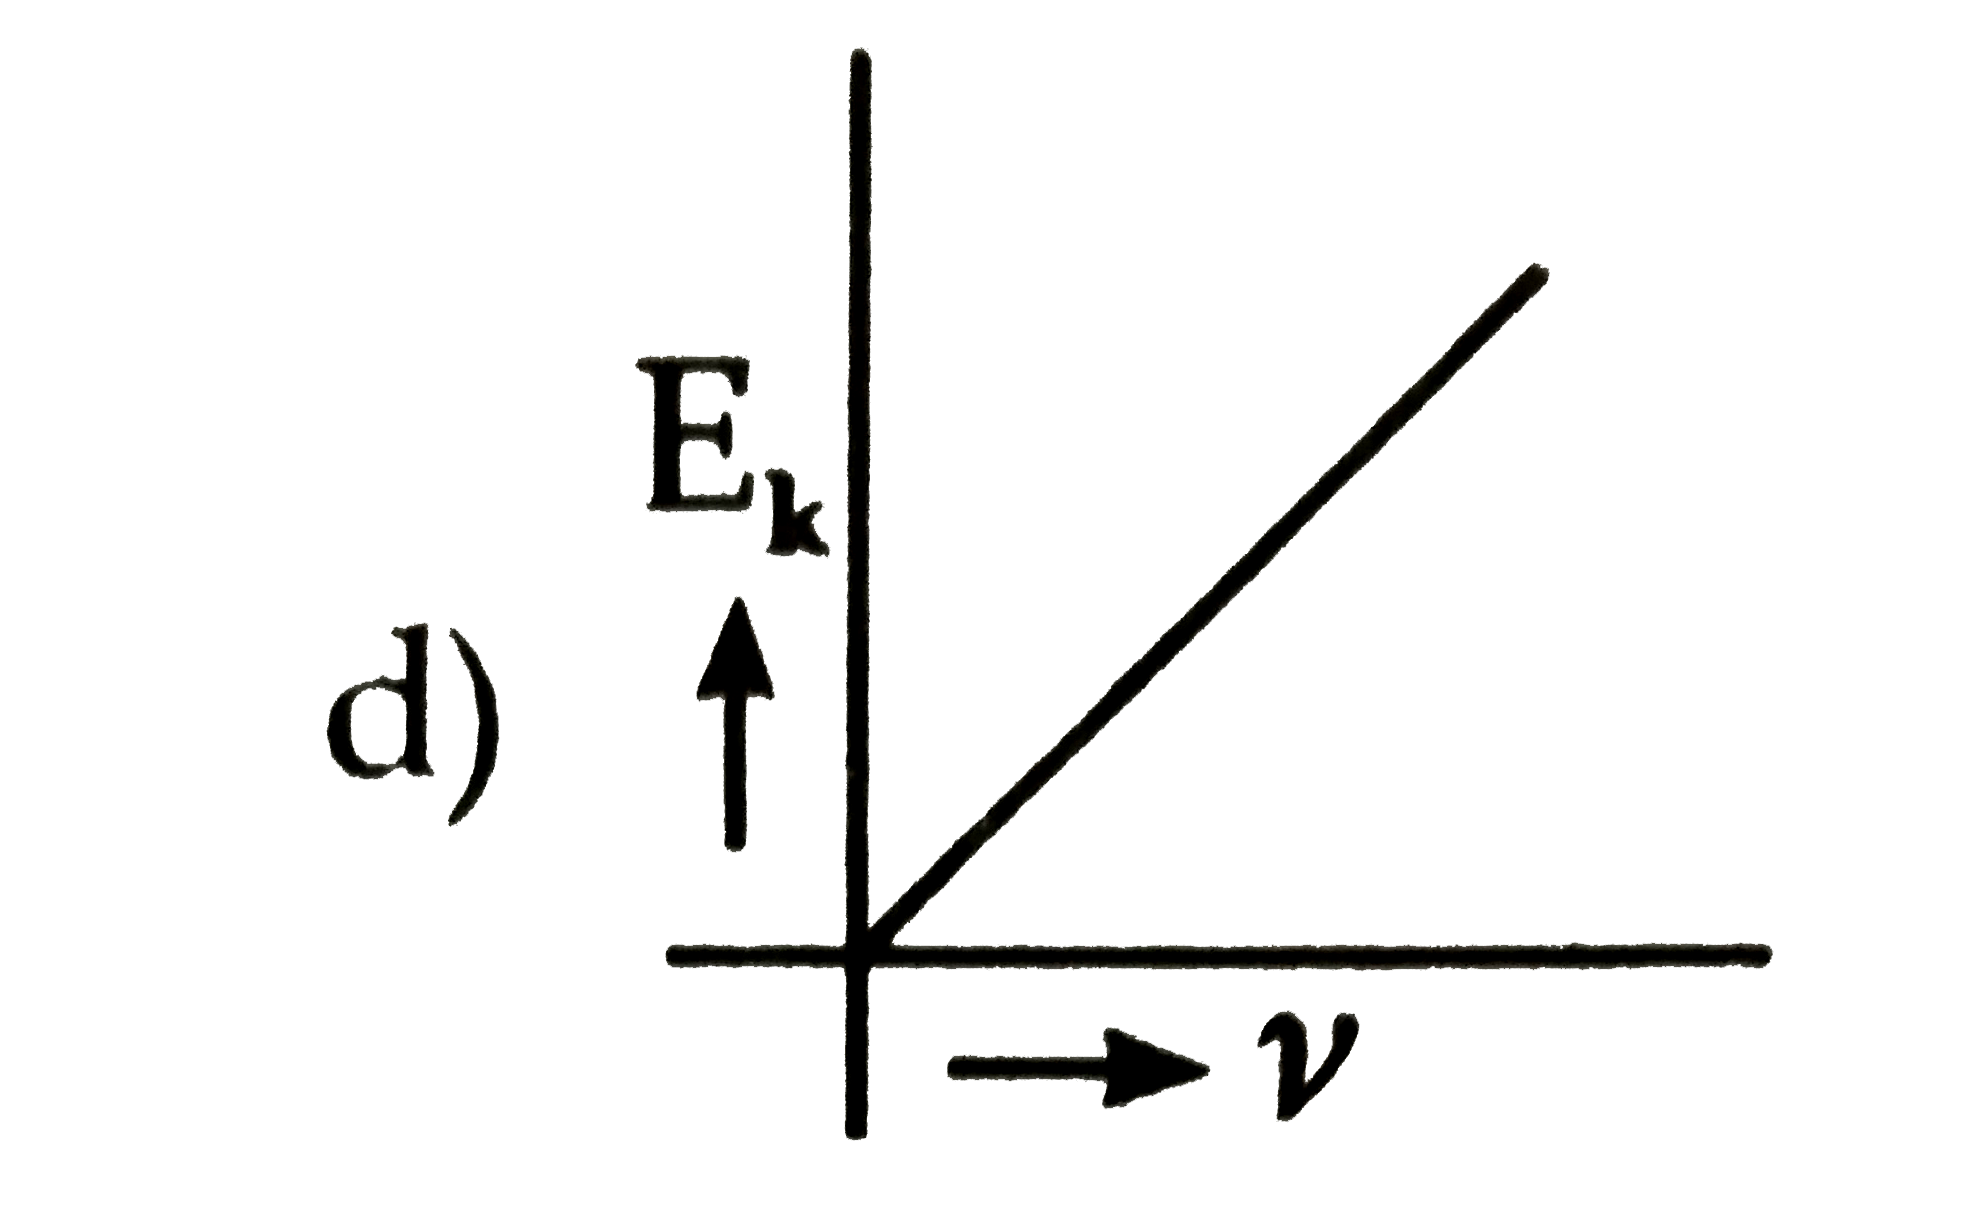
For the photoelectric effect, the maximum kinetic energy Ek of the emitted photoelectrons is plotted against the frequency ν of the incident photons as shown in the figure. The slope of the curve gives
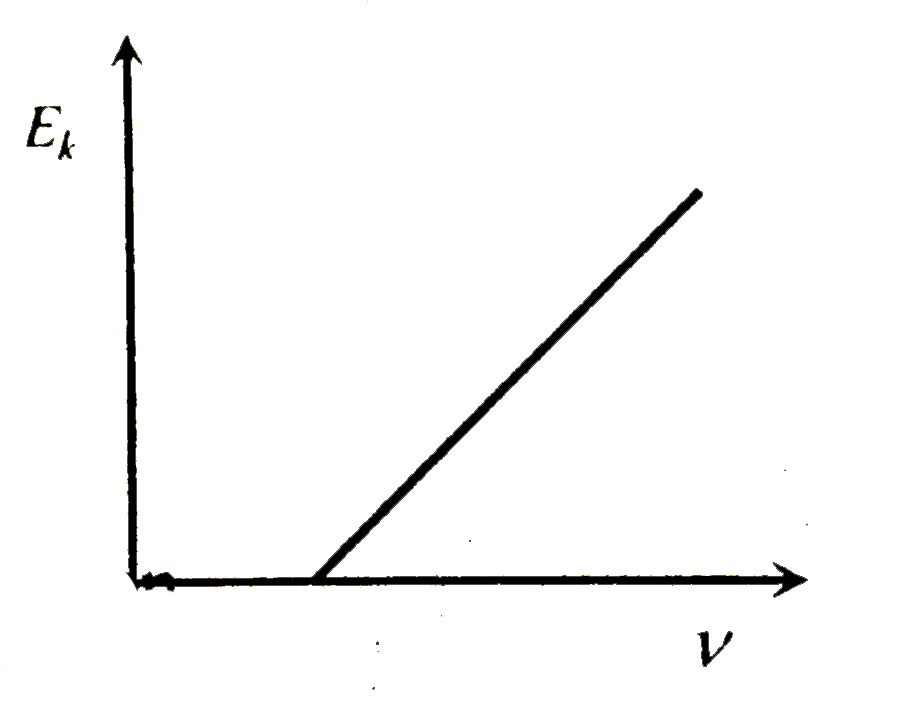 ACharge of the electronBWork function of the metalCPlanck's constantDRatio of the Planck’s constant to electronic charge
The intensity of X-rays firom a coollidge tube is plotted against wavelength λ as shown in the figure-3.12. Which ofthe following statements is/are correct:

View SolutionFor the photoelectric effect, the maximum kinetic energy Ek of the emitted photoelectrons is plotted against the frequency of the incident photons as shown in the figure. The slope of the curve gives

View SolutionAccording to Einstein's photoelectric equation, the graph between the kinetic energy of photoelectrons ejected and the frequency of incident radiation is
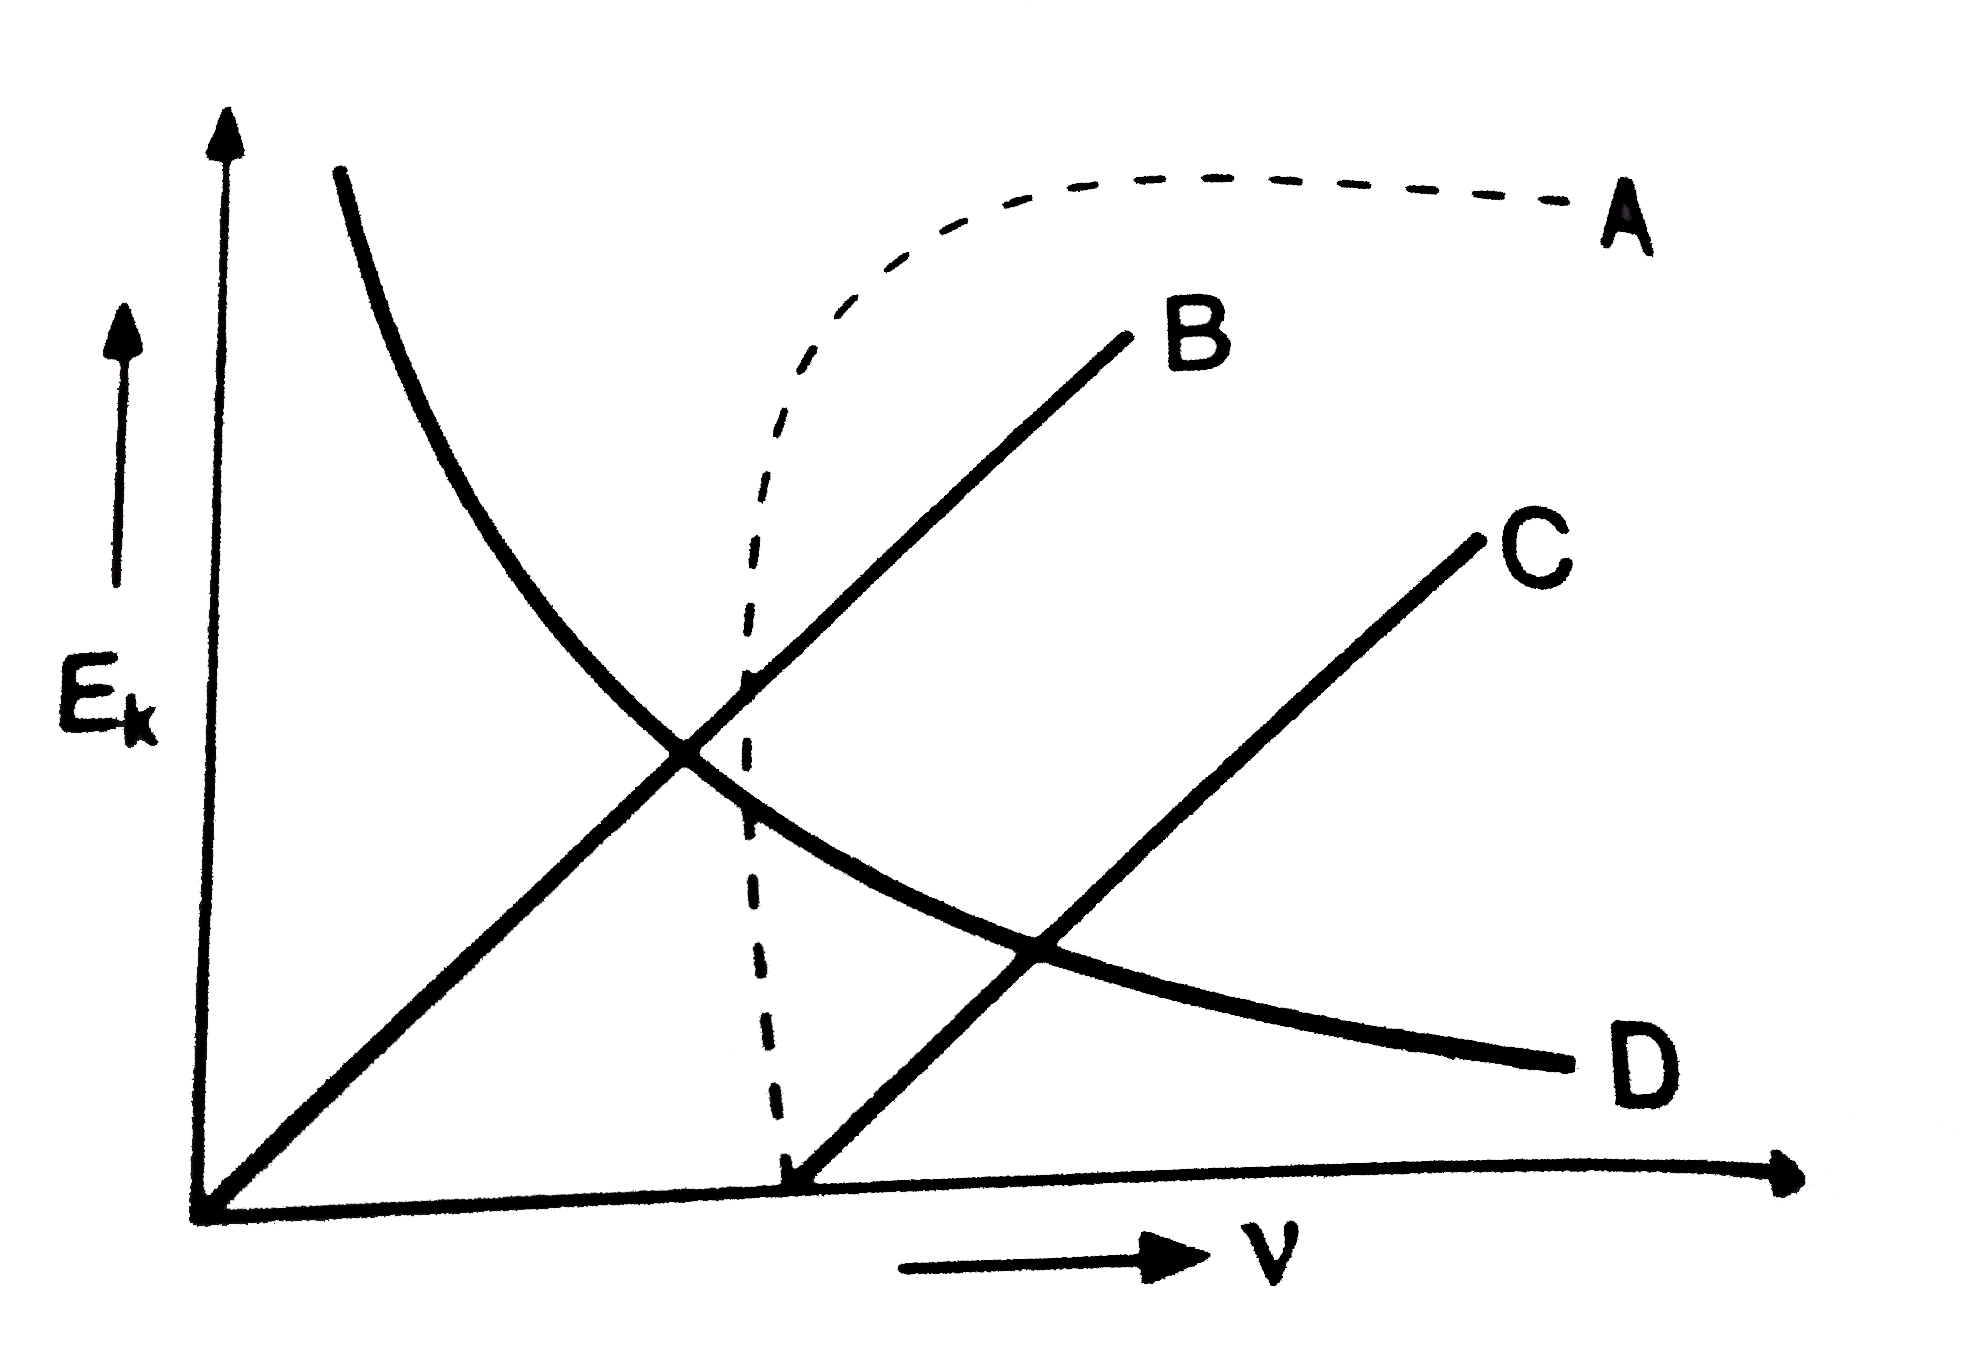
View SolutionThe maximu kinetic energy (Ek) of the photoelectron varies with frequency (v) of the incident light as shown by the curve:
View SolutionIn a photoelectric experiment, a student plotted the graph of stopping potential (Vs) against the frequency of incident radiation (v). But he could not write the unit of the slope of the graph. What is the corrent unit ?
View Solution
