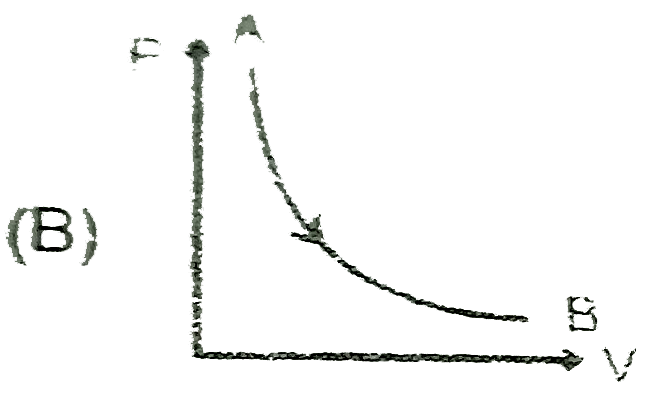
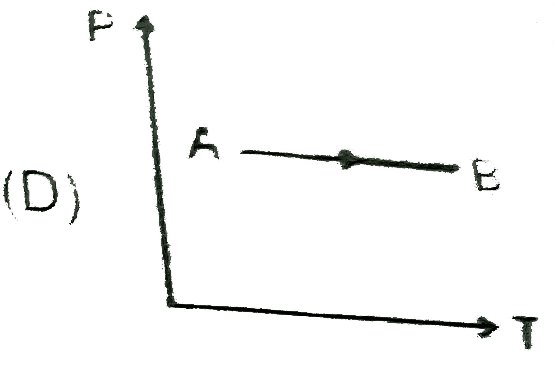
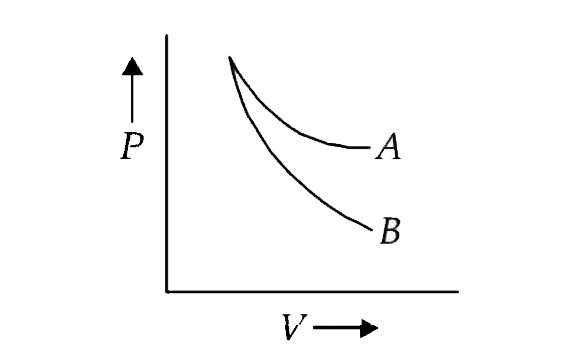
The process ΔU=0, for an ideal gas can be best represented in the form of a graph
The correct Answer is:B
To solve the question regarding the representation of the process where ΔU=0 for an ideal gas, we will follow these steps:
1. Understanding the Concept of Internal Energy (ΔU):
- For an ideal gas, the change in internal energy (ΔU) is given by the formula:
ΔU=nCvΔT
- Here, n is the number of moles, Cv is the molar heat capacity at constant volume, and ΔT is the change in temperature.
2. Setting ΔU=0:
- When ΔU=0, it implies that:
nCvΔT=0
- Since n and Cv are constants for a given gas, this means that ΔT=0.
3. Interpreting ΔT=0:
- A change in temperature of zero indicates that the temperature remains constant throughout the process. This is characteristic of an isothermal process.
4. Graphical Representation of an Isothermal Process:
- In a Pressure-Volume (P-V) diagram, an isothermal process for an ideal gas is represented by a hyperbolic curve. This is because, according to the ideal gas law PV=nRT, if the temperature (T) is constant, the product PV will also remain constant.
- Therefore, the graph will show a hyperbola, which reflects the inverse relationship between pressure and volume at constant temperature.
5. Conclusion:
- The process ΔU=0 for an ideal gas can be best represented as an isothermal process on a P-V diagram, which is depicted as a hyperbola.
Final Answer:
The process ΔU=0 for an ideal gas is best represented by a hyperbolic curve on a Pressure-Volume (P-V) graph, indicating an isothermal process.
---
- For an ideal gas, the change in internal energy (ΔU) is given by the formula:
ΔU=nCvΔT
- Here, n is the number of moles, Cv is the molar heat capacity at constant volume, and ΔT is the change in temperature.
- When ΔU=0, it implies that:
nCvΔT=0
- Since n and Cv are constants for a given gas, this means that ΔT=0.
- A change in temperature of zero indicates that the temperature remains constant throughout the process. This is characteristic of an isothermal process.
- In a Pressure-Volume (P-V) diagram, an isothermal process for an ideal gas is represented by a hyperbolic curve. This is because, according to the ideal gas law PV=nRT, if the temperature (T) is constant, the product PV will also remain constant.
- Therefore, the graph will show a hyperbola, which reflects the inverse relationship between pressure and volume at constant temperature.
- The process ΔU=0 for an ideal gas can be best represented as an isothermal process on a P-V diagram, which is depicted as a hyperbola.
The process ΔU=0 for an ideal gas is best represented by a hyperbolic curve on a Pressure-Volume (P-V) graph, indicating an isothermal process.
Topper's Solved these Questions
- THERMODYNAMICSBOOK - RESONANCECHAPTER - THERMODYNAMICSEXERCISE - Exercise -2 Part-I: Only one option correct type
23 Videos
- THERMODYNAMICSBOOK - RESONANCECHAPTER - THERMODYNAMICSEXERCISE - Exercise-2 II: Single and double value integer type
16 Videos
- THERMODYNAMICSBOOK - RESONANCECHAPTER - THERMODYNAMICSEXERCISE - H-1
1 Videos
- TEST SERIESBOOK - RESONANCECHAPTER - TEST SERIESEXERCISE - CHEMISTRY
50 Videos
Similar Questions
Knowledge Check
The process ΔU=0, for an ideal gas can be best represented in the form of a graph:
A B
B C
C D
D
In an isothermal process for an ideal gas
AΔQ=0BΔW=0CΔU=0DΔV=0In an isothermal process for an ideal gas
AΔQ=0BΔW=0CΔU=0DΔV=0
Ideal gas and polytropic process
View SolutionFor an ideal gas, in an isothermal process
View SolutionThe given curve represents the variation of temperatue as a function of volume for one mole of an ideal gas. Which of the following curves best represents the variation of pressure as a function of volume ?
(##DCP_V03_C20_E01_099_Q01##).
View SolutionThe relation between U,P and V for an ideal gas in an adiabatic process is given by U = 2 + 3 PV. The gas is
View SolutionIn a given process on an ideal gas, dW=0 and dQ is negative, then for the gas:
View Solution

