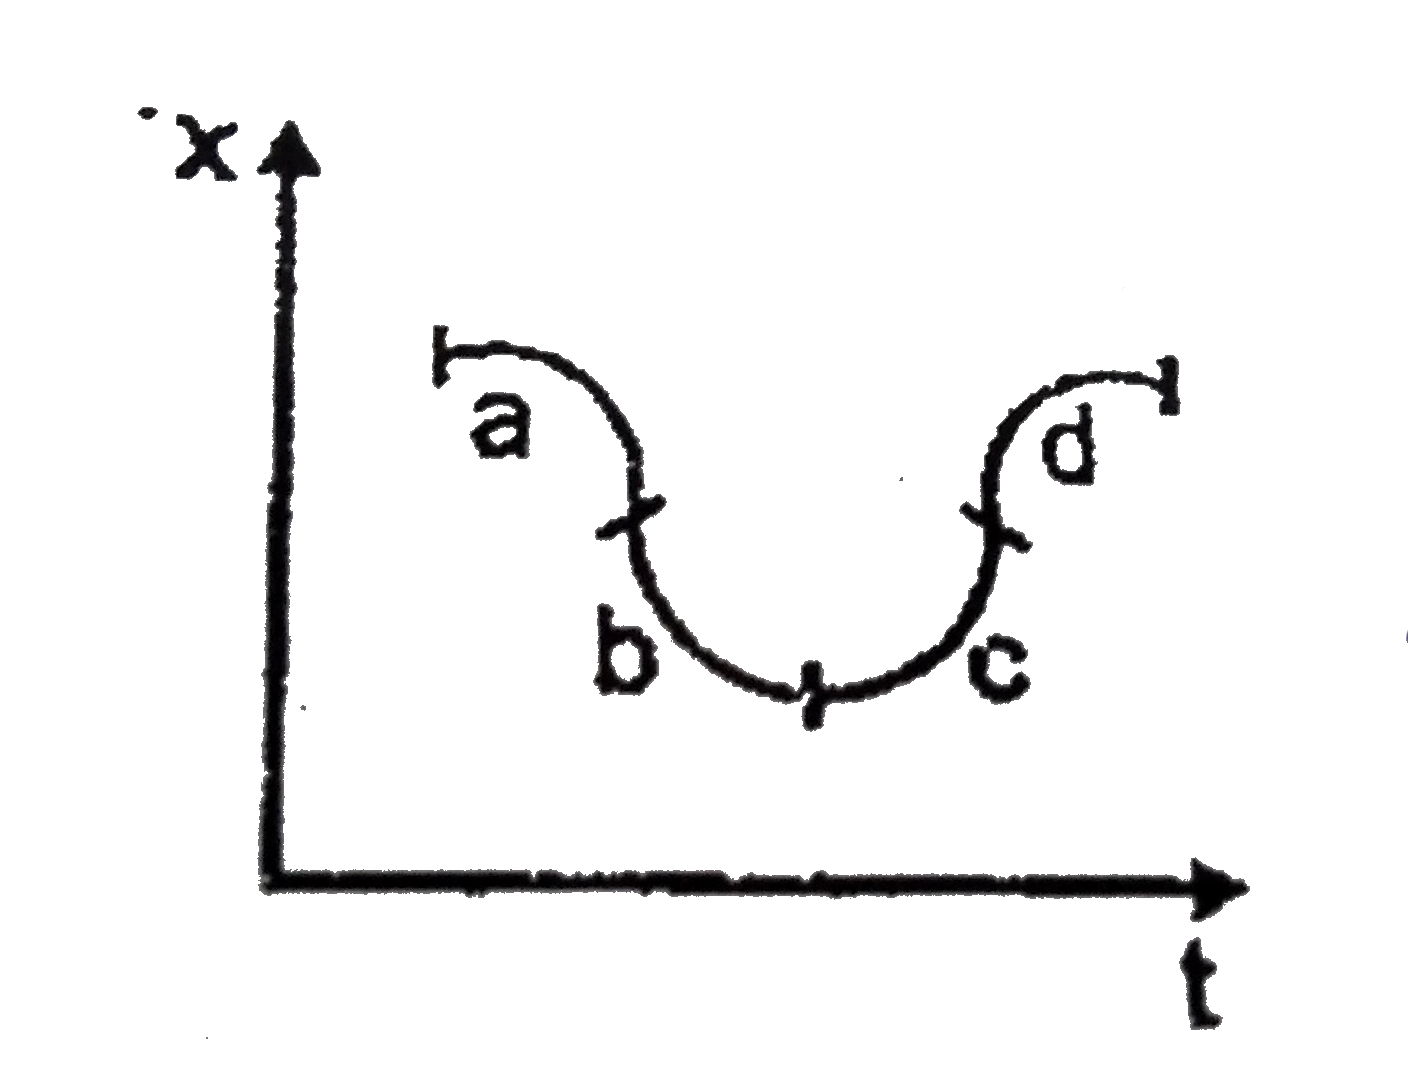
The graph to the right is a plot of position versus time. For which labeled region is the velocity positive and the acceleration negative?
a
b
c
d
The correct Answer is:D
For d
slope dx/dt is
+ve, so velocity is +ve
But d.(dxdt)dt is -vebecause slope decreasing
so d.(dxdt)dt=d2xdt2 is -ve, therefore acceleration is -ve
Topper's Solved these Questions
Similar Questions
A particle is moving along x-direction with a constant acceleration a. The particle starts from x=x0 position with initial velocity u. We can define the position of the particle with time by the relation
x=x0+ut+12at2
plot the position of the particle in relation with time is following situations
(i) If initial position of the particle is on negativ x-axis, initial velocity is positive and acceleration is negative.
(ii) If initial position is positive, initial velocity is negative and acceleration is positive.
View SolutionThe position time graph of a particle is shown below. The point where velocity is negative and acceleration is positive is х a b
View Solution
Knowledge Check
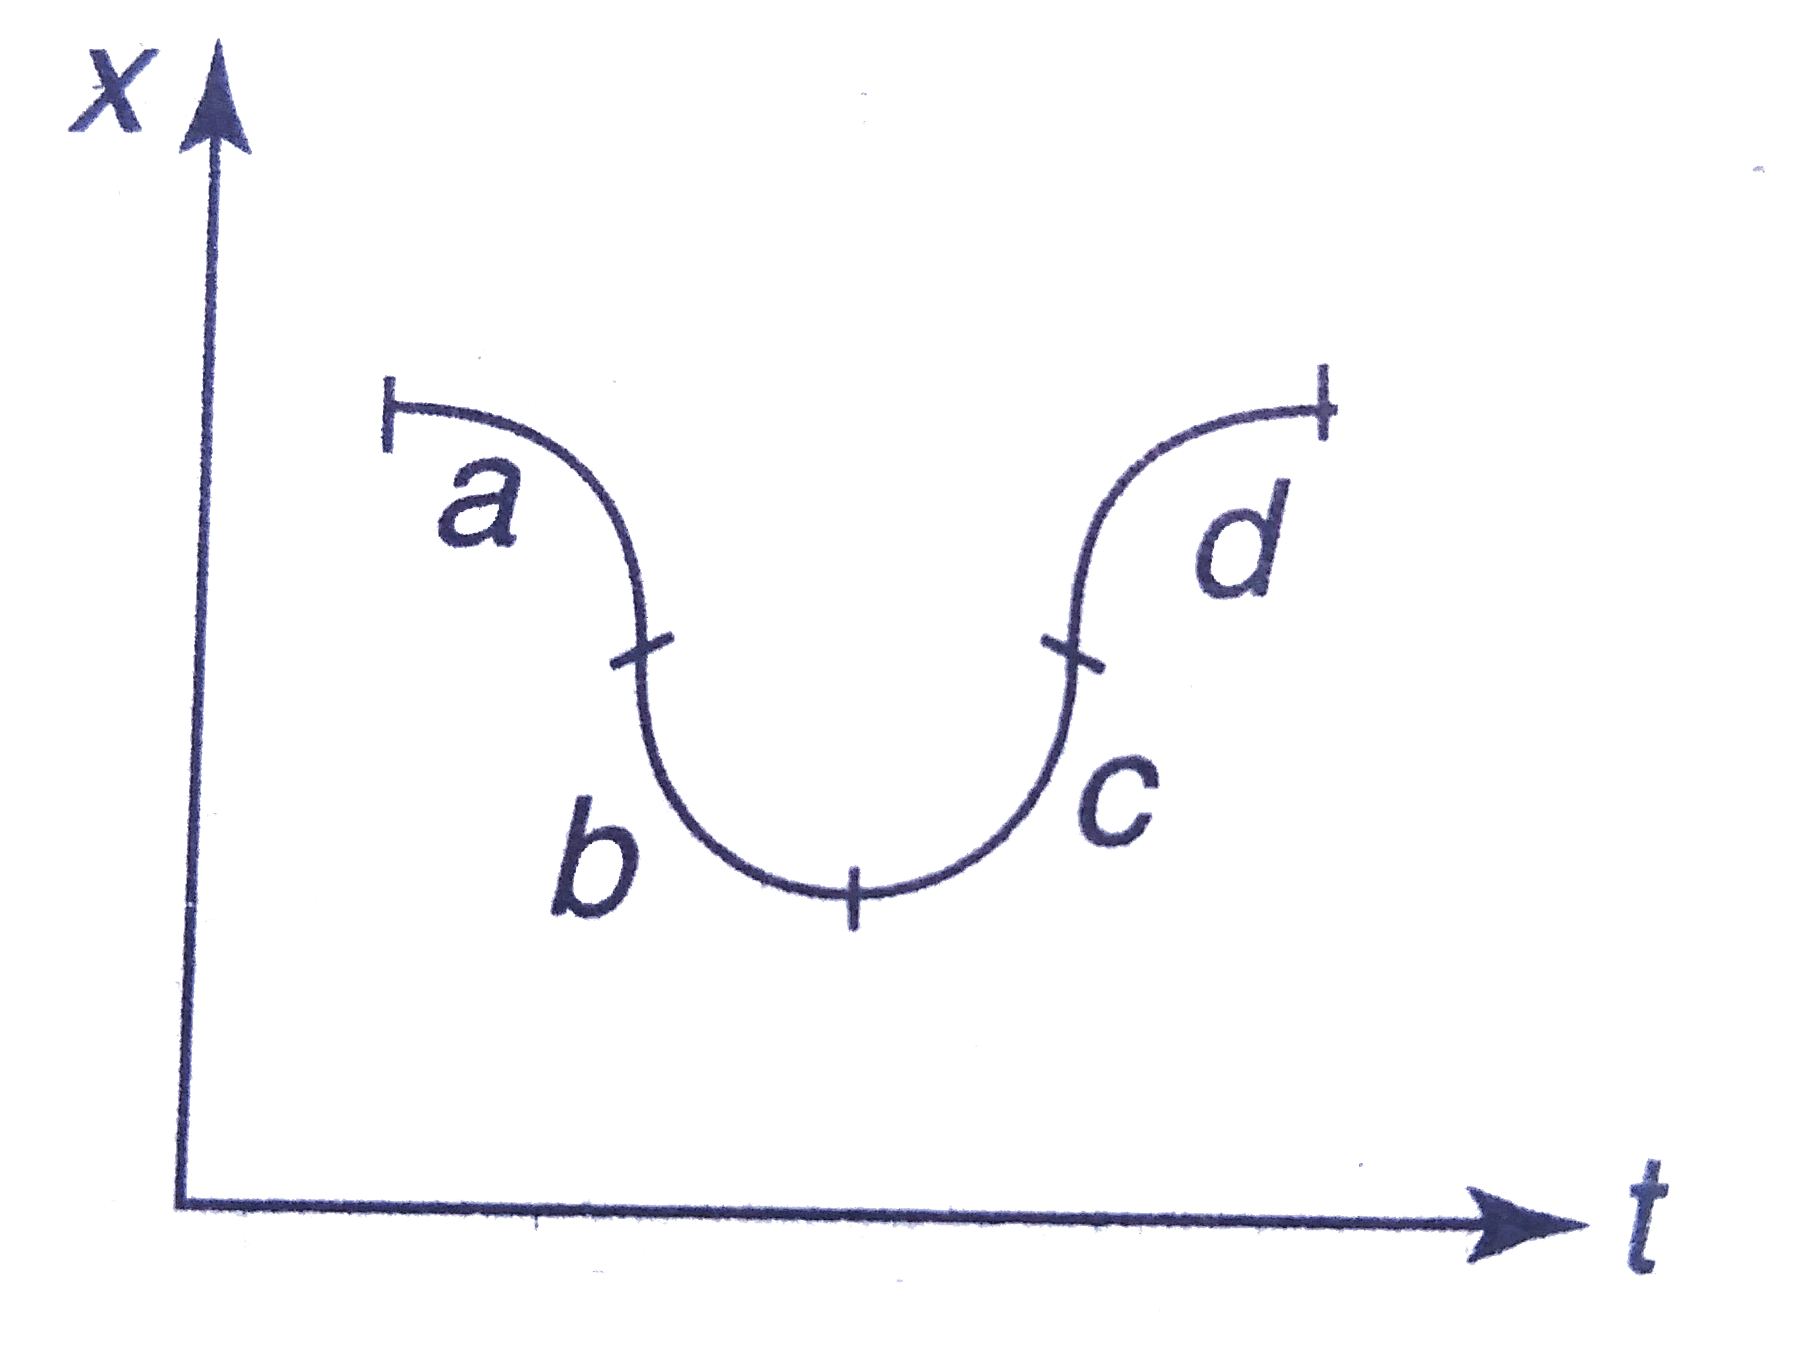
The graph to the right is a plot of position versus time. For which lebeled region is the velocity positive and the acceleration negative ?
 AaBbCcDd
Which graph represents positive acceleration ?
A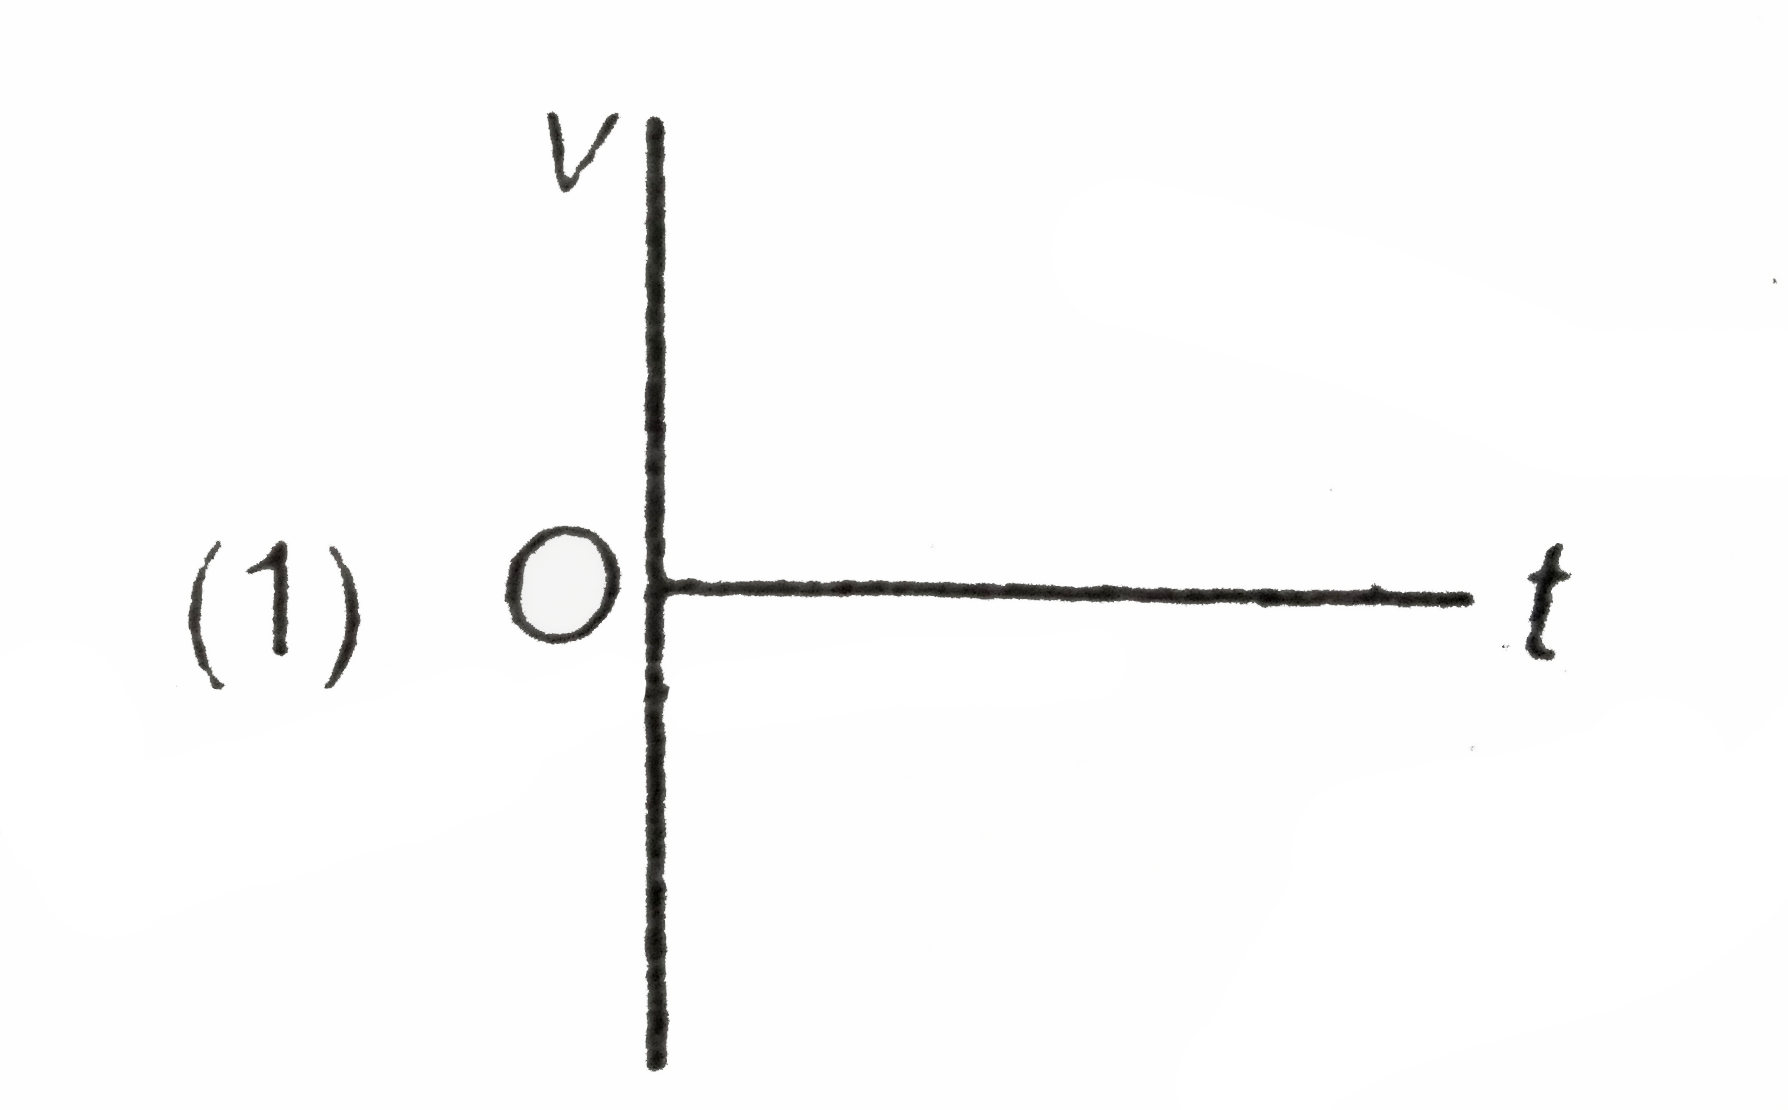 B
B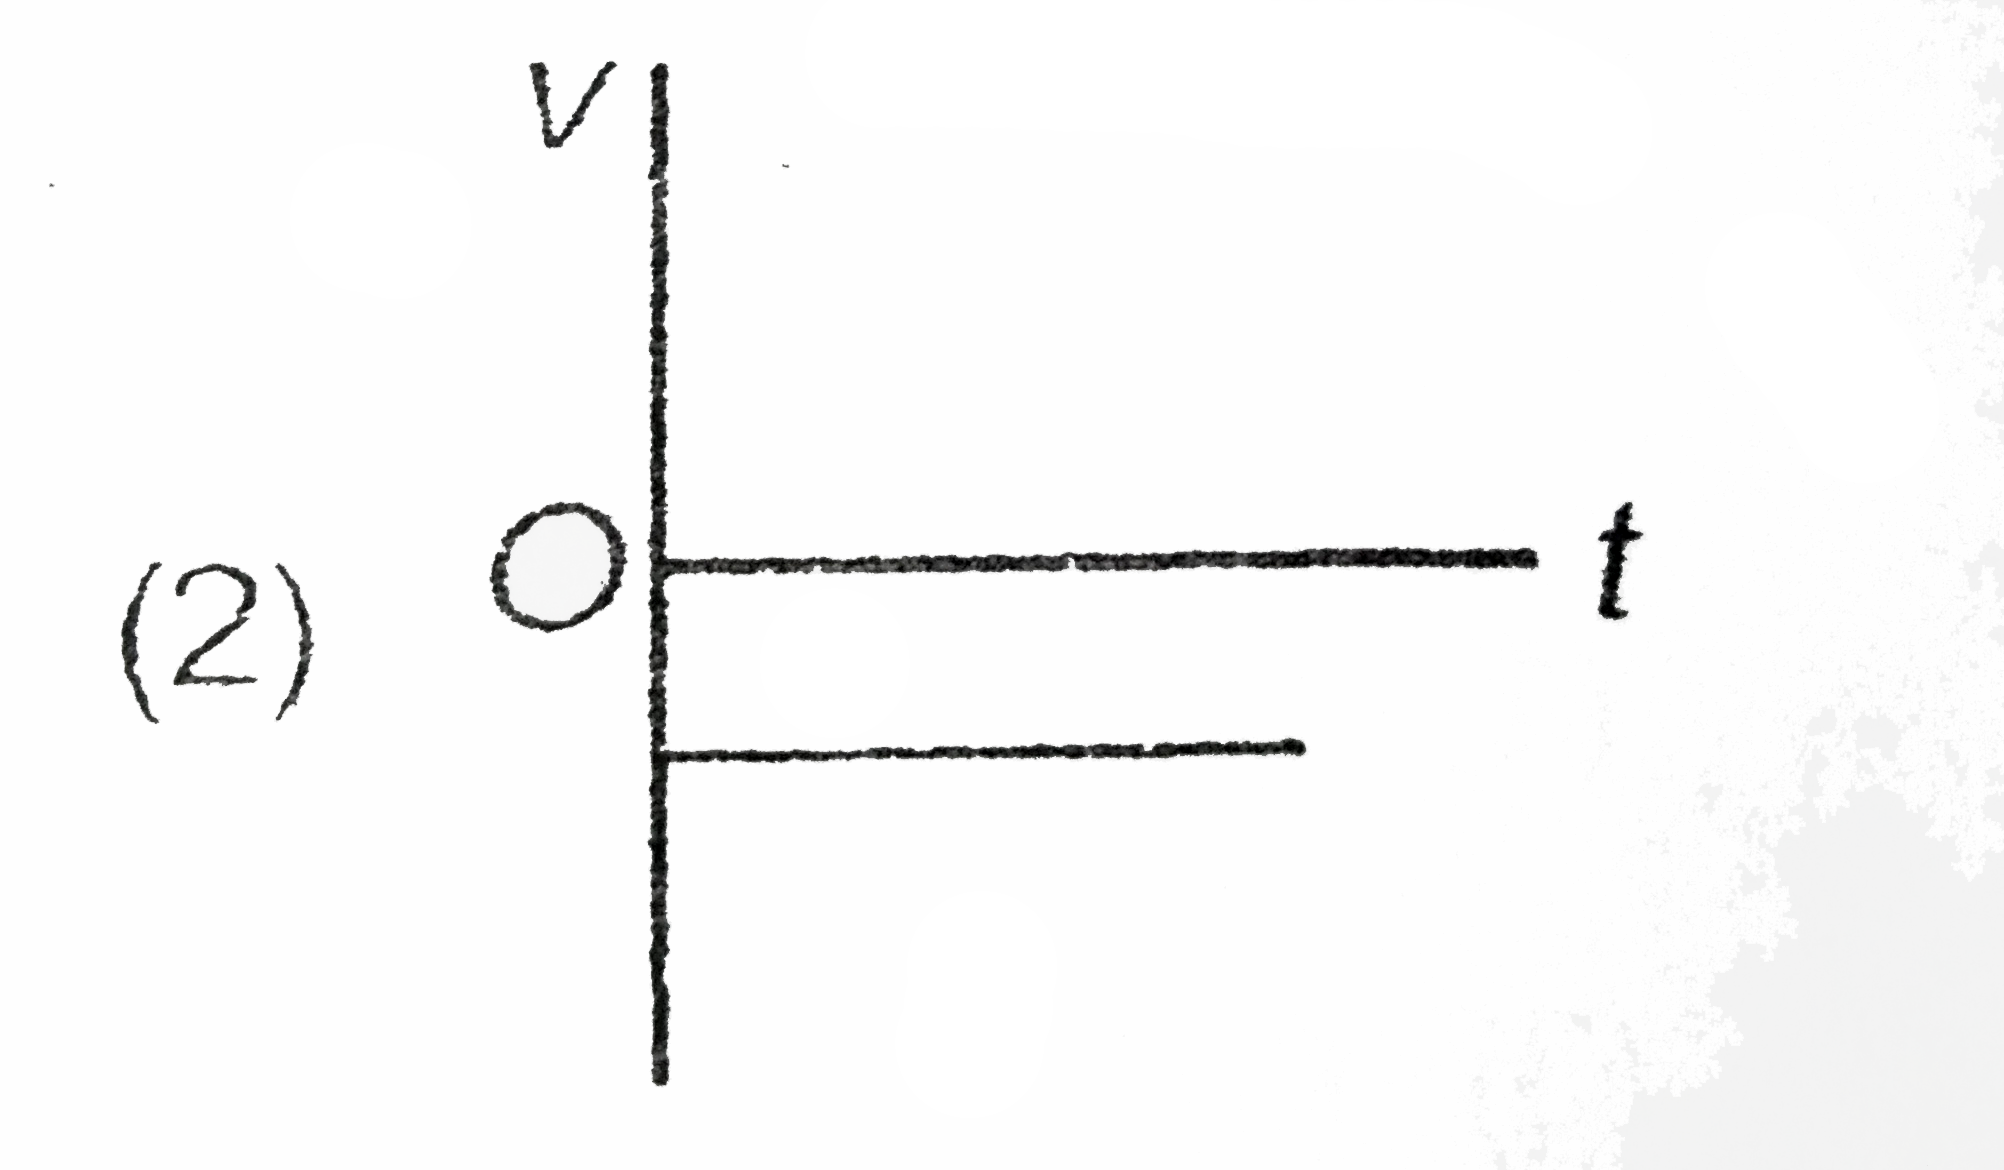 C
C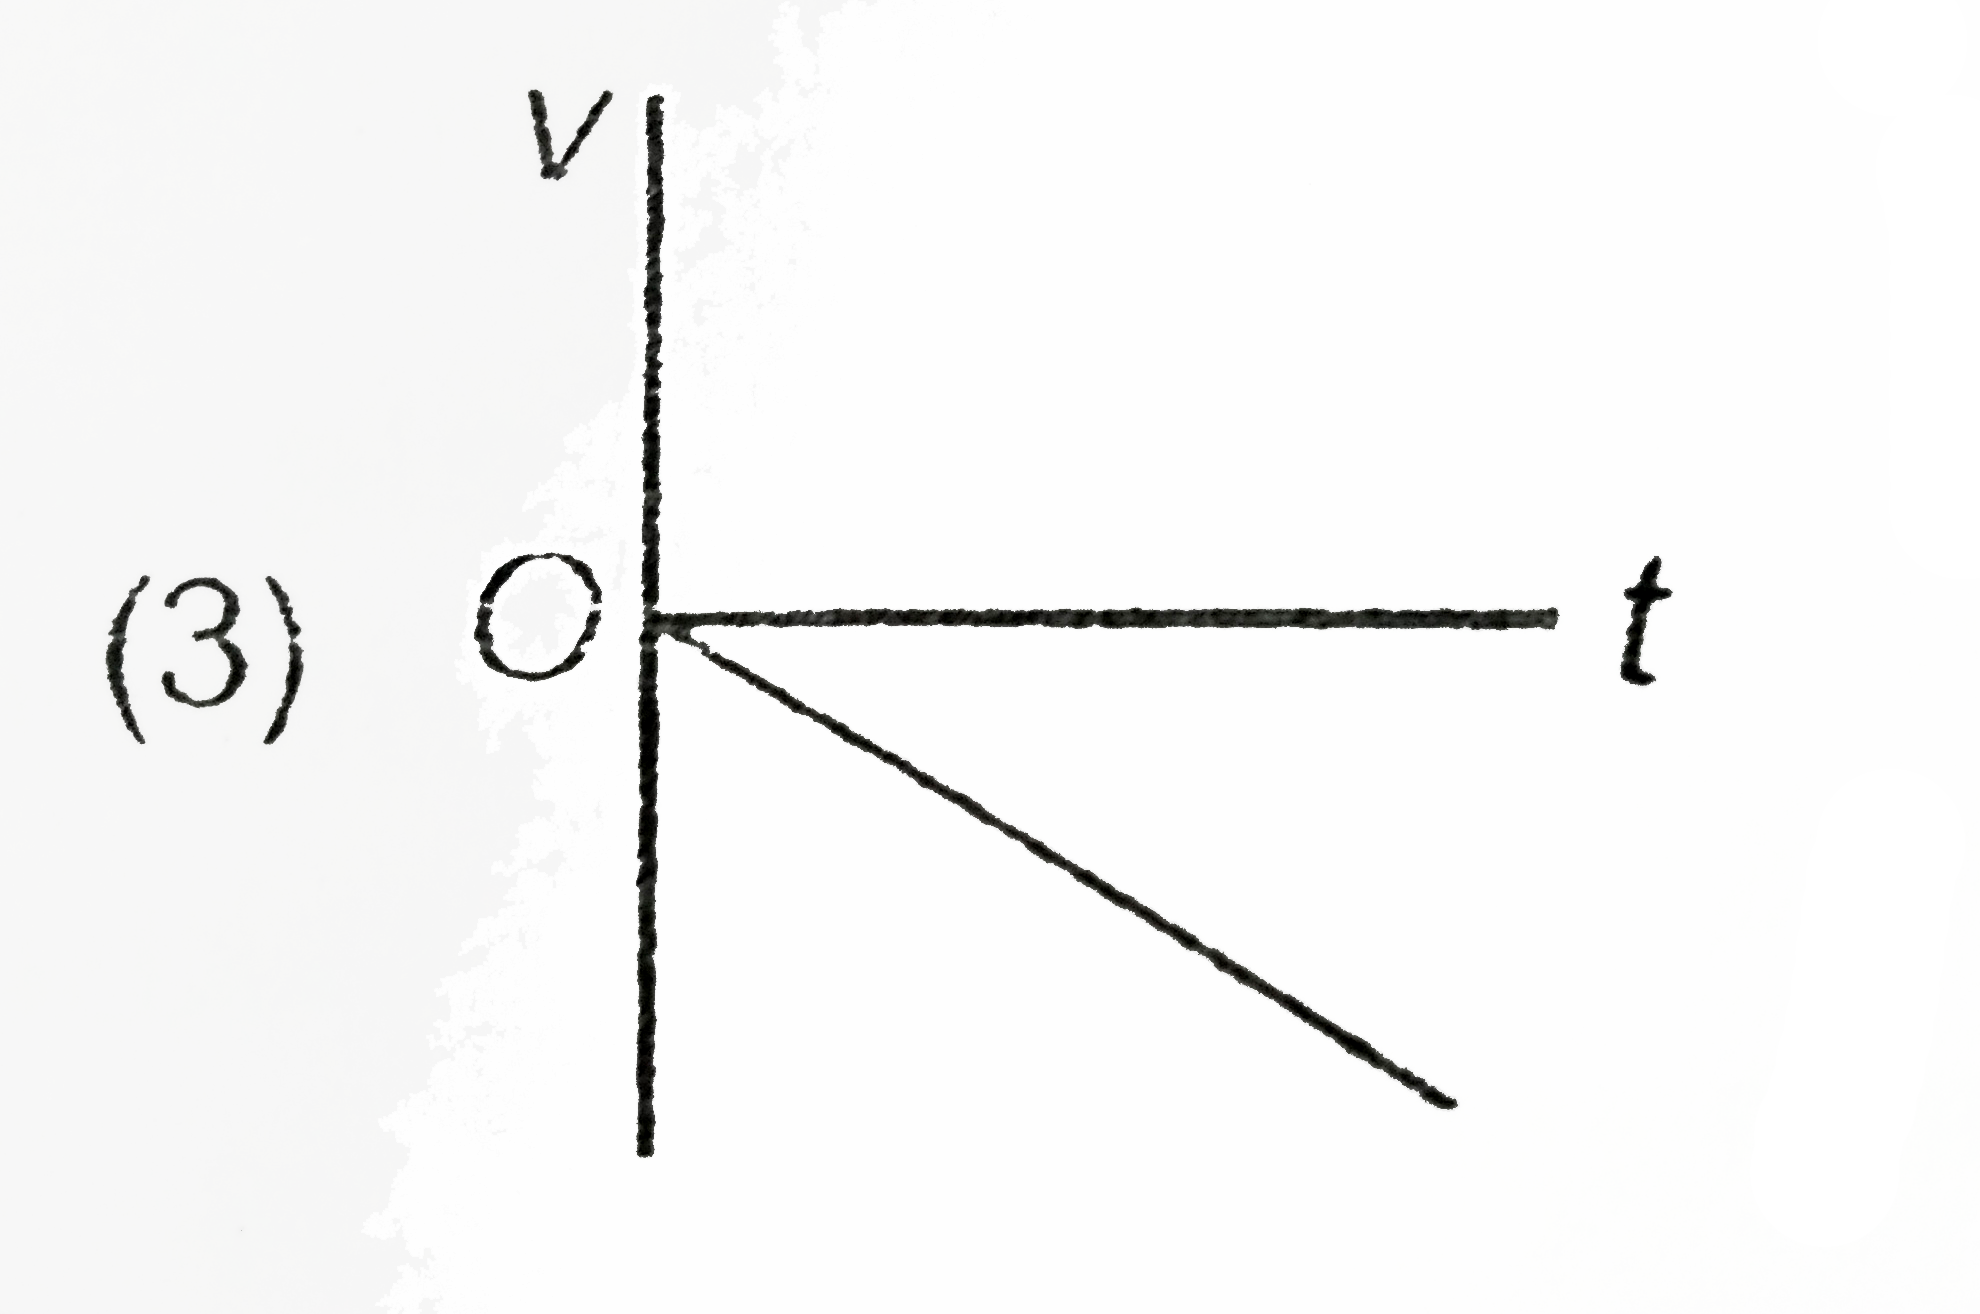 D
D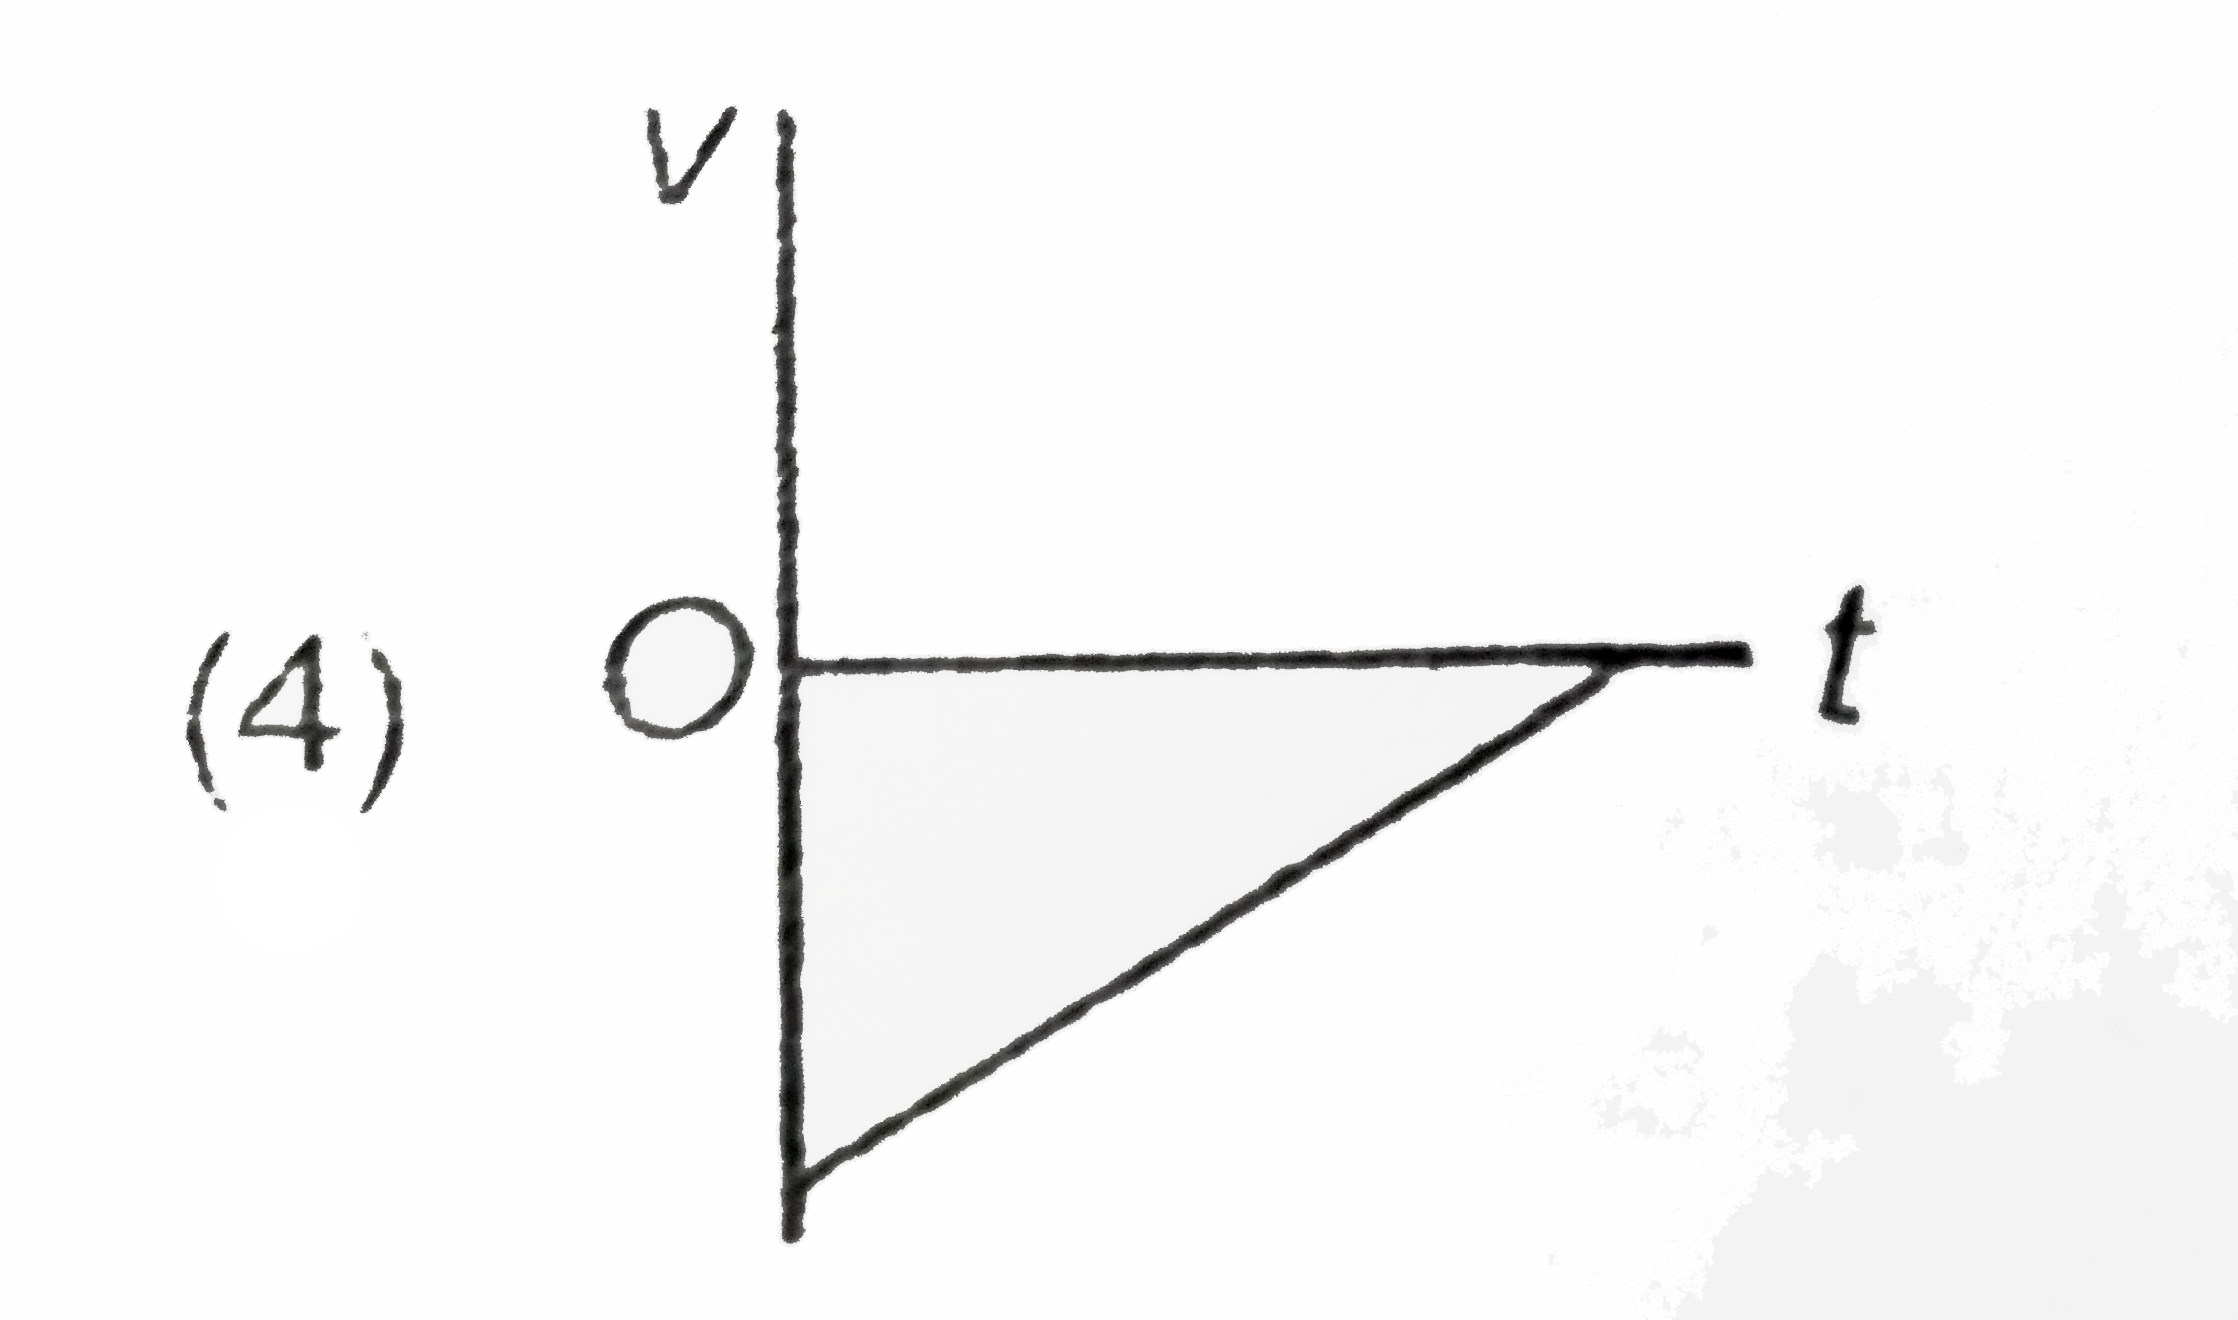
The graph plotted between concentration versus time
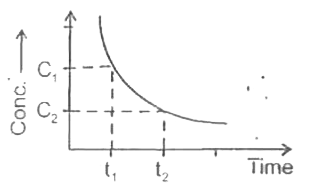 AIt gives rate of disappearance of reactantBRate =(d[C2−C1)])t2−t1CBoth (1) & (2)DIt predicts the order of reaction
Position (x) versus time (t) graph of a particle is as shown. The velocity is zero at?
View SolutionDraw distance time graph of a body moving with :
(i) positive acceleration
(ii) negative acceleration.
View SolutionCan position-time graph have negative slope ?
View SolutionWhat does negative slope of a position - time graph signify ?
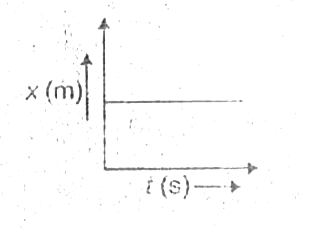
View SolutionThe position - time graph of an object is given below. What is the velocity of the object?
View Solution