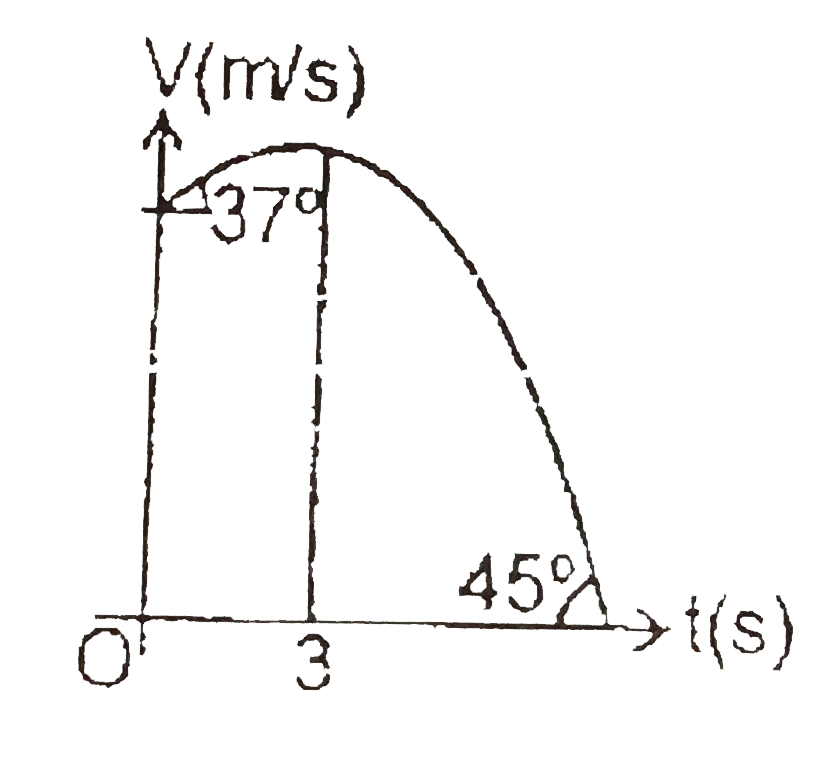
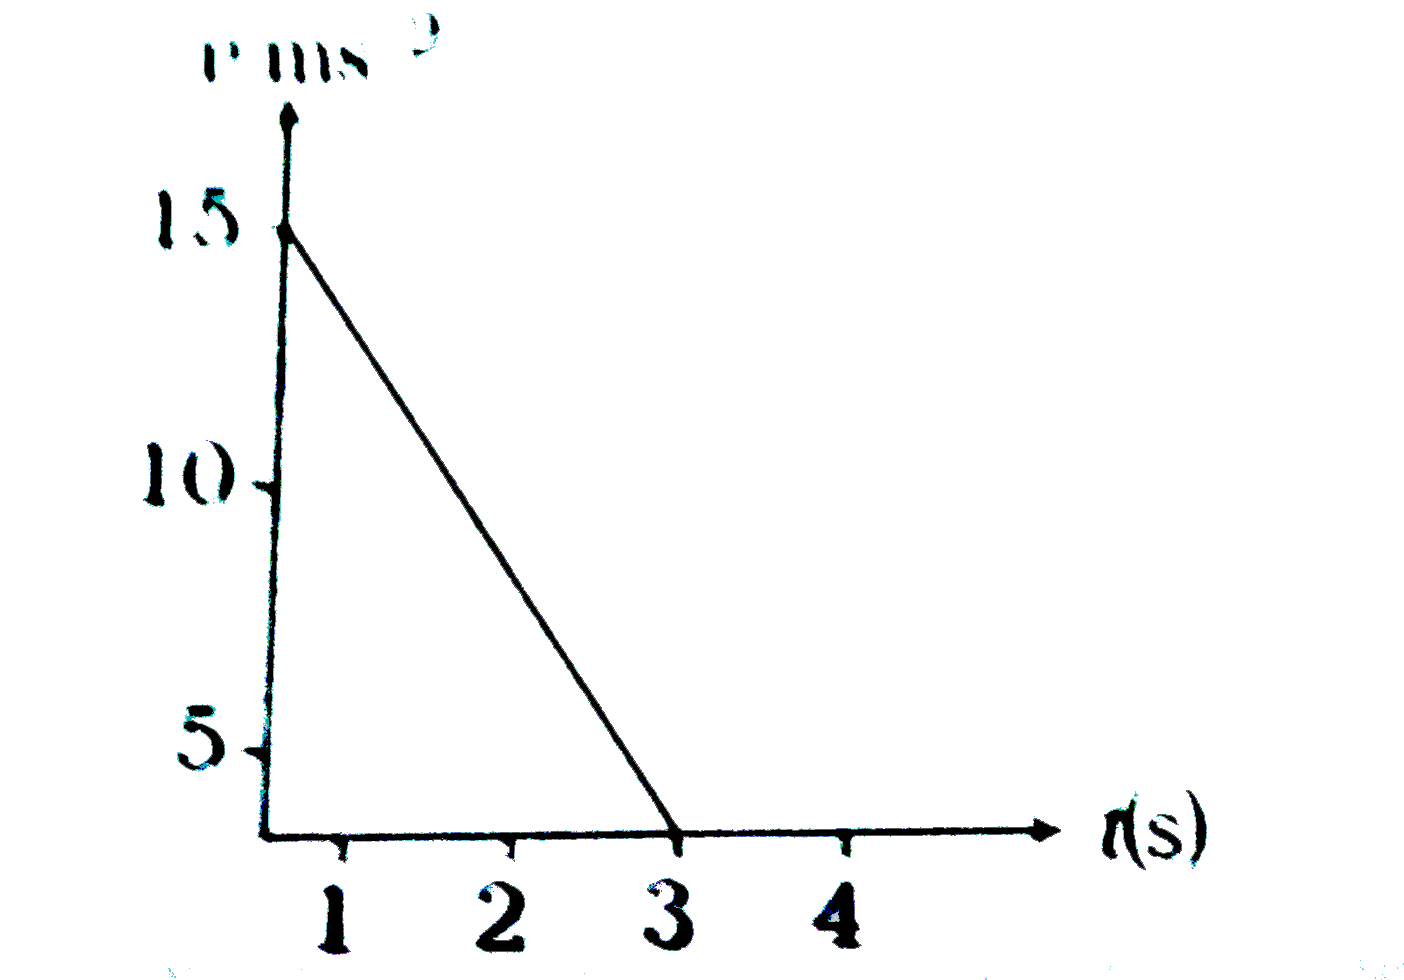
A particle starts moving in a straight line under an acceleration varying linearly with time. Its velocity time graph is as shown in figure. Its velocity is maximum at t = 3 sec. The time (in sec) when the particle stops is (tan37∘=3/4)
The correct Answer is:7
a = C - Kt
At t = 0, a=tan37∘
34=C
at t=3,a=0
0=34−K×3⇒K=14
a=34−14t
Particle stops, when a = −tan45∘=−1
−1=34−14
t4=74⇒t=7sec
Topper's Solved these Questions
Similar Questions
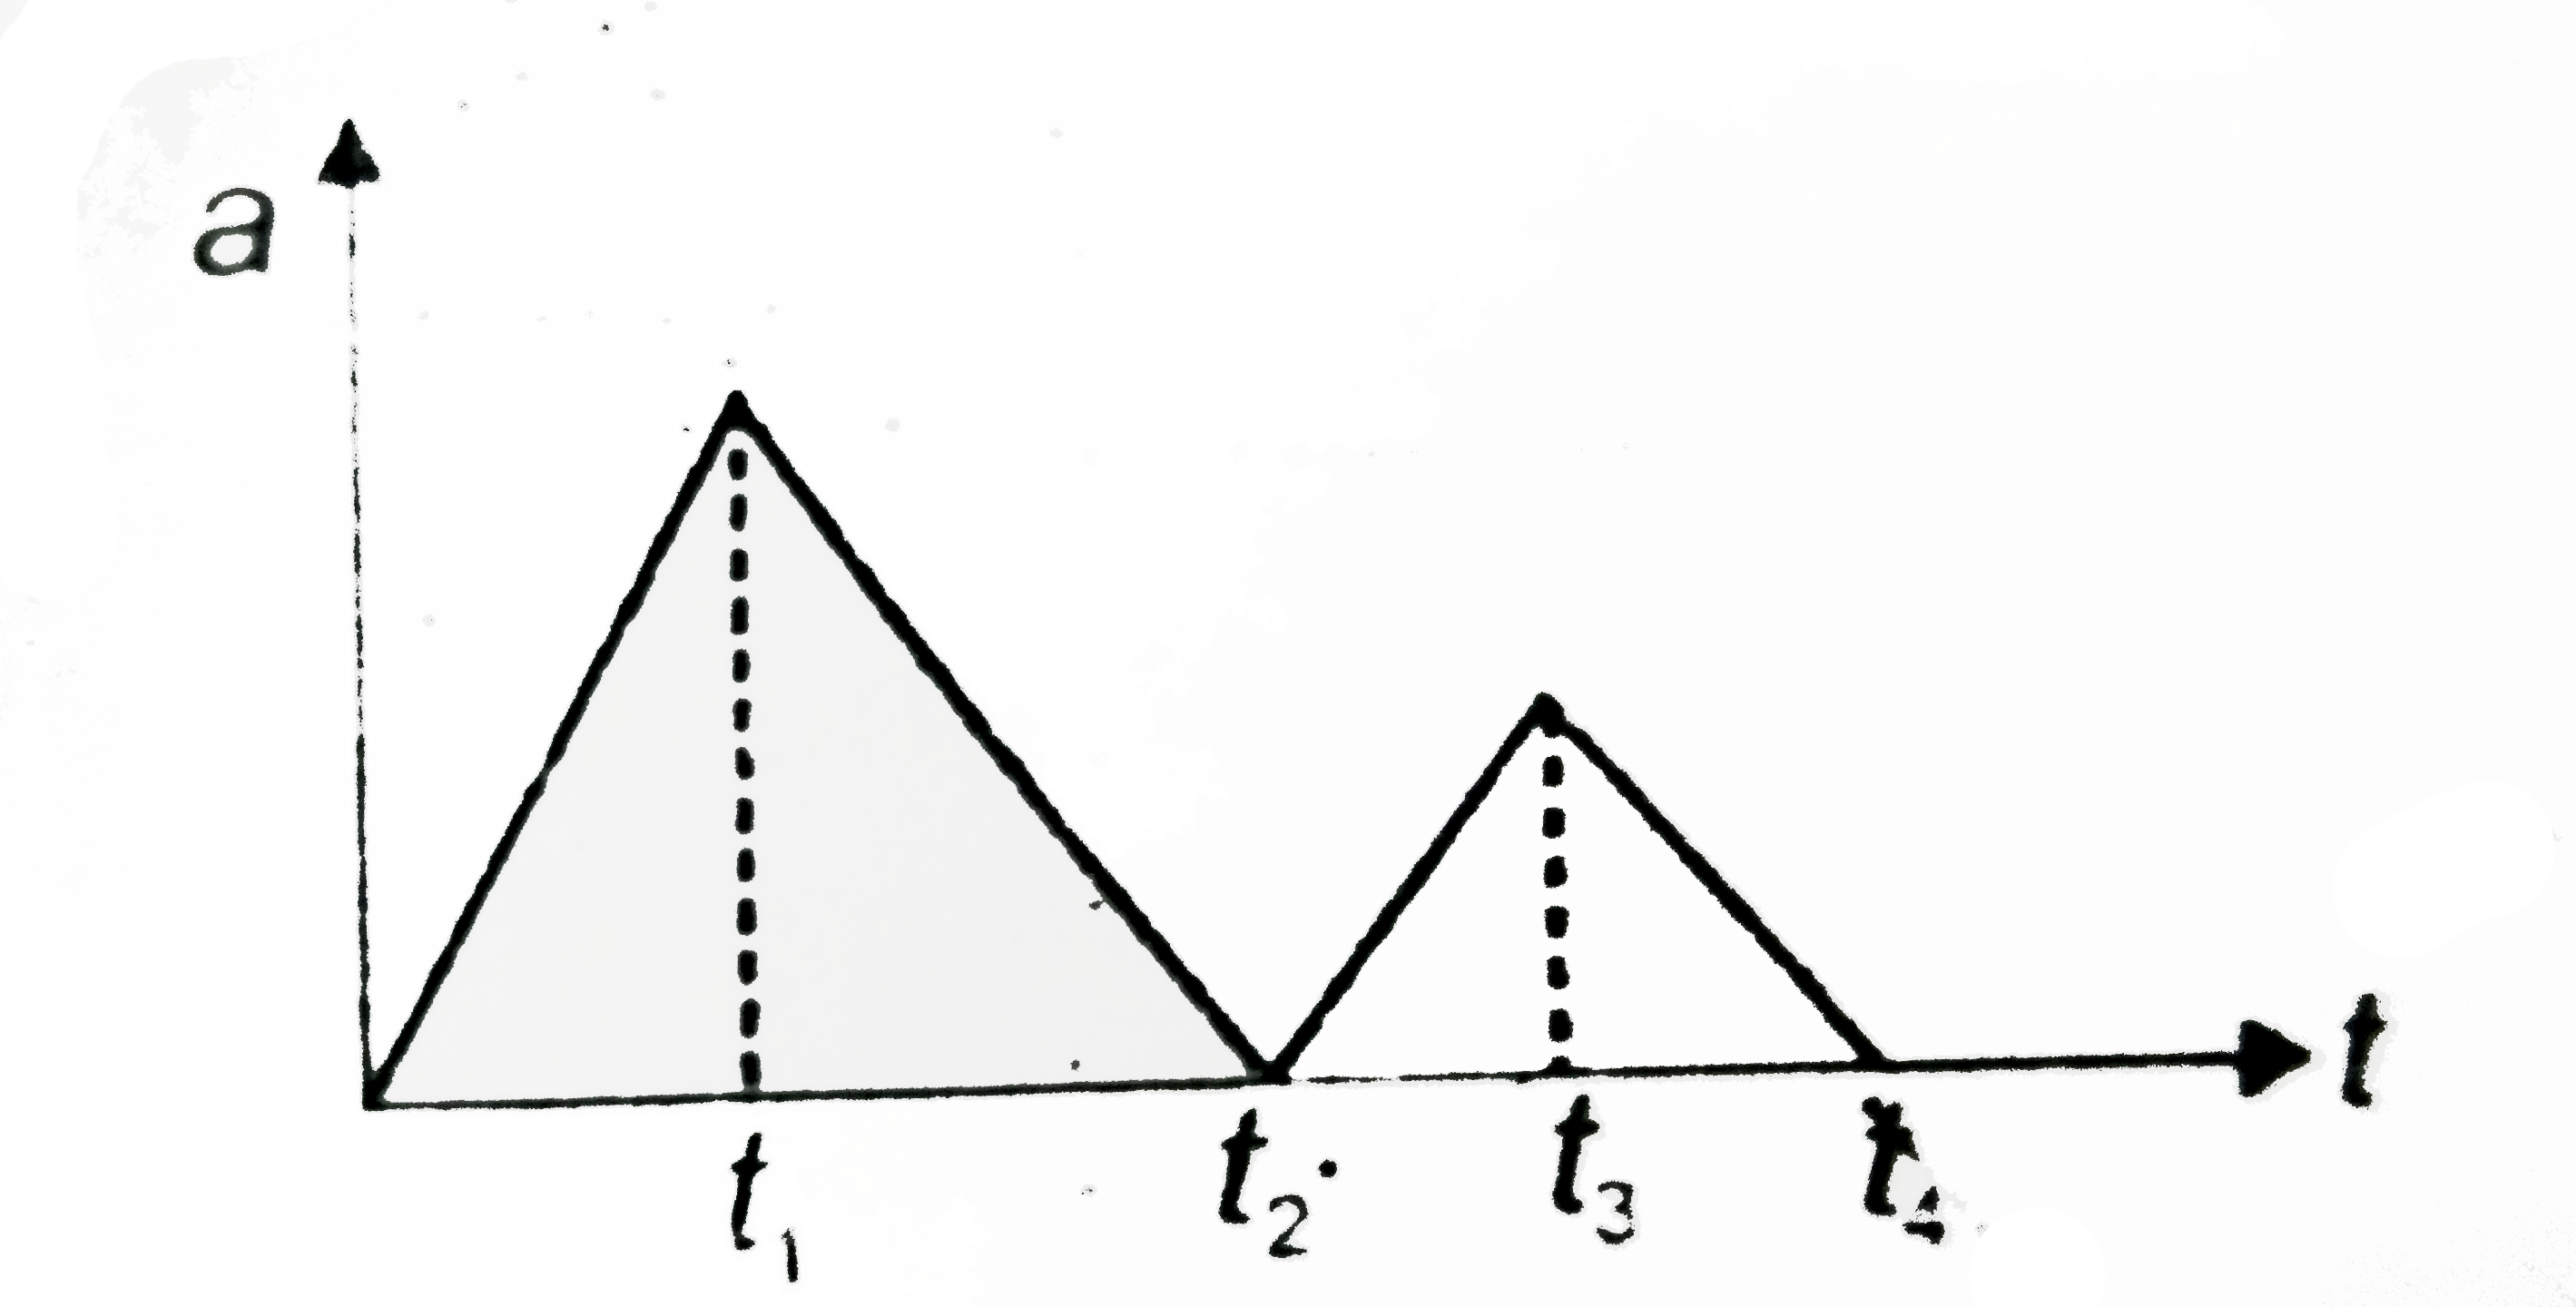
A particle starts moving from rest on a straight line. Its acceleration a verses time t is shown in the figure. The speed of the particle is maximum at the instant
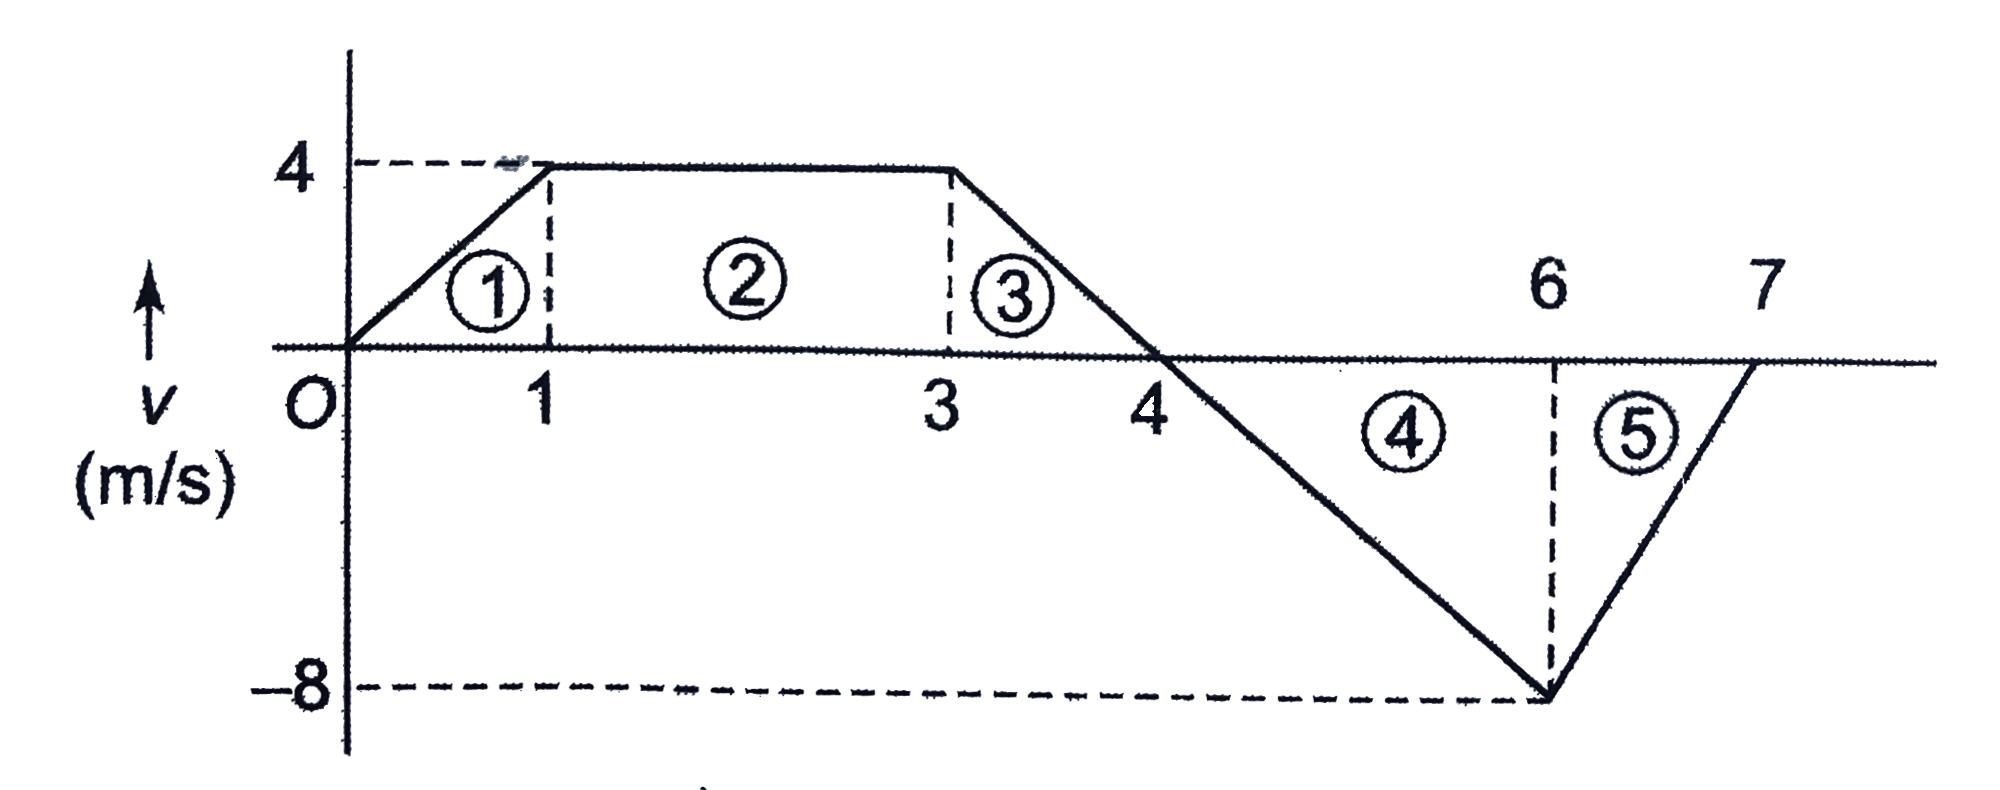
View SolutionA particle is moving in a straight line along the xaxis. Its velocity-time graph is as shown. Sketch the displacement-time and distance-time grapgs.
View Solution
Knowledge Check
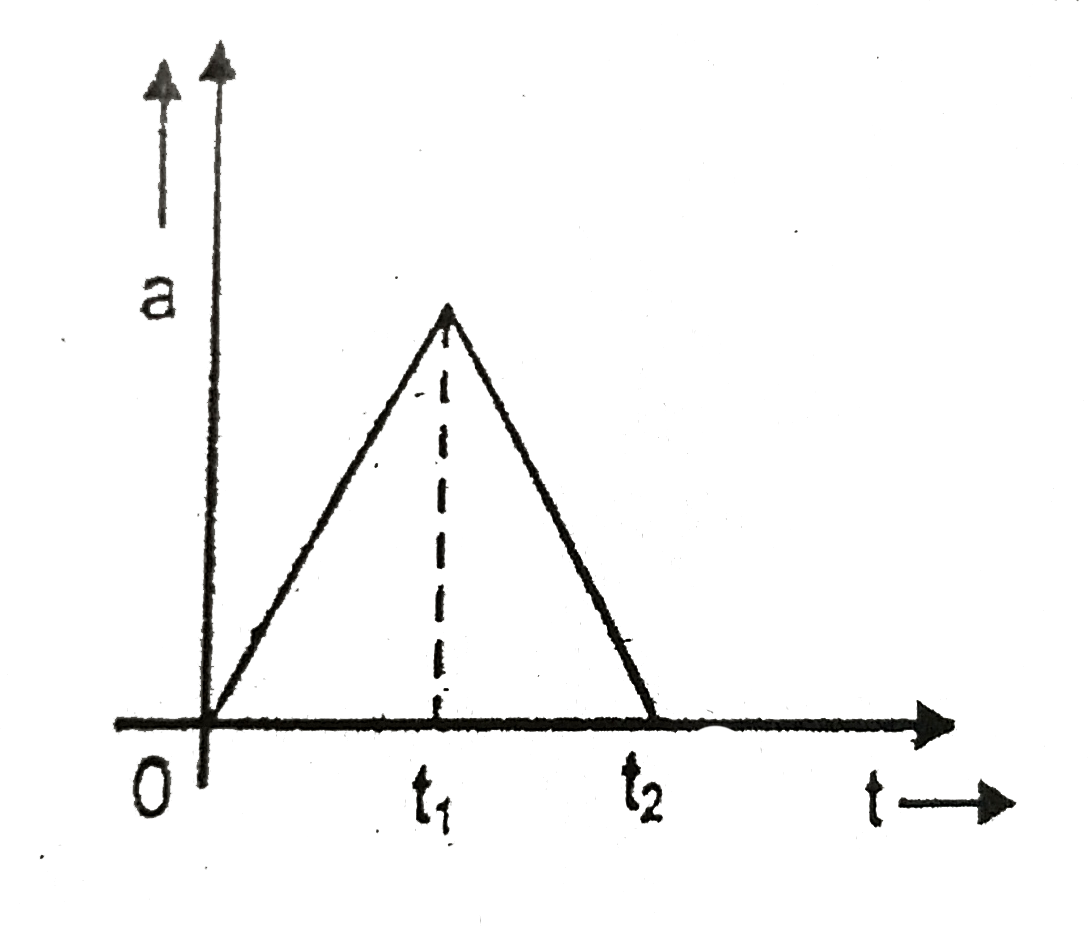
A particle starts to move along a straight line. The acceleration versus time graph of particle is as shown in figure. The correct velocity versus time graph is :
 A
A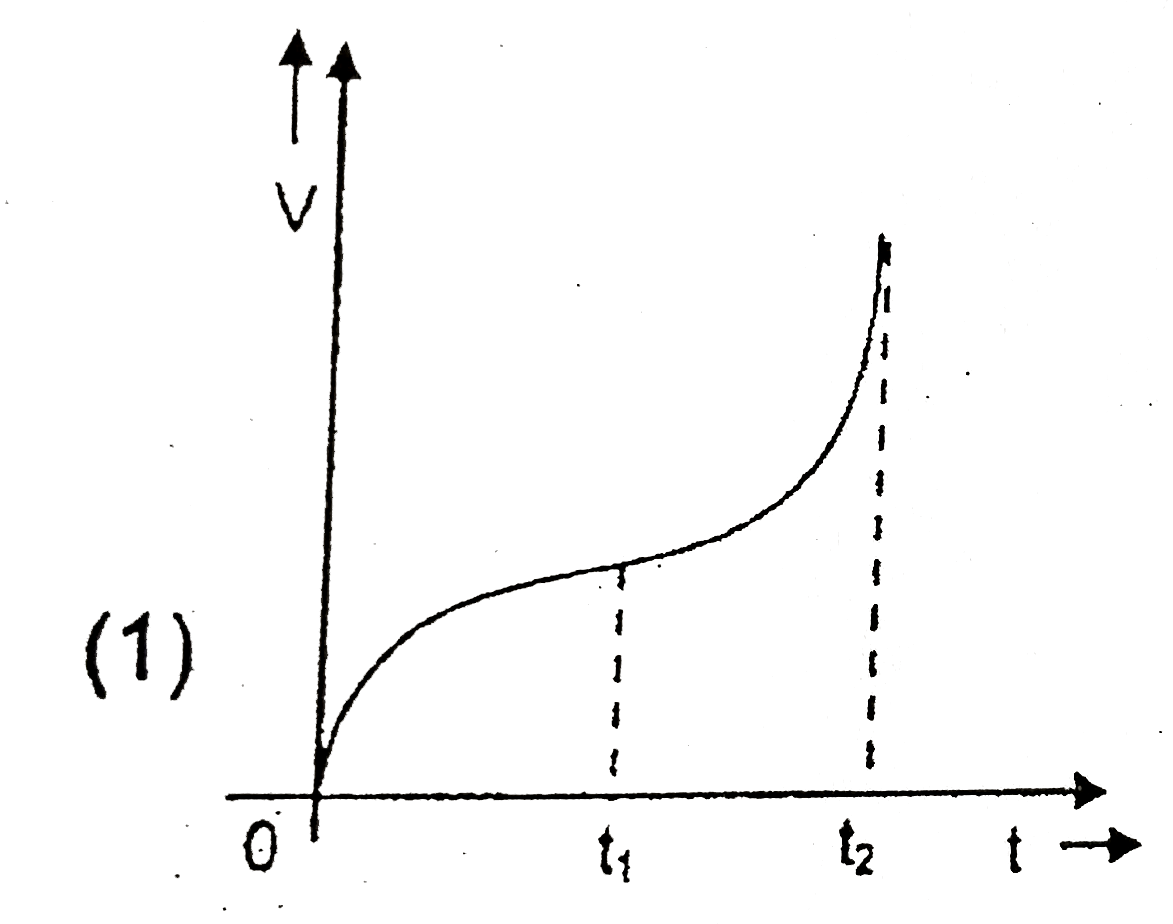 B
B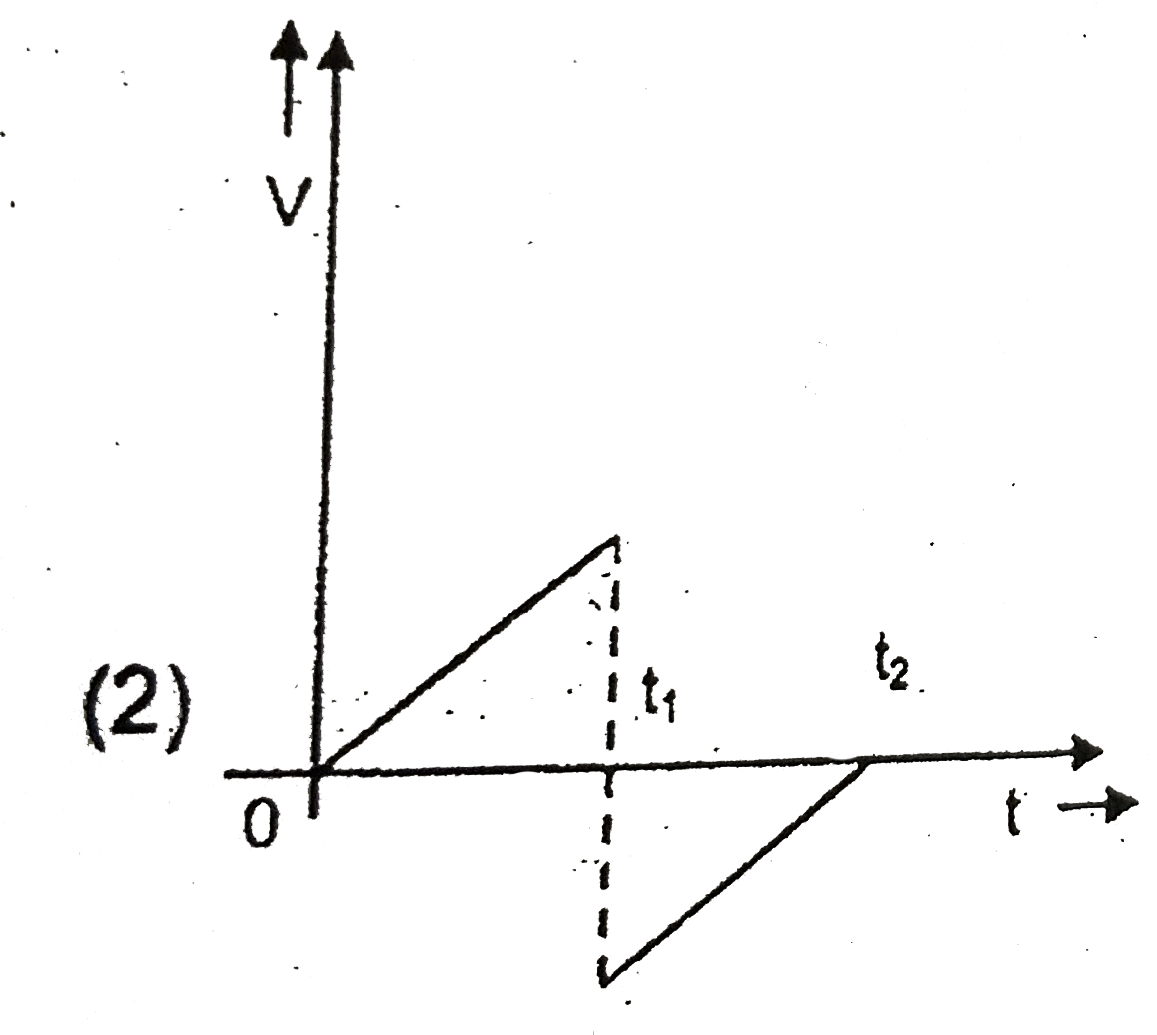 C
C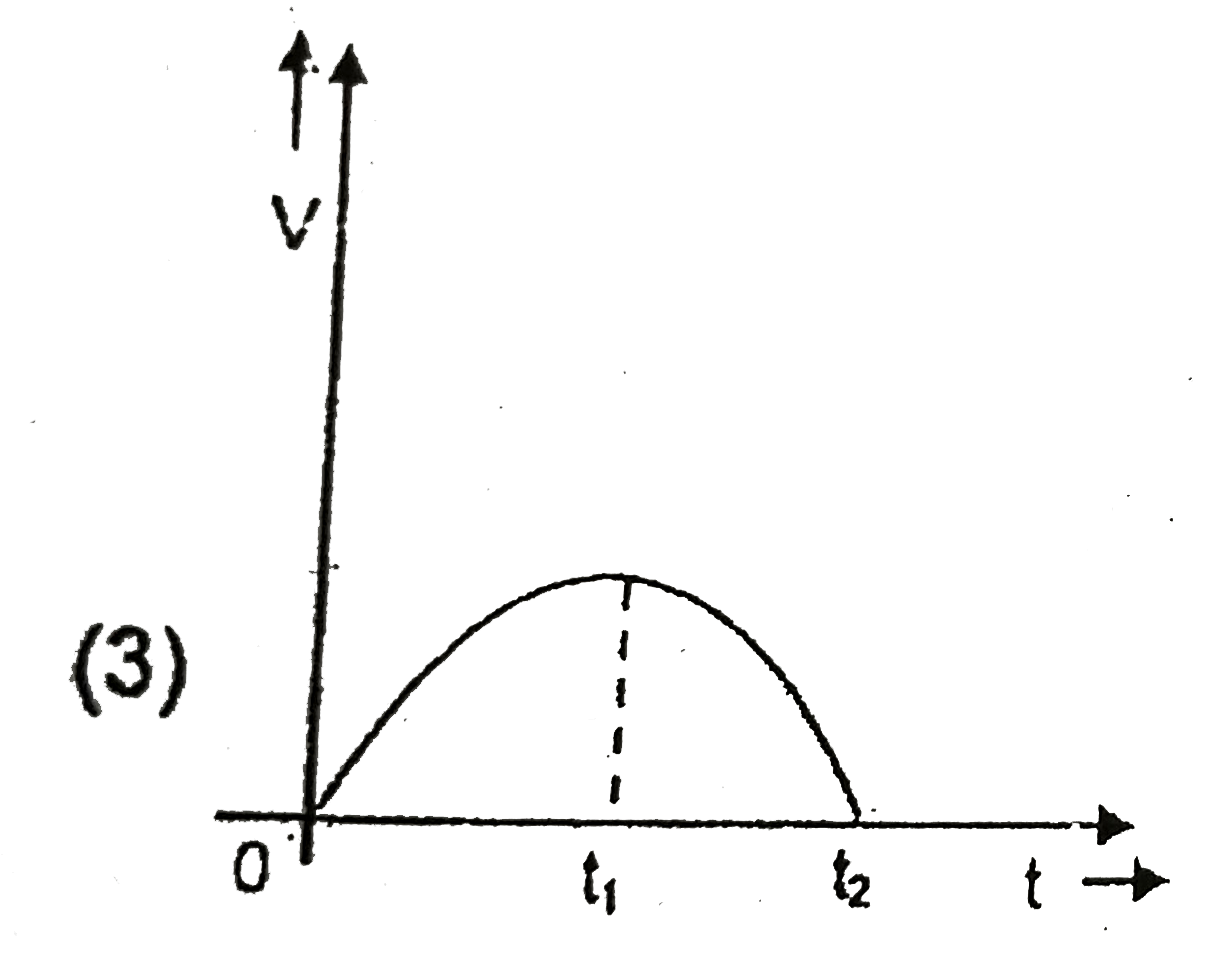 D
D
A particle starts moving from rest in a from rest in a straight line. Its acceleration vs time (a−t) graph is shown in figure. The speed of particle is maximum at.
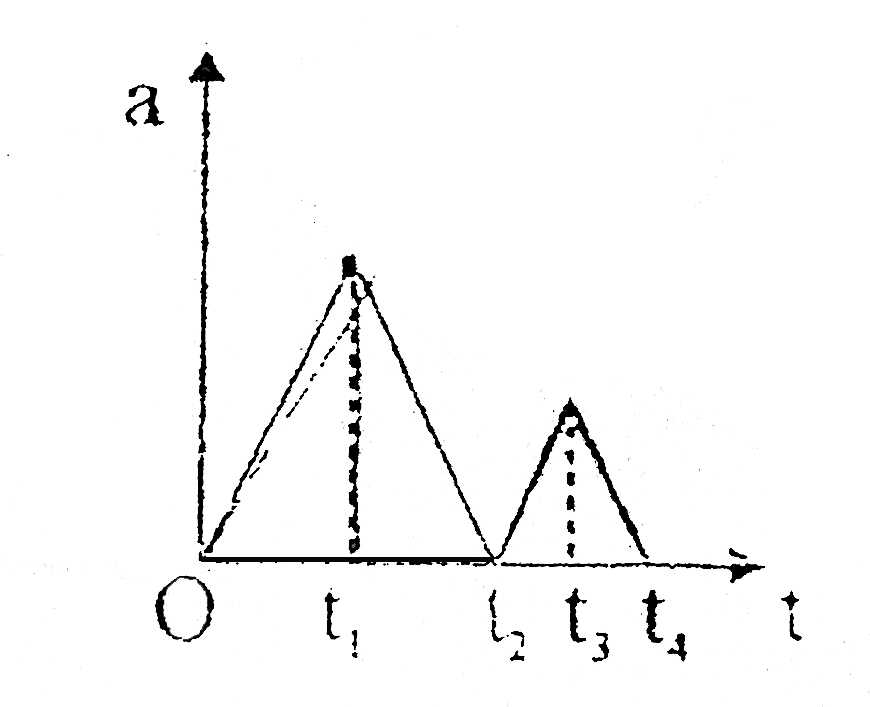 At1Bt2Ct1Dt4
The velocity - time graph is shown in the figure, for a particle. The acceleration of particle is
 A22.5ms−2B5ms−2C−5ms−2D−3ms−2
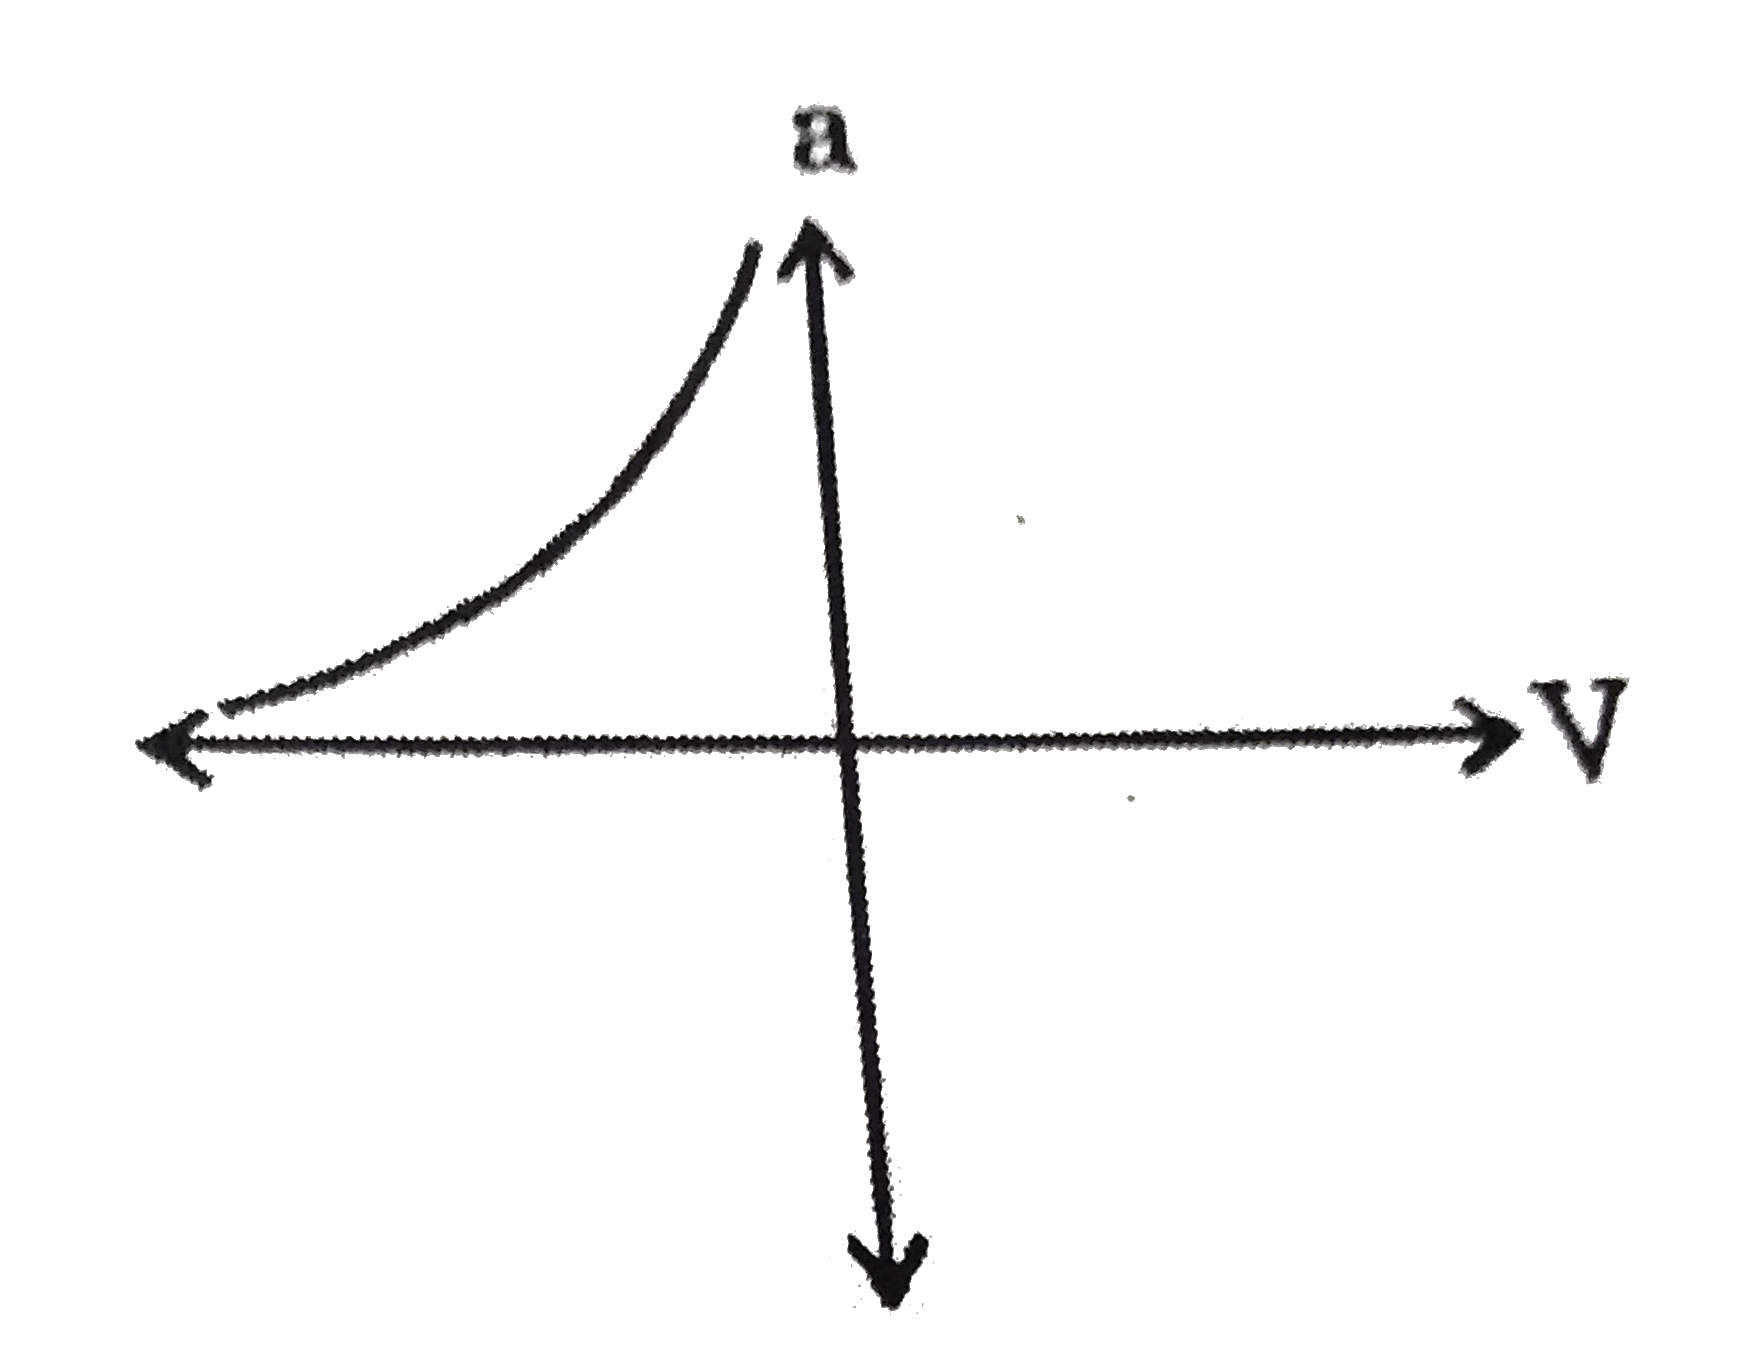
A particle moves in straight line. Acceleration of particle changes with velocity as showns in graph:
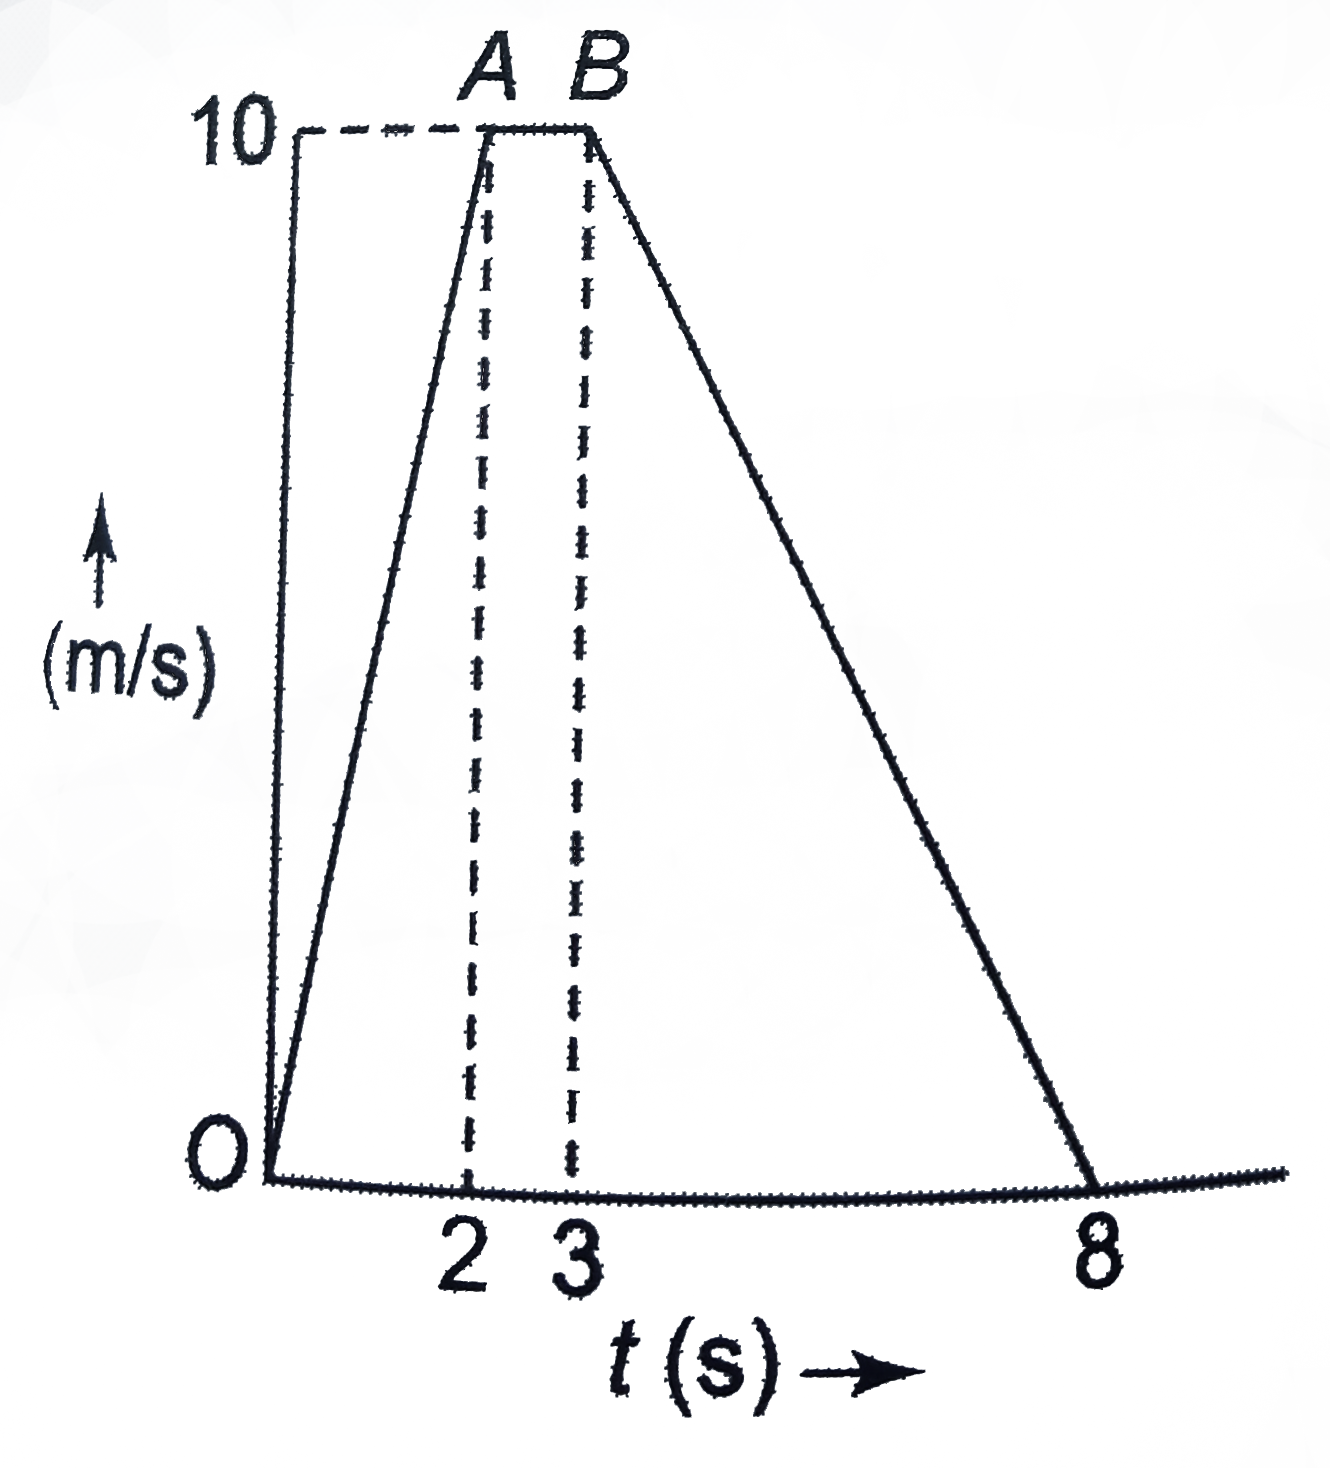
View SolutionFor a particle moving in a straight line, the velocity-time graph is as shown in the figure. Find the acceleration at time t=1s2.5s and 5s. Sketch the acceleration time graph.
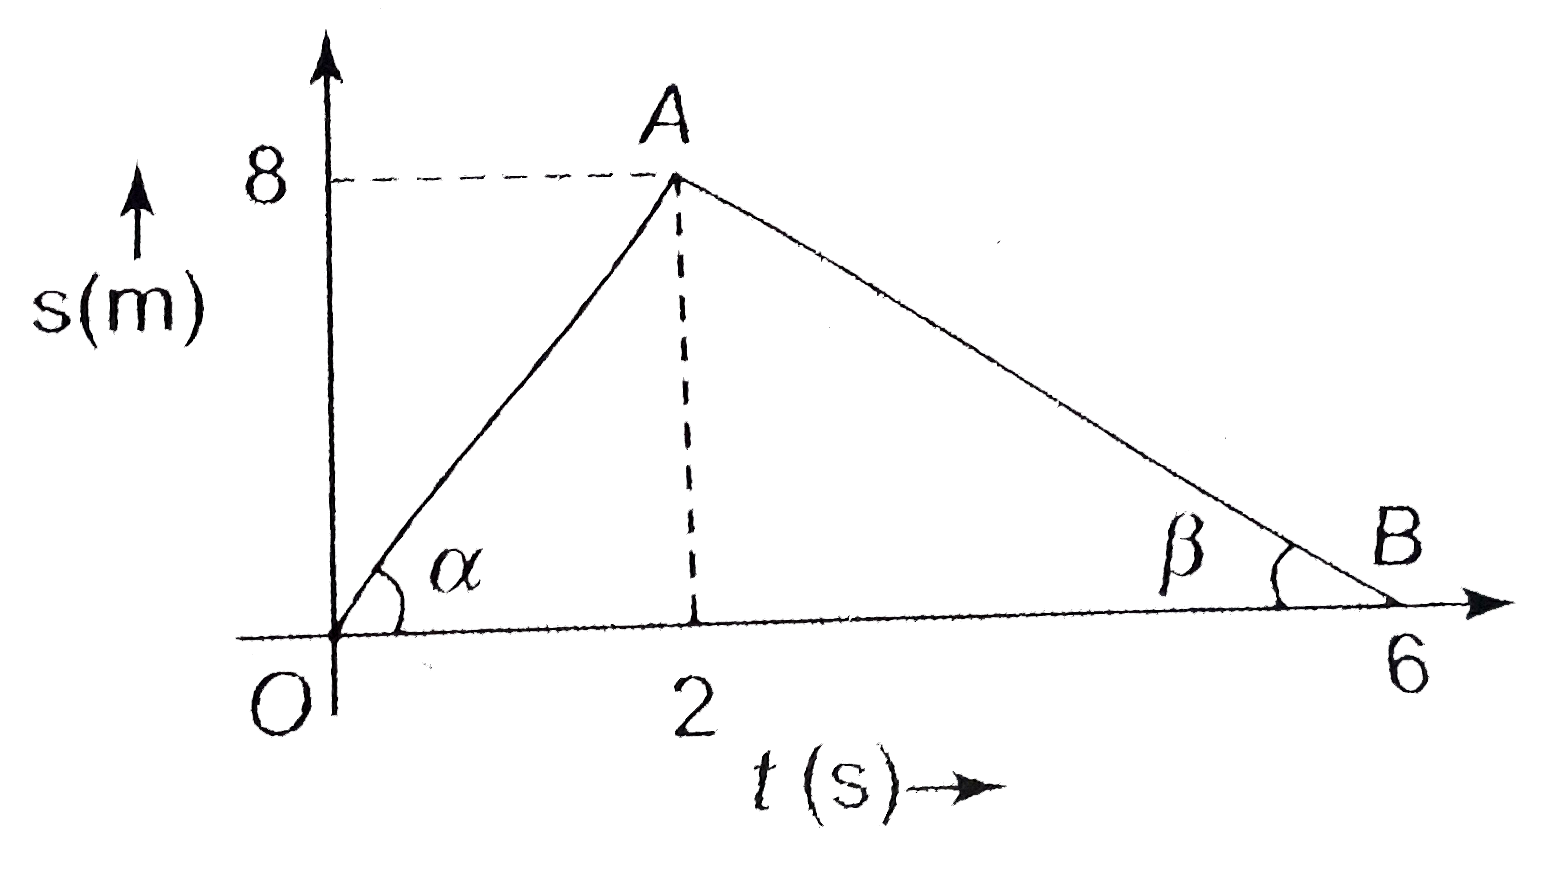
View SolutionFor a particle moving in a straight line, the position-time graph is as shown in the figure. Find the velocity of the particle at time t=1s and t=4s. Also sketch the v-t graph.
View SolutionA particle is moving in a straight line according to graph given below : (a is acceleration, v is velocity, x is position, t is time) :
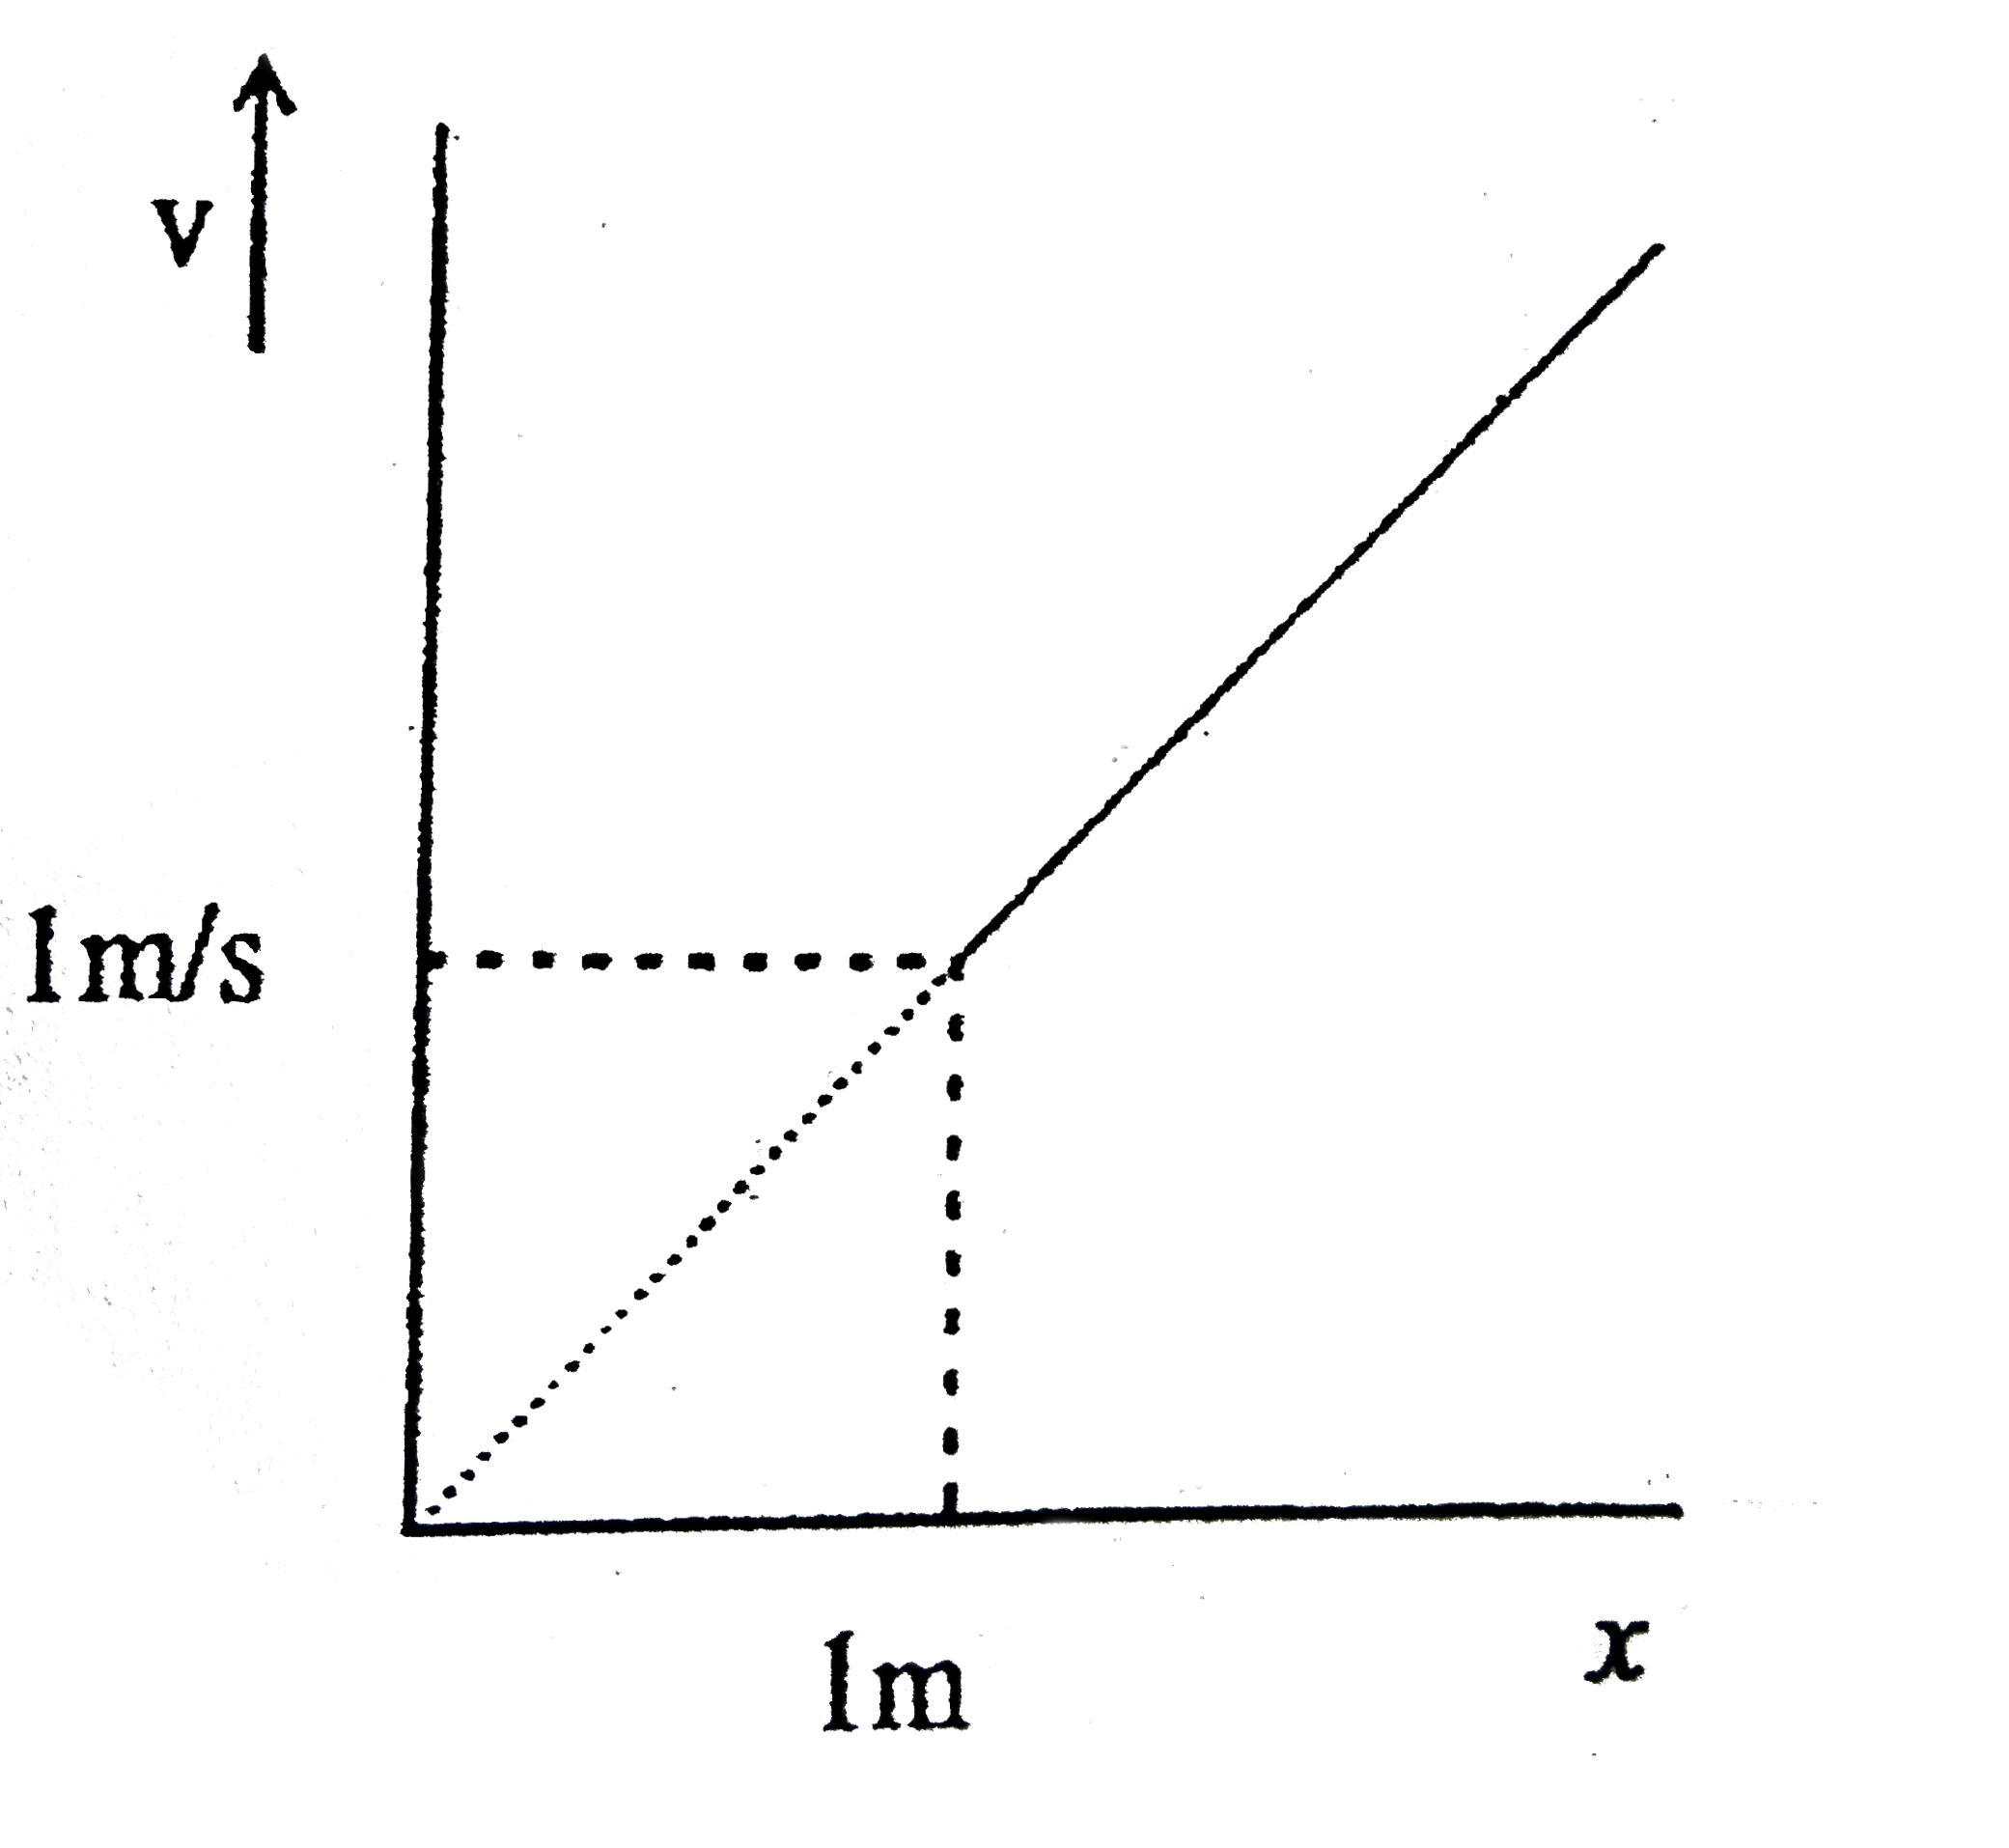
View SolutionA particle starts from rest on a straight path, Its acceleration is linearly varying with time, such that velocity of the particle at t=2 sec and t=4 sec is 6ms−1 respectively. Find acceleration of the particle at t=i sec.
View Solution
