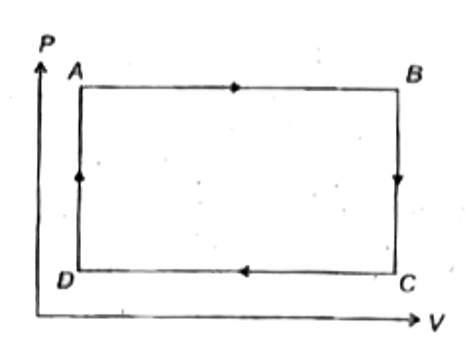
The pressure and volume of a gas are changed as shown in the p-V diagram in the figrue ahead. The thmperature of the gas

increases as if goes from A to B
Increases as it goes from B to C
Remains constant during these changes
Decreases as it goes from D to A
Once again plot the rectangular cycle aginst the beckground of various dotted isothermal lines.

Note here T8>T7>T6>T5>…>T1. So, in the process D to A the temperature increases. In A to B it further increases. In B to C it decreases and in C to D it decreases. So, the correct respone is (1).
Topper's Solved these Questions
- THERMODYNAMICSBOOK - AAKASH INSTITUTECHAPTER - THERMODYNAMICSEXERCISE - TRY YOURSELF
12 Videos
- THERMODYNAMICSBOOK - AAKASH INSTITUTECHAPTER - THERMODYNAMICSEXERCISE - EXERCISE
19 Videos
- THERMODYNAMICSBOOK - AAKASH INSTITUTECHAPTER - THERMODYNAMICSEXERCISE - Assignment (Section-J) Aakash Challengers Questions
5 Videos
- THERMAL PROPERTIES OF MATTERBOOK - AAKASH INSTITUTECHAPTER - THERMAL PROPERTIES OF MATTEREXERCISE - Assignment (Section-J) Akash Challengers Questions
7 Videos
- UNITS AND MEASUREMENTSBOOK - AAKASH INSTITUTECHAPTER - UNITS AND MEASUREMENTSEXERCISE - ASSIGNMENT (SECTION - D)
15 Videos
Similar Questions
Knowledge Check
The pressure P and volume V of an ideal gas both decreases in a process.
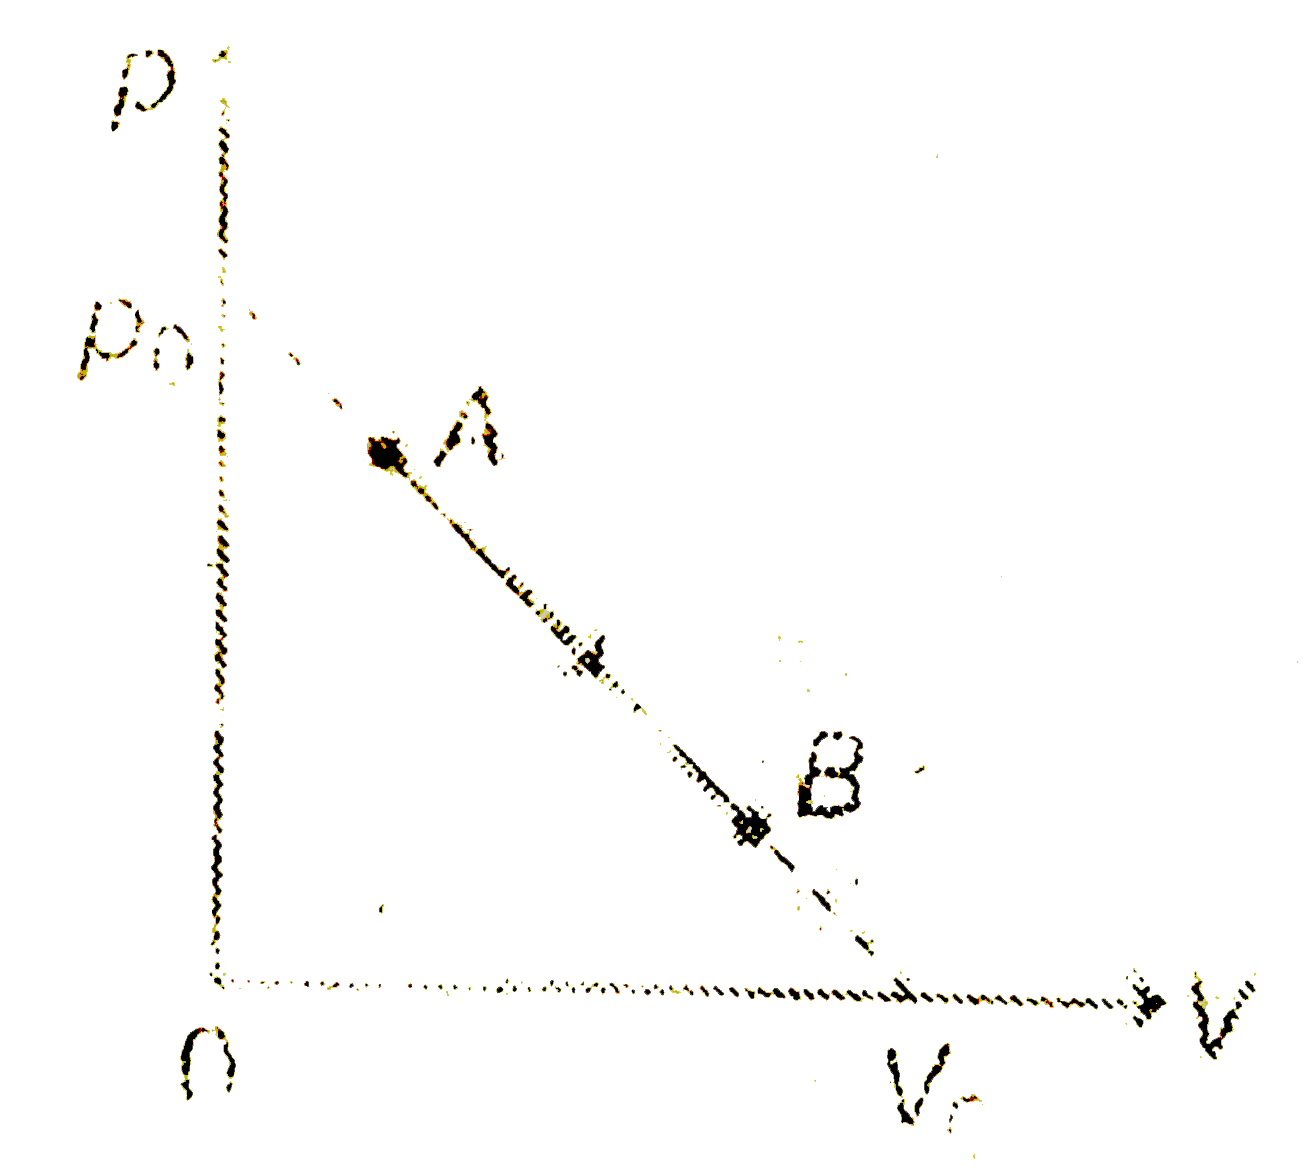
Asuch a process is not possible.BThe work done by the system is positive.CThe tempreture of the system must increase.DHeat supplied to the gas is equal to the change in internal energy.One mole of an ideal monotomic gas undergoes a linear process from A to B in which its pressure p and its volume V change as shown in figure.

The maximum temperature of the gas during this process isAp0V02RBp0V04RC3p0V04RD3p0V02RThe pressure p and volume V of an ideal gas both increase in a process.
Asuch a process is not possible.BThe work done by the system is positive.CThe tempreture of the system must increase.DHeat supplied to the gas is equal to the change in internal energy.
The pressure P and volume V of an ideal gas both decreases in a process.
View SolutionOne mole of an ideal monotomic gas undergoes a linear process from A to B in which its pressure p and its volume V change as shown in figure.

The maximum temperature of the gas during this process is
View SolutionThe pressure p and volume V of an ideal gas both increase in a process.
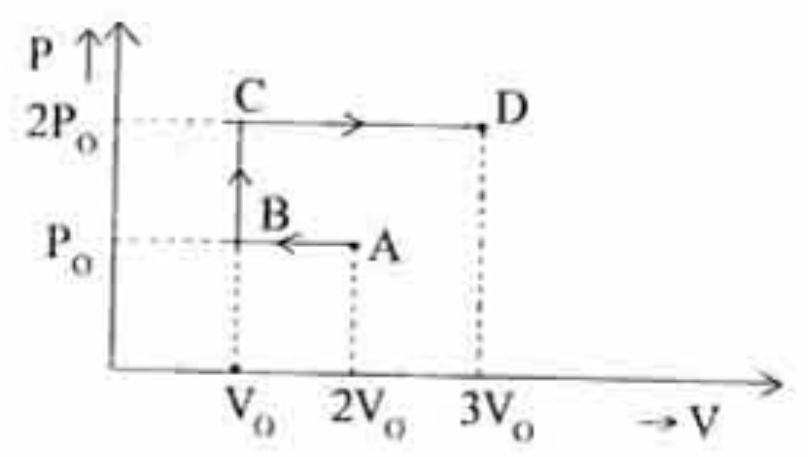
View SolutionThe work done by the gas in the process shown in given P-V diagram is

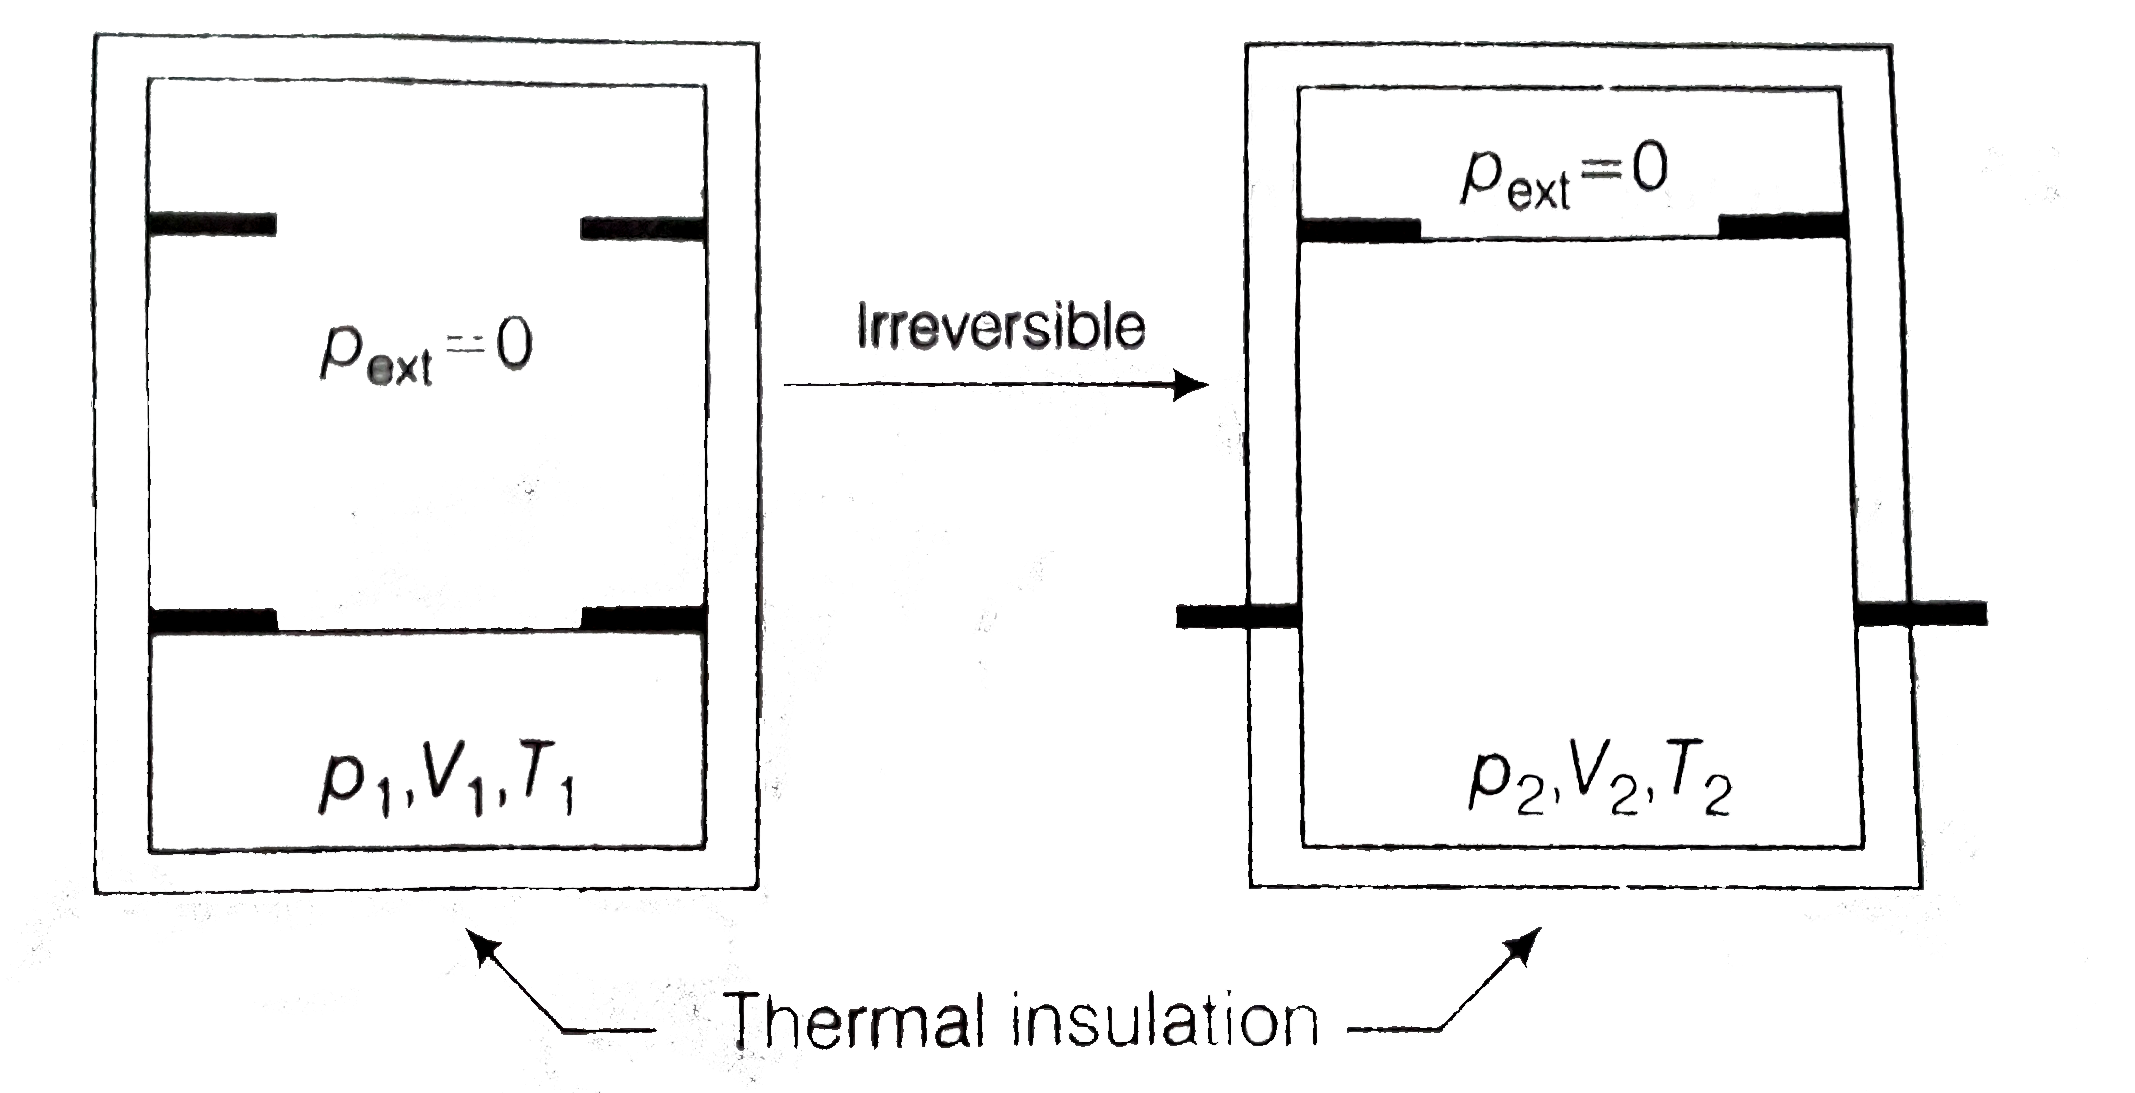
View SolutionAn ideal gas in thermally insulated vessel at internal (pressure)=P1,(volume)=V1 and absolute temperature=T1 expands irreversiby against zero external, pressure , as shown in the diagram,
The final internal pressure, volume and absolute temperature of the gas are p2,V2andT2, respectively . For this expansion

View Solution


